CloudLens utilizes Simple Log Service (SLS) to deliver unified observability for cloud services by analyzing data such as logs, metrics, and configuration data. This analysis supports key features for Alibaba Cloud services, including usage analysis, performance monitoring, security analysis, data protection, anomaly detection, and access analysis. CloudLens helps you quickly establish observability across six dimensions: cost, performance, security, data protection, stability, and access patterns, leading to more effective use of your cloud resources.
A delay of 1 to 3 minutes may occur when CloudLens writes data, which is normal.
CloudLens applications
The CloudLens series includes the following applications:
Background
By adopting the cloud, enterprises can leverage the elasticity and rapid innovation of cloud services to quickly build and iterate their business applications. Cloud services play a major role in the system architecture of an enterprise. As enterprises adopt more cloud services, product-level observability becomes a critical component of their overall observability strategy.
Pain points and challenges
After cloud adoption, enterprises face pain points and challenges in two main areas.
Using and managing cloud services
Data silos: Data is scattered across multiple systems. This requires switching between different platforms and prevents a unified view.
Lack of correlated analysis: There is no unified method for correlating data such as logs, metrics, and configuration details across different cloud services.
Lack of timeliness and flexibility: Real-time alerting, large-scale data analysis, and flexible analysis by granularity, dimension, or operator are difficult to implement.
High learning curve and lack of best practices: Without deep product knowledge, it is difficult to effectively analyze performance data. This can lead to issues such as improper use, abnormal usage, and incorrect security configurations.
Building observability for cloud services
Usage management: Are resource usage and costs under control? Is there any unreasonable or abnormal usage?
Performance monitoring: Are the performance metrics of cloud services abnormal? Can alerts be triggered promptly to avoid business impact?
Security and compliance: How can you ensure access security and data security?
Stability: Can you promptly detect exceptions, failures, and availability issues? How can you improve troubleshooting efficiency through log analysis and O&M monitoring?
Access governance analysis: How can you analyze business operations and product usage patterns?
Enterprises need to optimize their cloud usage to mitigate unnecessary costs and risks arising from misconfigurations or improper use.
Benefits
Centralized collection of O&M data from cloud services: Automatically collect data such as metering data, metrics, access logs, and audit logs across accounts and regions.
Comprehensive observability: Gain insights into usage, access patterns, performance, anomalies, security, and data protection.
Flexible data consumption: Supports various consumption methods, including consumer groups, APIs, and Grafana integration.
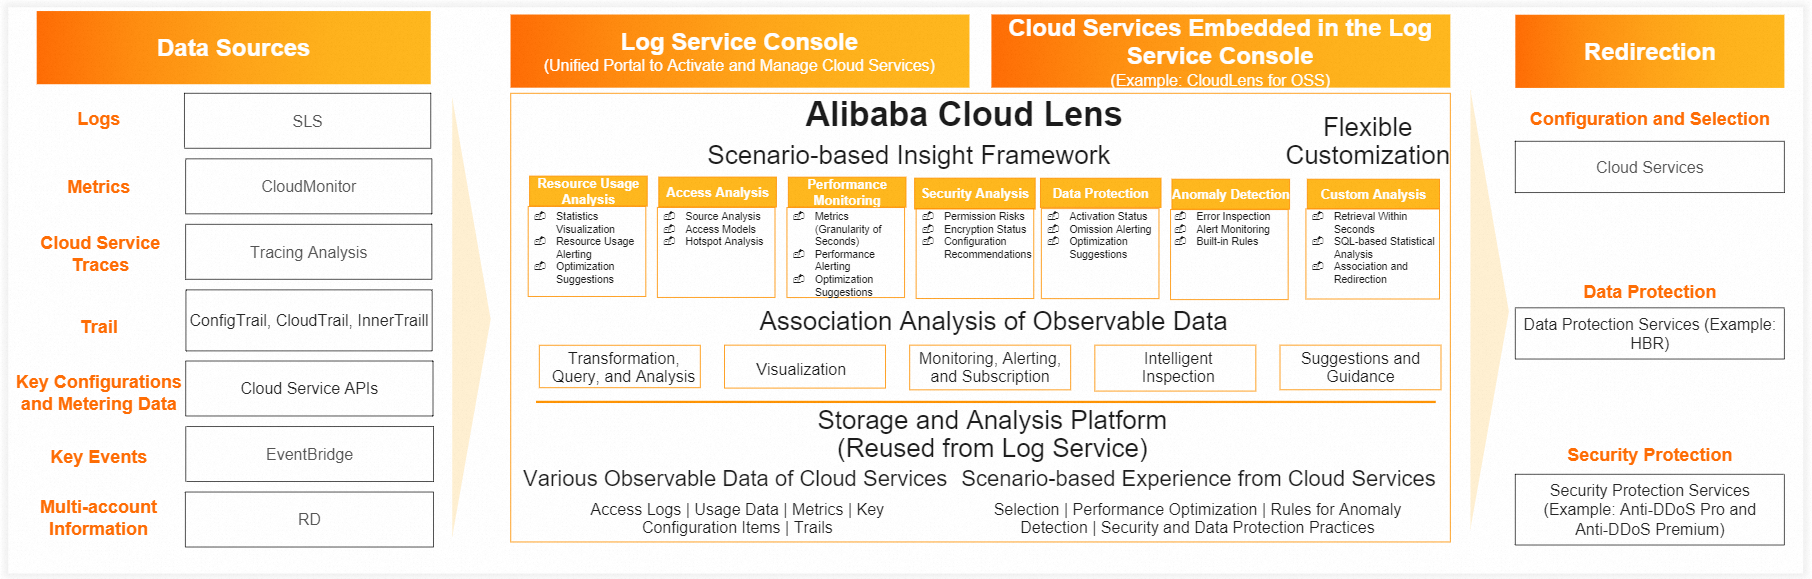
Architecture
CloudLens is built on the storage and analysis capabilities of SLS. It connects to and collects various types of data from cloud services, such as logs, metrics, trace data, trails, key configuration metering data, key events, and multi-account information. CloudLens then provides unified, scenario-based dashboards for access analysis, usage analysis, exception monitoring, performance monitoring, security analysis, and data protection. These dashboards help you understand the usage and activities of cloud services within your organization across categories such as storage, security, networking, traffic, and databases.
CloudLens supports association analysis of data such as logs, metrics, and metering data, and provides various features, including data transformation, query and analysis, visualization, alert subscriptions, intelligent inspection, and troubleshooting guidance.
Each CloudLens application provides common feature modules and a Data Access Management module that includes Provisioning, destination database management, and automated collection configuration. You can access each CloudLens application through the CloudLens entry point in SLS or the console of a cloud service.
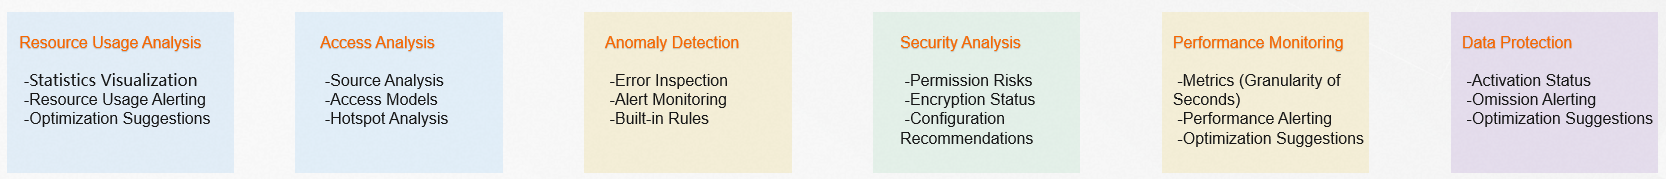
Features
Usage analysis: Analyze resource usage from multiple dimensions, configure alerts, and detect inefficient or anomalous patterns.
Access analysis: Analyze access data to assist with product usage and business operations analysis.
Anomaly detection: Promptly detect issues like high error rates and low availability to enhance business stability. This includes pre-built detection rules based on common but often-missed issues, such as those found in support tickets or causing unexpected fees. Examples include OSS internet traffic theft, abnormally frequent retrieval of Infrequent Access (IA) or Archive objects, and early deletion due to incorrect storage class selection. You can create custom alert rules or use built-in alert monitoring rules.
Security analysis: View information such as permissions and encryption to monitor for malicious access. This helps prevent data security issues caused by improper use.
Performance monitoring: Monitor performance metrics for real-time alerting.
The ability to retrieve performance metric data varies by product.
Data protection: View the status of data protection and receive recommendations. This feature provides recommendations and guidance on using data protection features or related cloud services. For example, you can use storage features, such as monitoring and viewing the status of disaster recovery, snapshots, and versioning, or use Cloud Backup to enable data protection.
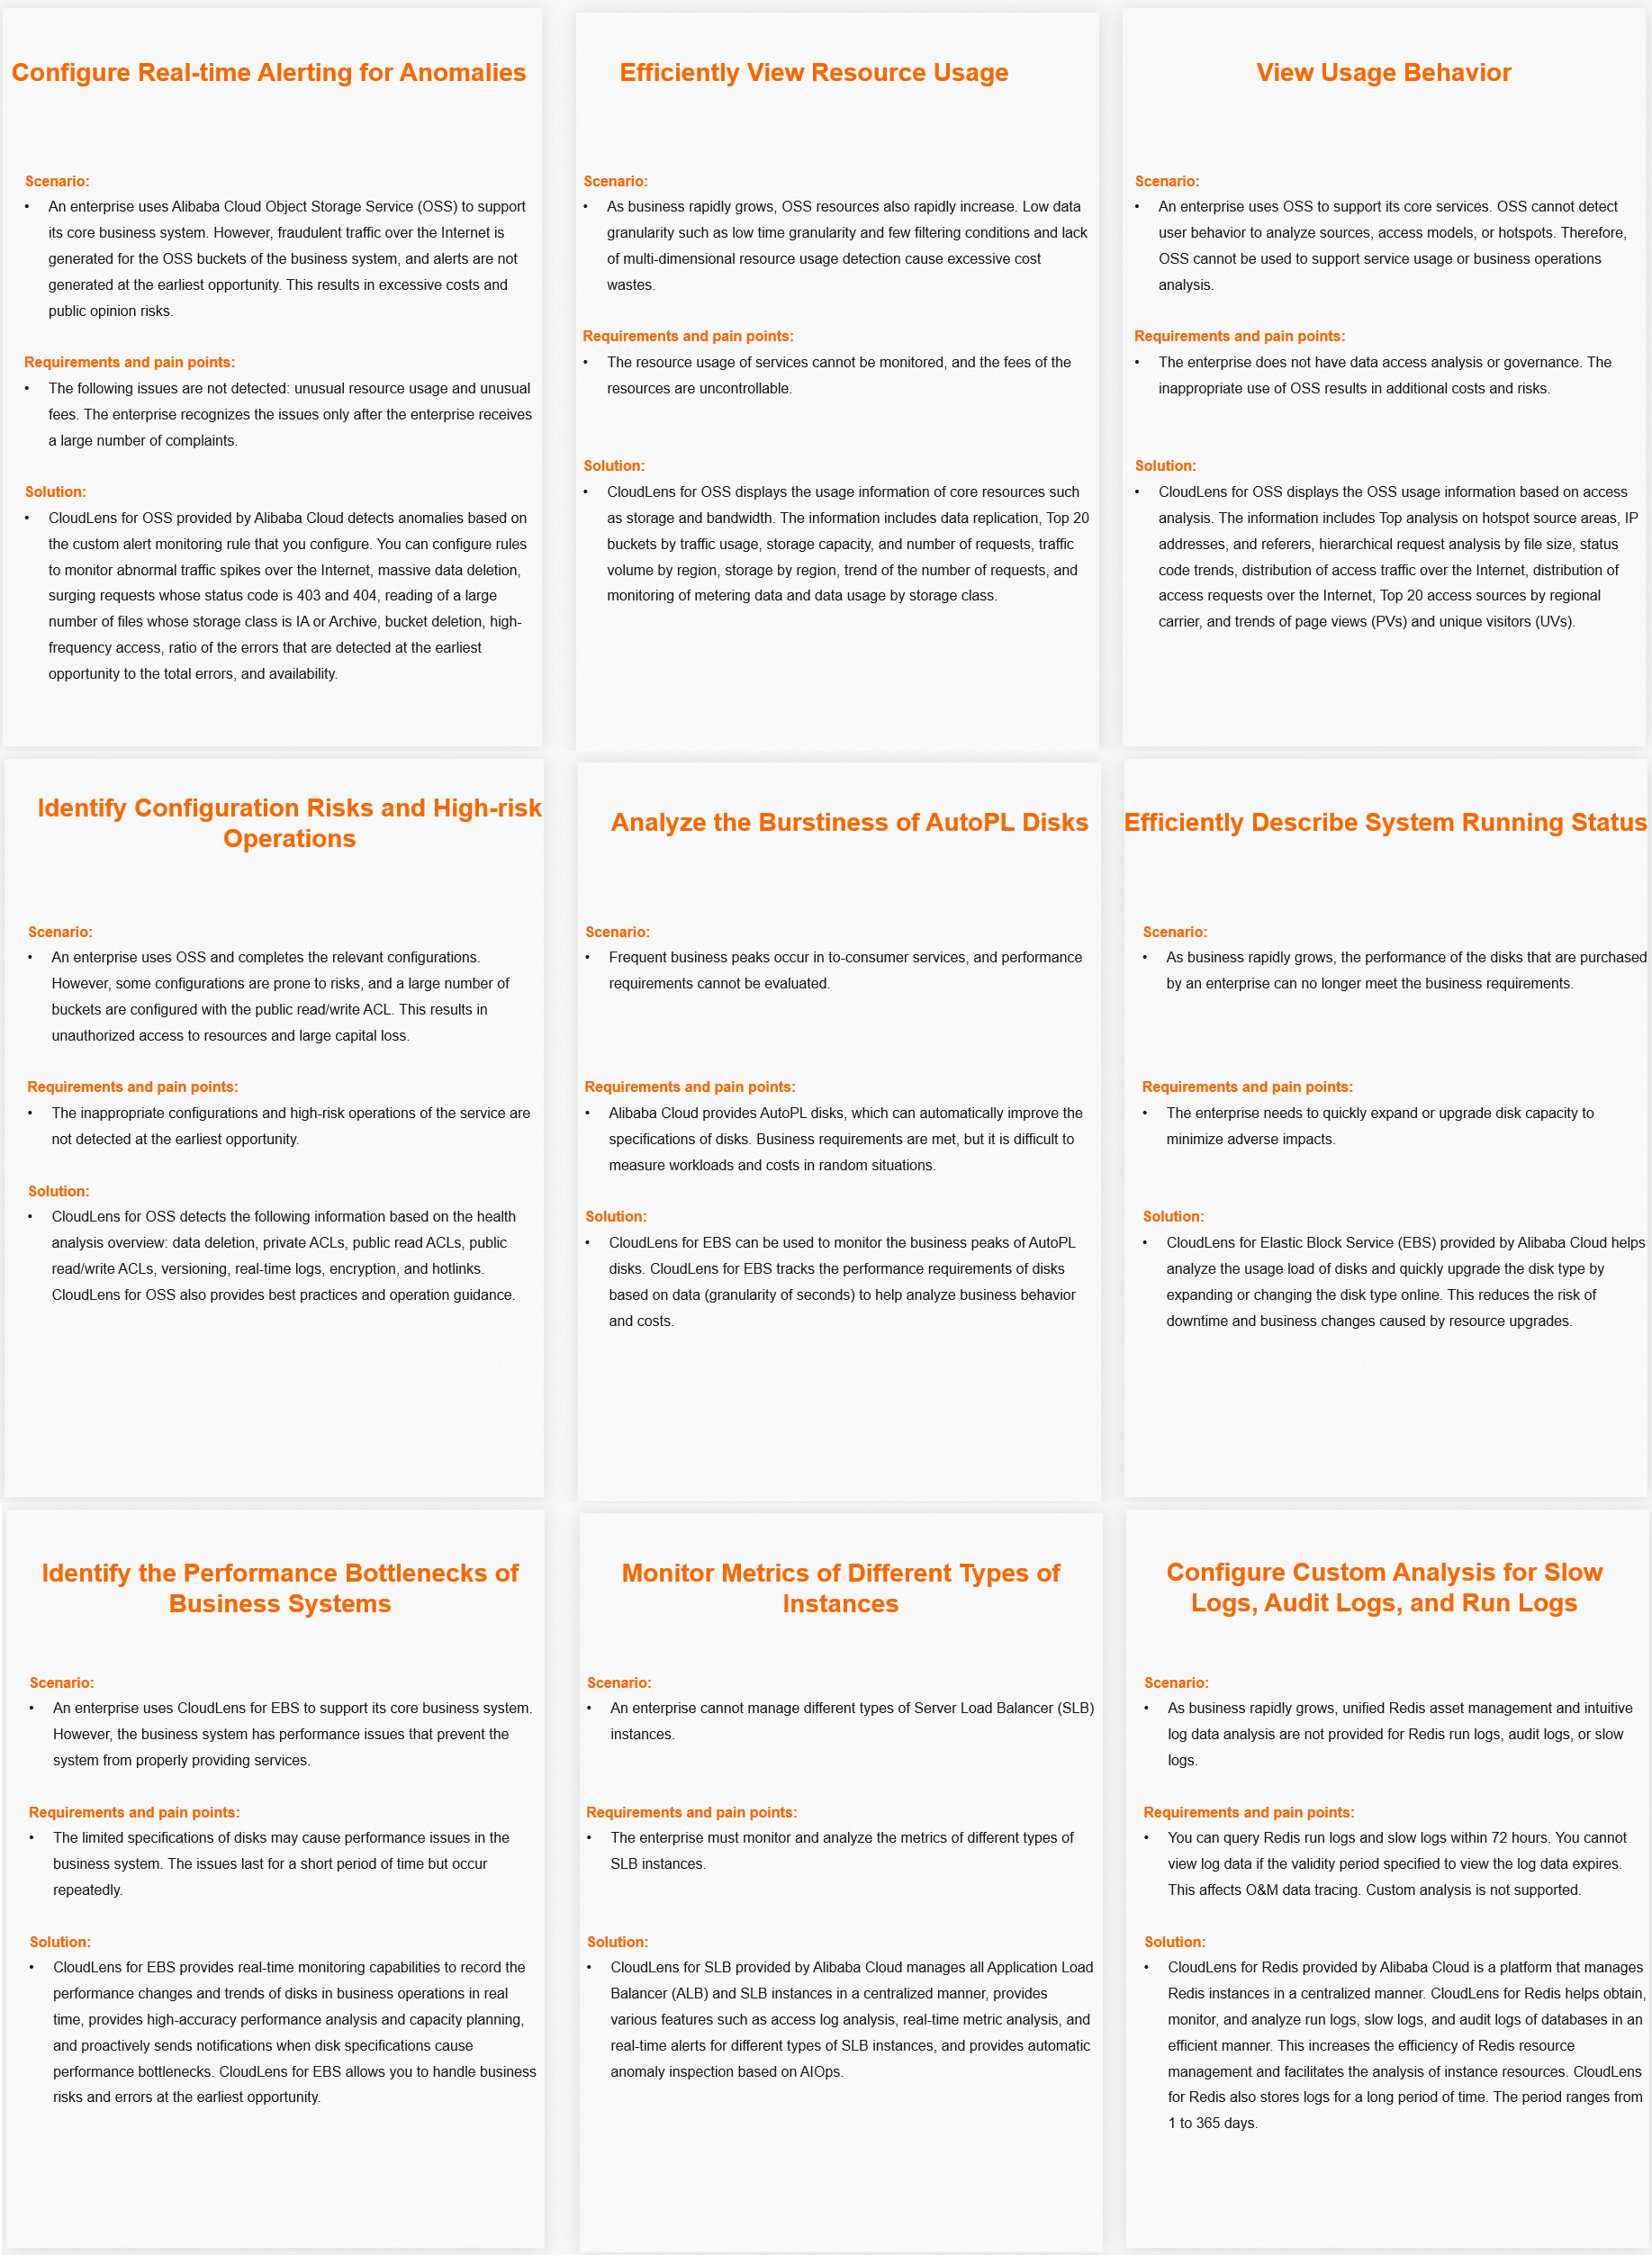
Use cases
CloudLens provides observability through several use cases. These include real-time alerting for exceptions and failures, quick resource usage reviews, and usage behavior visualization. It also helps in discovering configuration risks and high-risk operations, performing burst performance analysis for AutoPL disks, and summarizing system status. Additionally, it identifies performance bottlenecks in business systems, monitors metrics for different instance types, and allows custom analysis of slow queries, audit logs, and runtime logs.