Query and analyze SLB Layer 7 access logs in the Simple Log Service console. View dashboards for global distribution of client PV, request method PV trends, status code PV trends, client PV heat map, and distribution of status codes.
Background
SLB is a fundamental infrastructure component for most cloud architectures. Continuous monitoring and diagnosis of SLB is critical. Alibaba Cloud SLB distributes traffic across multiple ECS instances to expand service capacity and eliminate single points of failure.
SLB access logging supports Layer 7 load balancing over HTTP and HTTPS. For the full list of fields, see Log fields. Typical metrics include:
-
PV (Page View): The total number of HTTP or HTTPS requests initiated by clients.
-
UV (Unique Visitor): The total number of unique clients. Multiple requests from the same client are counted only once.
-
Request success rate: The percentage of total PVs with a 2xx status code.
-
Request traffic: The total size of request messages sent by clients.
-
Response traffic: The total size in bytes of the HTTP body that SLB returns to clients.
-
Request hotspot distribution: Client locations are aggregated to calculate PV statistics for each geographic region.
Prerequisites
Layer 7 access logging is enabled for SLB. Enable access logging.
View a dashboard
Log on to the Simple Log Service console.
In the Projects section, click the one you want.

-
In the left-side navigation pane, choose Dashboard > Dashboards.
-
In the list of dashboards, click the target dashboard. Available dashboards include slb-user-log-slb_layer7_operation_center_en and slb-user-log-slb_layer7_access_center_en.
NoteTo view the query and analysis statement for a chart, choose
 > Preview Query Statement in the upper-right corner of the chart.
-
Business overview
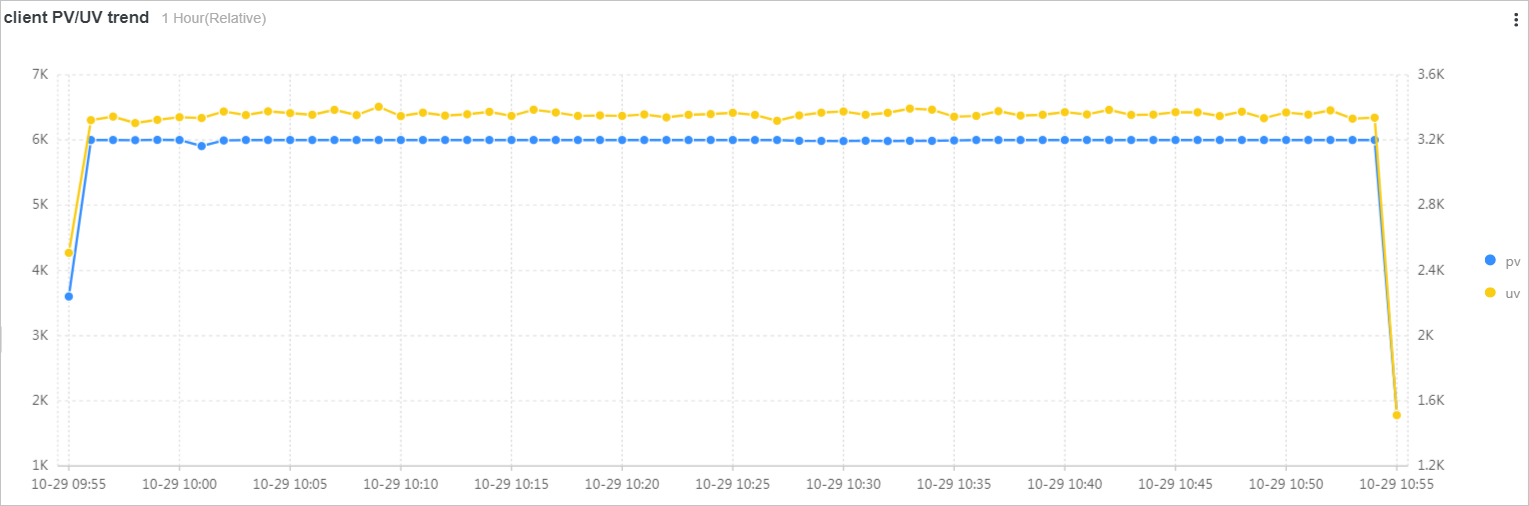
Use a filter to view PV and UV trends for a specific SLB instance. Add a filter.
-
Analyze traffic and latency (
slb_layer7_access_center_cn)-
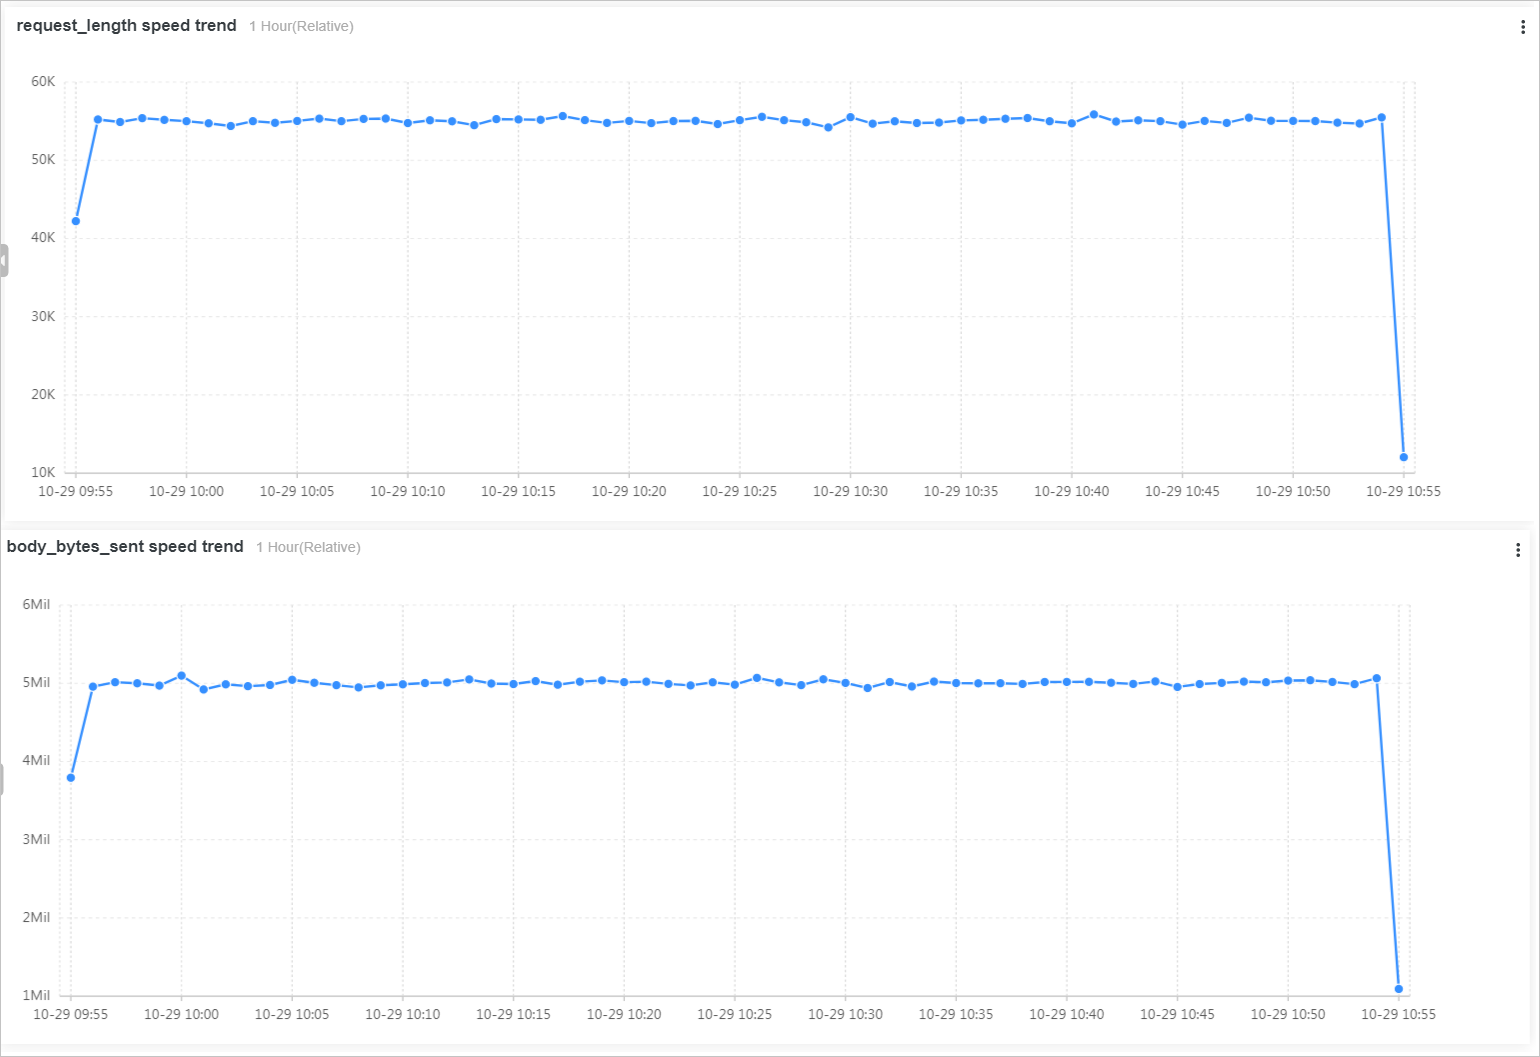
View request and response traffic statistics for a specified time range.
-
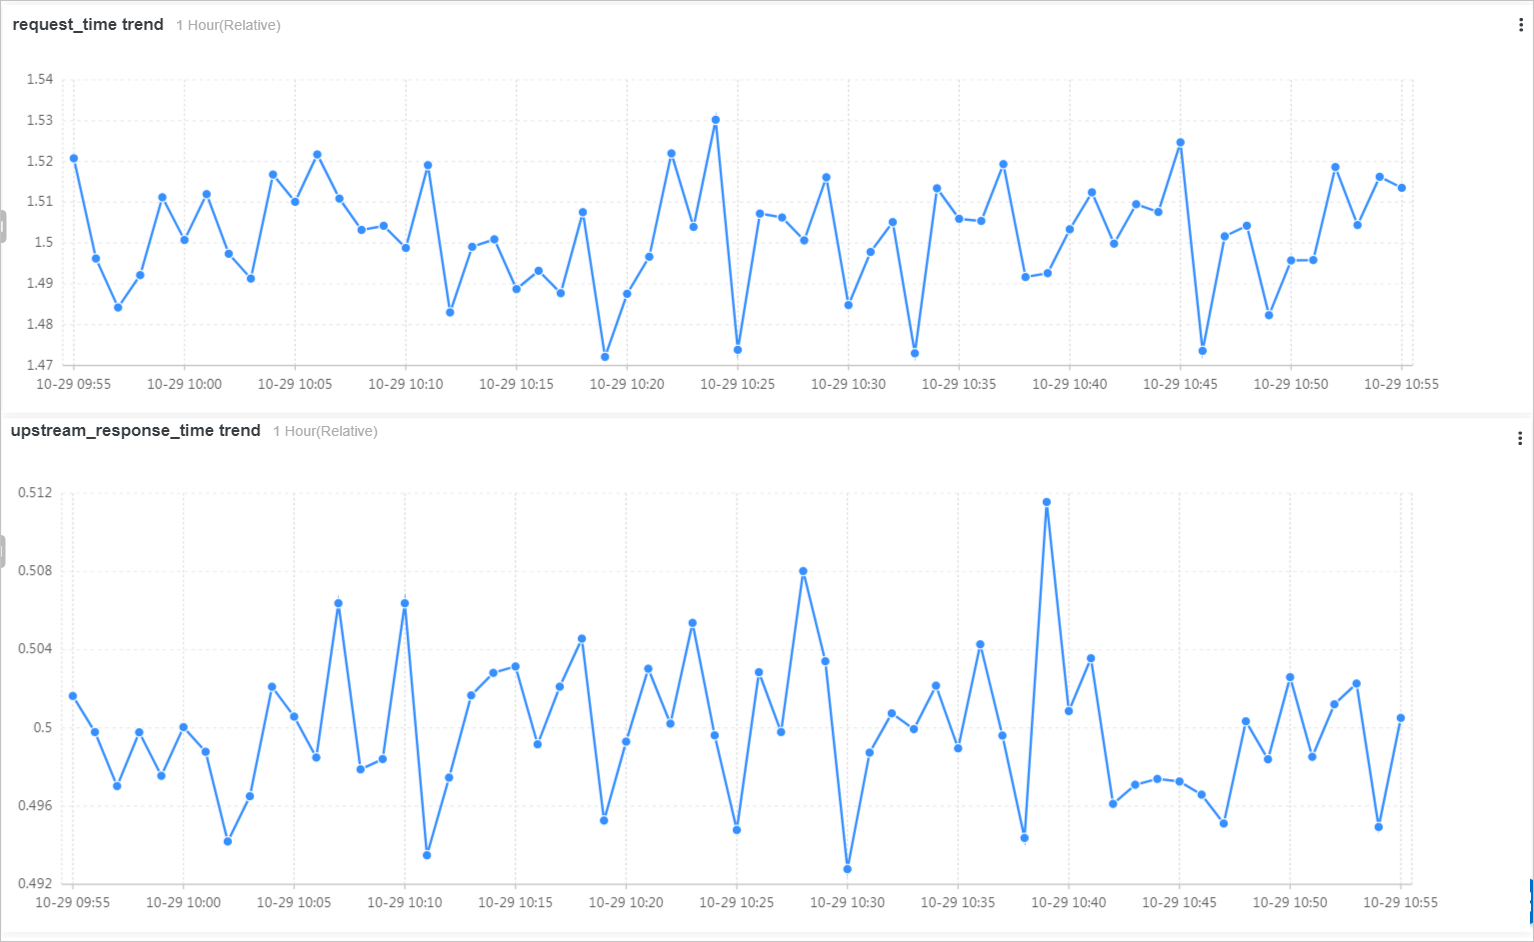
View request response time and upstream response time trends for a specified time range.
-
View high-latency request statistics. The top upstream response time panel shows per-backend-server statistics: SLB instance ID, Backend server, Average upstream response time, PV, request traffic, response traffic, and 2xx/3xx/4xx/5xx status code ratios.
-
-
Analyze user requests (
slb_layer7_operation_center_cn)-
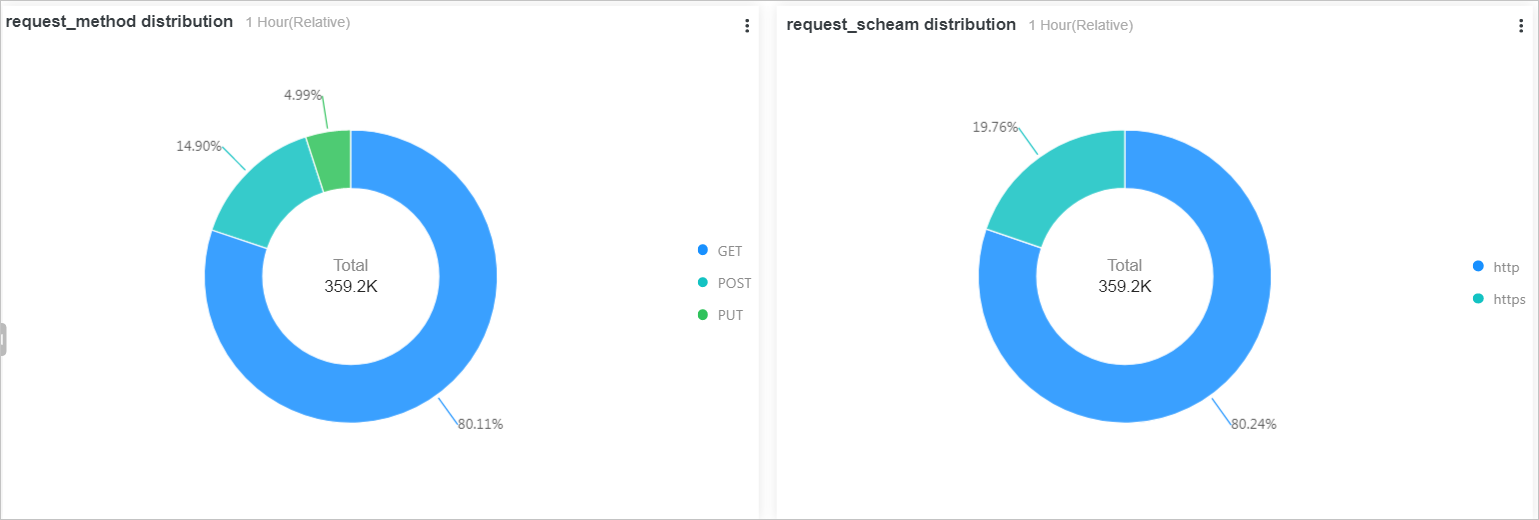
View request method and protocol distribution for a specified time range.
-
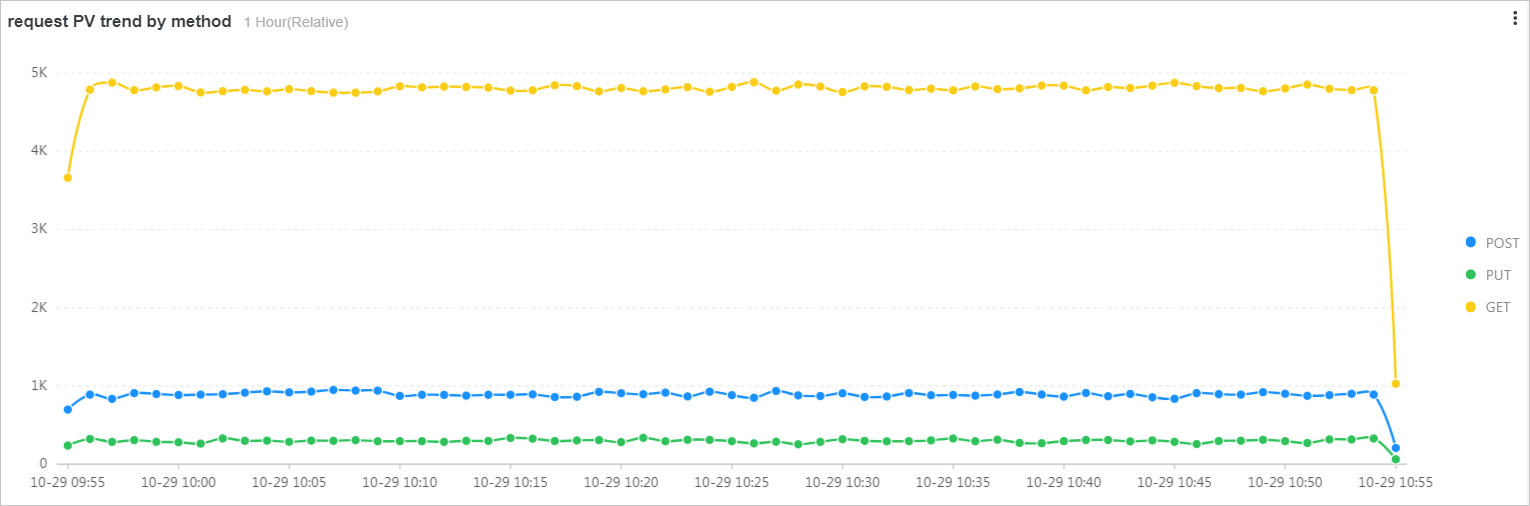
View PV trends by request method for a specified time range.
-
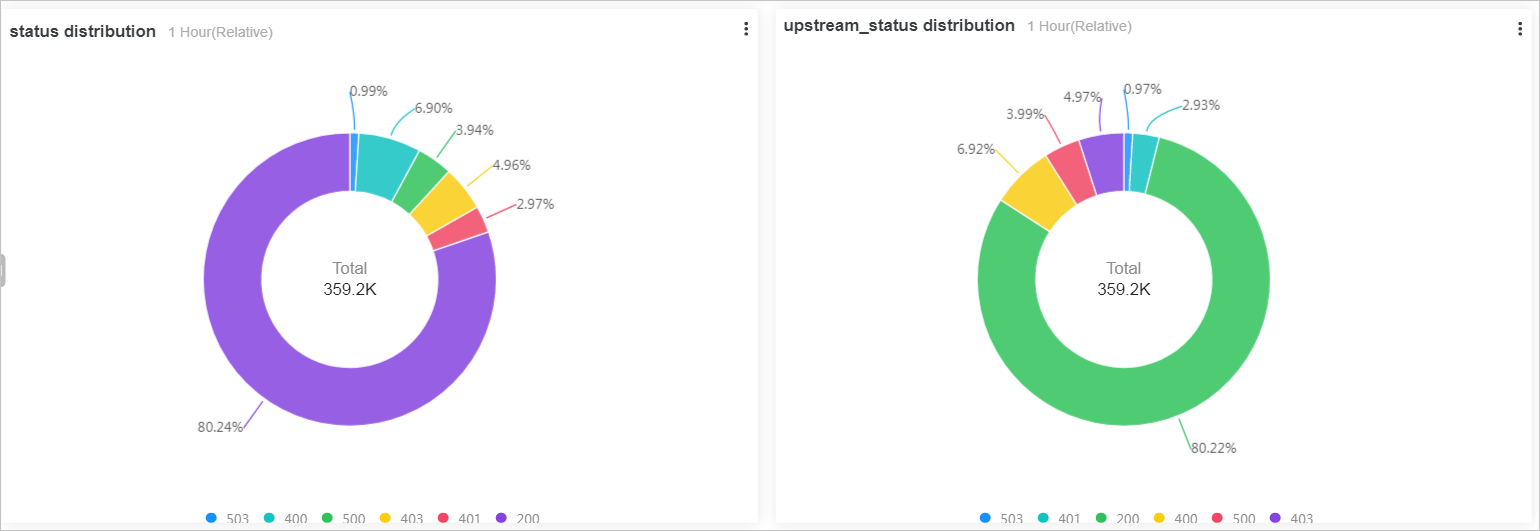
View service status for a specified time range.
A high number of 5xx status codes indicates internal application errors on the RealServer.
-
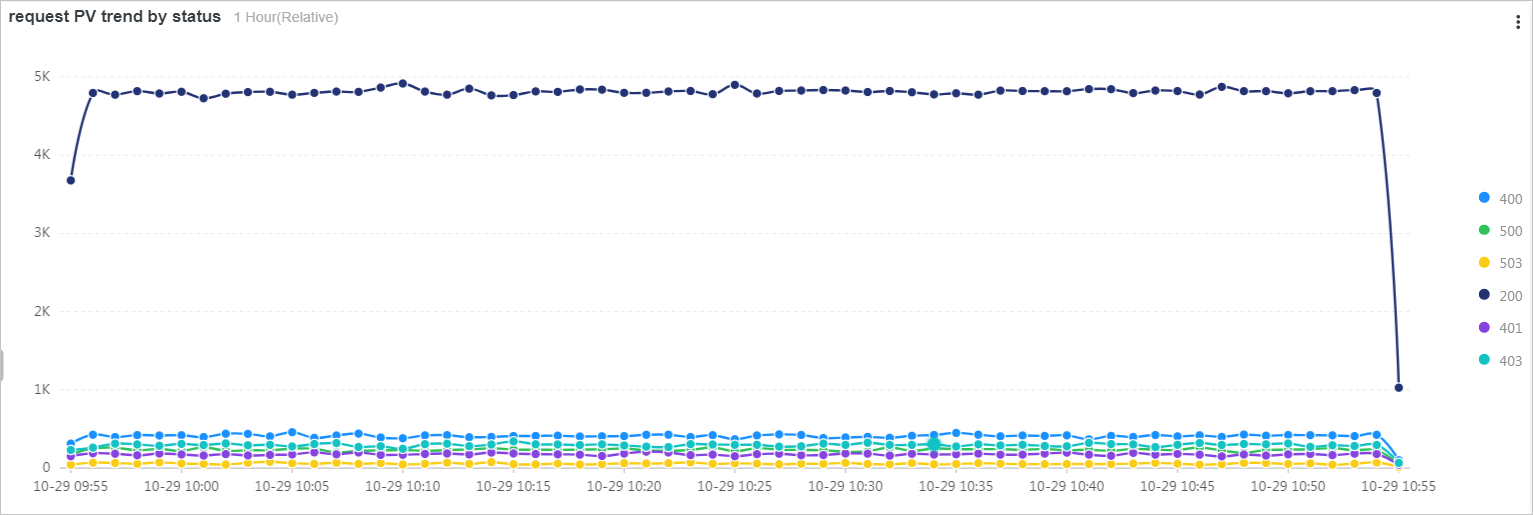
View PV trends by status code for a specified time range.
-
-
Analyze request sources
-
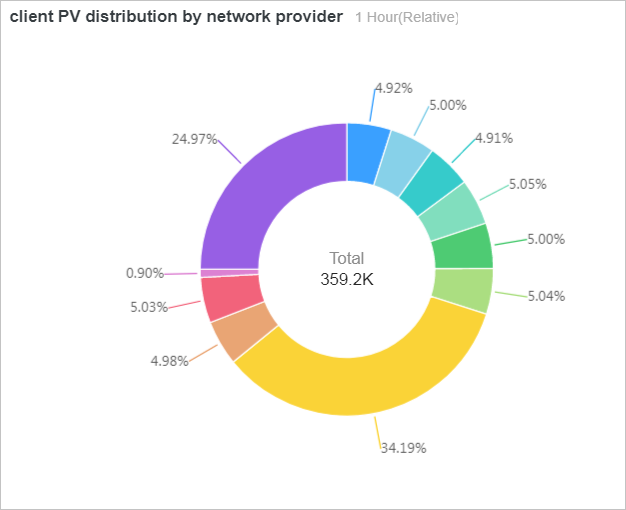
View client ISP distribution.
-
View client geographic locations (country, province, city). The top clients 1 hour (relative) table shows top clients by access volume with columns: Client IP, PV, Region, City, ISP, Request traffic (MB), and Response traffic (MB).
-
View user agent information.
The user agent (http_user_agent) identifies the client application accessing your service. Low-frequency crawling benefits SEO, but high-PV crawler requests can waste resources. The top user agents table shows access statistics sorted by PV: User agent, PV, Request traffic (MB), Response traffic (MB), 2xx ratio (%), 3xx ratio (%), 4xx ratio (%), and 5xx ratio (%).
-
-
Operations overview
Analyze host and URI traffic to identify popular content and refine your content strategy. The Operations overview dashboard contains two tables: top host 1 hour (relative) and top uri 1 hour (relative). Both show PV, request traffic (MB), response traffic (MB), and status code ratios (2xx/3xx/4xx/5xx) by host or request URI.
-
Analyze request scheduling with a Sankey diagram
SLB distributes client traffic to backend RealServers. It automatically detects unhealthy servers and redistributes traffic to healthy ones, resuming distribution after recovery.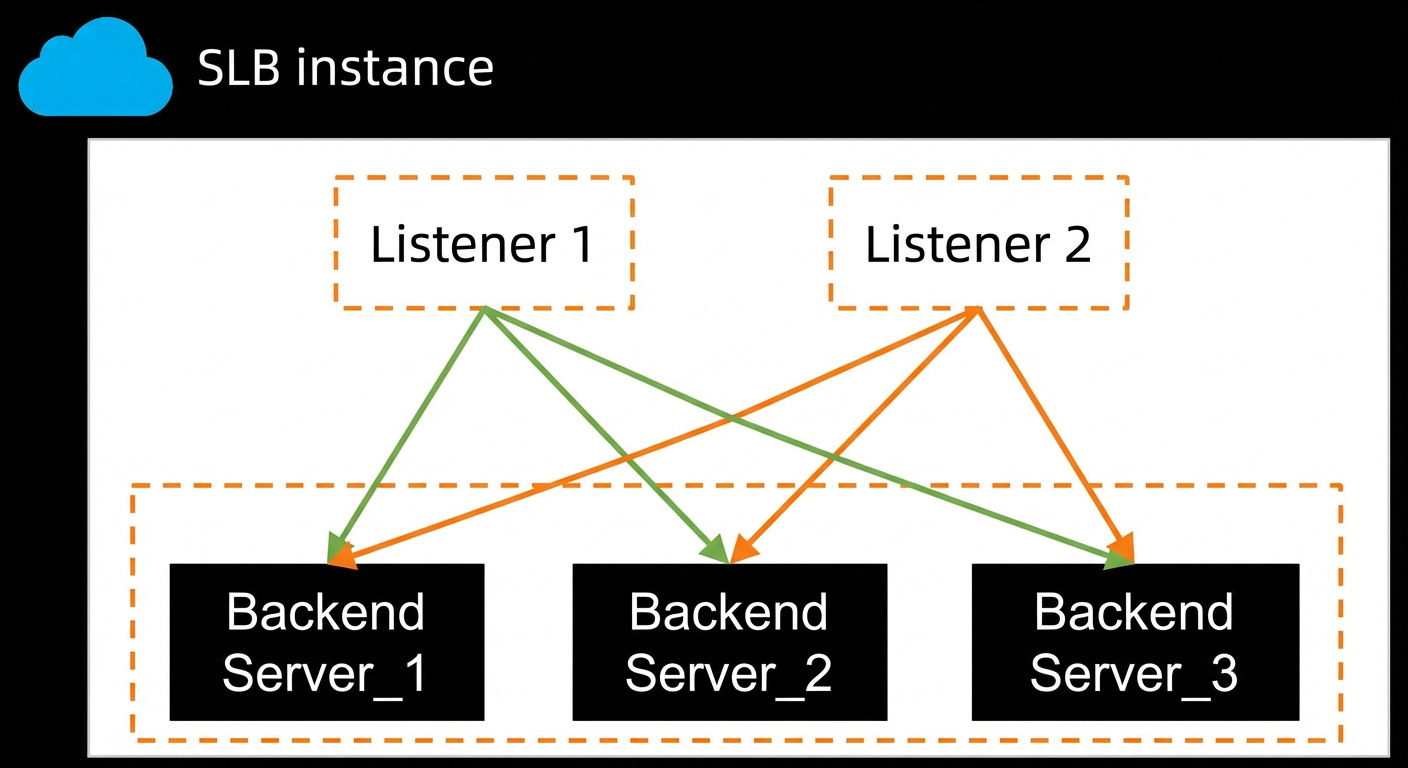
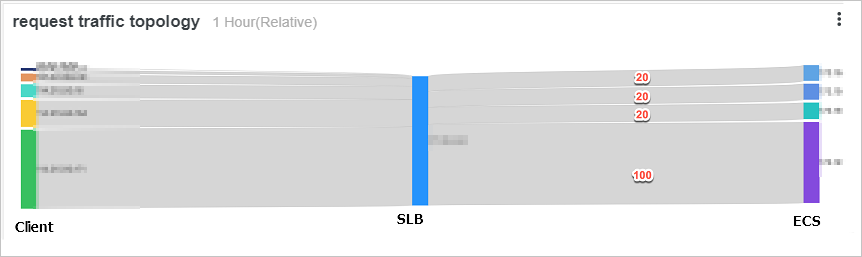
For example, an SLB instance has four backend servers. One of them (192.168.0.0) also functions as a jump server and has four times the performance of the others. Its listener weight is set to 100 while the others are set to 20. The following query analyzes the traffic distribution.
* | select COALESCE(client_ip, vip_addr, upstream_addr) as source, COALESCE(upstream_addr, vip_addr, client_ip) as dest, sum(request_length) as inflow group by grouping sets( (client_ip, vip_addr), (vip_addr, upstream_addr))The Sankey diagram shows the load on each RealServer. Traffic is distributed at a ratio approximating the configured weights of 20:20:20:100.