After Simple Log Service collects your Apache logs, you can use a dashboard to analyze metrics such as page views (PV), unique visitors (UV), visitor geographic distribution, error requests, and client types to evaluate your website's performance.
Prerequisites
You have created a logtail configuration to collect Apache logs. For instructions, see Collect text logs from servers. In Step 2 of the procedure, select Apache-Text Logs.
Background
Apache is a popular web server. When you use Apache to build a website, its logs provide crucial information for operations and maintenance.
Simple Log Service provides a data import wizard to streamline the collection of Apache logs and automatically creates an index and a dashboard. The Apache access log dashboard outlines your website traffic, including charts for Distribution of IP addresses, HTTP status codes, Request methods, PV/UV statistics, Inbound and outbound traffic, User agents, Top 10 referers, Top 10 URIs by number of requests, and Top 10 URIs by request latency.
Procedure
Log on to the Simple Log Service console.
In the Projects section, click the one you want.

-
In the left-side navigation pane, choose and click the ${LogStore name}_Apache access log dashboard.
The Apache access log dashboard includes the following charts:
-
The Distribution of IP addresses chart shows the geographic location of visitor IP addresses. This chart uses the following query:
* | select ip_to_province(remote_addr) as address, count(1) as c group by ip_to_province(remote_addr) limit 100 -
The HTTP status codes chart shows the percentage of each HTTP status code over the last 24 hours. This chart uses the following query:
* | select status, count(1) as pv group by status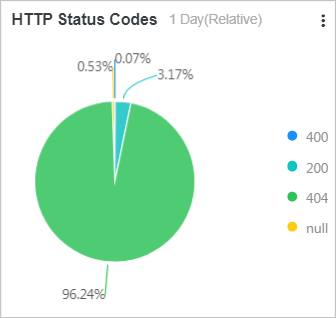
-
The Request methods chart shows the percentage of each request method over the last 24 hours. This chart uses the following query:
* | select request_method, count(1) as pv group by request_method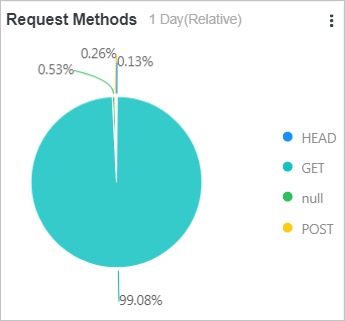
-
The PV/UV statistics chart shows the number of page views (PV) and unique visitors (UV) over the last 24 hours. This chart uses the following query:
* | select date_format(date_trunc('hour', __time__), '%m-%d %H:%i') as time, count(1) as pv, approx_distinct(remote_addr) as uv group by date_format(date_trunc('hour', __time__), '%m-%d %H:%i') order by time limit 1000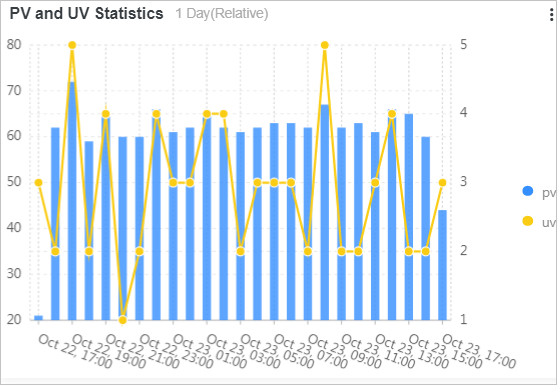
-
The Inbound and outbound traffic chart shows the amount of inbound and outbound traffic. This chart uses the following query:
* | select date_format(date_trunc('hour', __time__), '%m-%d %H:%i') as time, sum(bytes_sent) as net_out, sum(bytes_received) as net_in group by time order by time limit 10000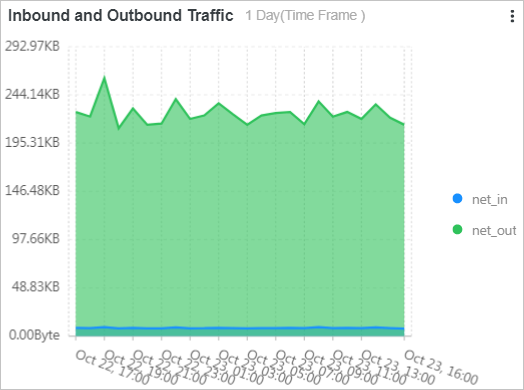
-
The User agents chart shows the percentage of different browsers over the last 24 hours. This chart uses the following query:
* | select case when http_user_agent like '%Chrome%' then 'Chrome' when http_user_agent like '%Firefox%' then 'Firefox' when http_user_agent like '%Safari%' then 'Safari' else 'unKnown' end as http_user_agent, count(1) as pv group by case when http_user_agent like '%Chrome%' then 'Chrome' when http_user_agent like '%Firefox%' then 'Firefox' when http_user_agent like '%Safari%' then 'Safari' else 'unKnown' end order by pv desc limit 10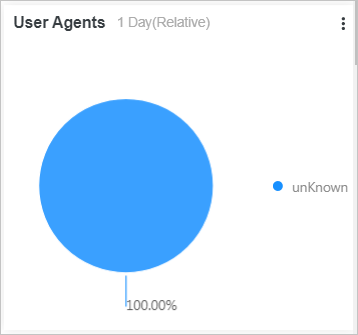
-
The Top 10 referers chart shows the top 10 referers by page views (PV) over the last 24 hours. This chart uses the following query:
* | select http_referer, count(1) as pv group by http_referer order by pv desc limit 10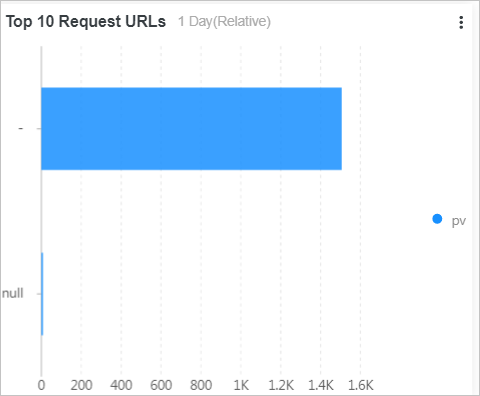
-
The Top 10 URIs by number of requests chart shows the top 10 URIs by number of requests (PV) over the last 24 hours. This chart uses the following query:
* | select split_part(request_uri,'?',1) as path, count(1) as pv group by split_part(request_uri,'?',1) order by pv desc limit 10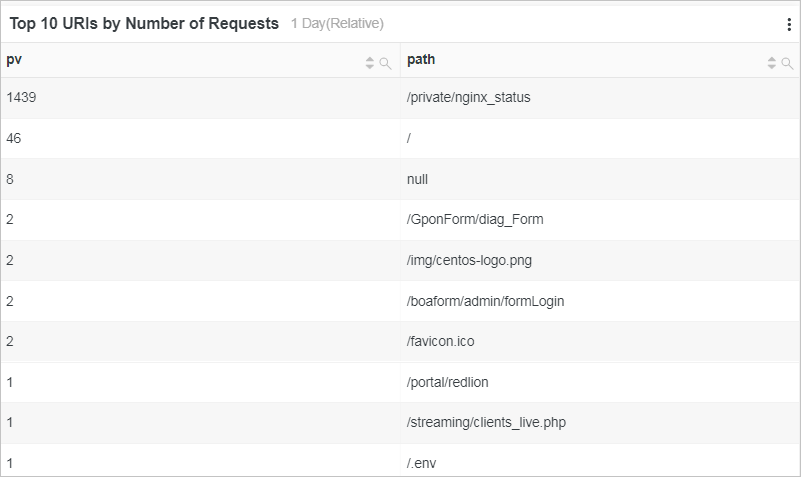
-
The Top 10 URIs by request latency chart shows the top 10 URIs by request latency over the last 24 hours. This chart uses the following query:
* | select request_uri as top_latency_request_uri,
            request_time_sec
            order by request_time_sec desc limit 10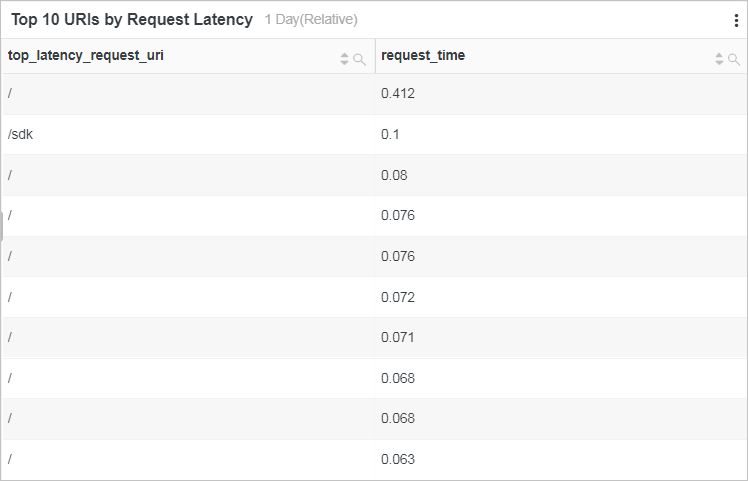
-