All Products
Search
Document Center

Server Load Balancer:View the monitoring information about an ALB instance

Last Updated:Dec 26, 2023

You can use CloudMonitor to view the status and metrics of Application Load Balancer (ALB) resources to quickly troubleshoot issues when requests to your ALB instance time out or traffic throttling is triggered. You can view the monitoring information about ALB resources by using the console, API, or SDK.

View monitoring information in the ALB console

  1. Log on to the ALB console.
  2. In the top navigation bar, select the region where the ALB instance is deployed.

  3. Use one of the following methods to view the monitoring information.

    • View the monitoring data on the Instances page

      1. On the Instances page, find the instance that you want to manage and click monitor in the Monitoring column.

      2. In the Monitoring Information panel, you can click the ALB Instance, Listener, or VIP (Zone) tab to view the monitoring data.

    • View the data on the instance details page

      1. On the Instances page, find the instance that you want to manage and click its ID. On the Instance Details tab, click the Charts tab.

      2. On the Charts tab, click the Instance, Listener, or VIP (Zone) tab to view the monitoring data.

    Note
    • You can view the metrics on the VIP (Zone) tab only if your ALB instance is assigned a static IP address. To create alert rules for the metrics on the VIP (Zone) tab, log on to the CloudMonitor console. For more information, see Configure alert rules for ALB metrics.

    • If the instance is a dual-stack ALB instance, you can select All, IPv4, or IPv6 from the Metric Type drop-down list in the upper-left corner of the Monitoring Information panel to view the metrics.

    • On the Listener tab, you can select a listener from the Listener drop-down list to view all metrics of the listener. You can also select Listener, Server Group, or Forwarding Rule from the Dimension drop-down list to view the metrics of the corresponding resource. To view the metrics of a server group or forwarding rule, select the ID of the server group or forwarding rule from the drop-down list.

    • You can set Time to specify a period of time. If you turn on Auto Refresh, the monitoring data is refreshed every minute.

Query monitoring information by calling API operations

This section describes how to query the monitoring metrics and detailed monitoring data of an ALB instance by calling CloudMonitor API operations.

The following figure describes the procedure.monitoring

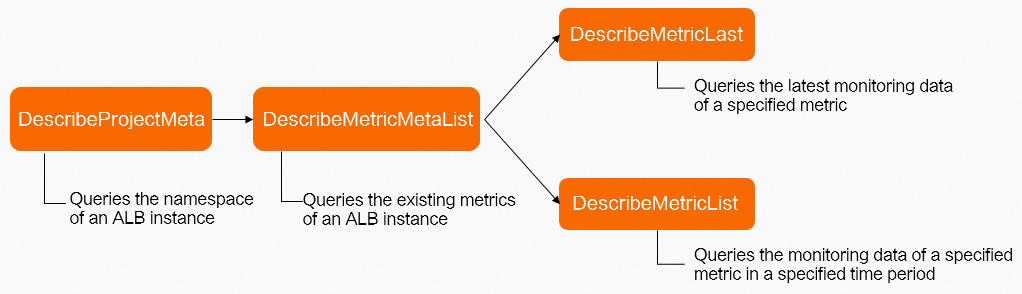
Perform the following steps:

  1. Query the namespace. Call the DescribeProjectMeta operation to query the namespace of ALB in CloudMonitor.

  2. Optional: Query existing metrics. Call the DescribeMetricMetaList operation to query the descriptions of time series metrics supported by CloudMonitor. You can also view the descriptions of the metrics in ALB monitoring metrics.

  3. Query the monitoring data of a metric.

    • Call the DescribeMetricLast operation to query the latest monitoring data of an ALB metric.

    • Call the DescribeMetricList operation to query the monitoring data of an ALB metric within period of time.

DescribeProjectMeta

Call the DescribeProjectMeta operation to query the namespace of ALB in CloudMonitor. For more information, see DescribeProjectMeta.

  1. Log on to OpenAPI Explorer.

  2. Set the Labels parameter to [{"name":"product","value":"alb"}] and use the default values for the other parameters. Then, click Initiate Call.

    View the sample request

    http(s)://[Endpoint]/?Action=DescribeProjectMeta
    &Labels=[{"name":"product","value":"alb"}]
    &<Common request parameters>
  3. Obtain the namespace of ALB in CloudMonitor based on the response parameters. In this example, the value of Namespace is acs_alb.

    View the sample response

    {
      "RequestId": "4B68EC24-DBC8-54FB-8A97-16D9E775503F",
      "PageSize": 30,
      "PageNumber": 1,
      "Total": 1,
      "Resources": {
        "Resource": [
          {
            "Description": "ALB",
            "Labels": "[{\"name\":\"product\",\"value\":\"alb\"},{\"name\":\"productCategory\",\"value\":\"alb\"},{\"name\":\"groupFlag\",\"value\":\"true\"},{\"name\":\"cnName\",\"value\":\"ALB\"},{\"name\":\"enName\",\"value\":\"Application Load Balancer\"}]",
            "Namespace": "acs_alb"
          }
        ]
      },
      "Code": 200,
      "Success": true
    }

DescribeMetricMetaList

Call the DescribeMetricMetaList operation to query the descriptions of time series metrics supported by CloudMonitor. For more information, see DescribeMetricMetaList.

  1. Log on to OpenAPI Explorer.

  2. Set the Namespace parameter to acs_alb and use the default values for the other parameters. Then, click Initiate Call.

    View the example request

    http(s)://[Endpoint]/?Action=DescribeMetricMetaList
    &Namespace=acs_alb
    &<Common request parameters>
  3. View the time series metrics of ALB based on the response parameters.

    View the sample response

    {
      "TotalCount": 80,
      "RequestId": "C072FECF-0BF6-51B9-AEA9-8CF719DCBEF6",
      "Resources": {
        "Resource": [
          {
            "MetricName": "ListenerActiveConnection",
            "Periods": "60,300",
            "Description": "The number of active connections from the client to the ALB instance",
            "Dimensions": "userId,loadBalancerId,listenerProtocol,listenerPort",
            "Labels": "[{\"name\":\"minAlertPeriod\",\"value\":\"60\"},{\"name\":\"alertDefault\",\"value\":\"\"},{\"name\":\"unitFactor\",\"value\":\"1\"},{\"name\":\"alertUnit\",\"value\":\"Count\"},{\"name\":\"productCategory\",\"value\":\"alb\"},{\"name\":\"is_alarm\",\"value\":\"true\"},{\"name\":\"metricCategory\",\"value\":\"listener\"}]",
            "Unit": "Count",
            "Statistics": "Value",
            "Namespace": "acs_alb"
          },
          {
            "MetricName": "ListenerClientTLSNegotiationError",
            "Periods": "60,300",
            "Description": "The number of failed connections per second from the client to the ALB instance due to TLS handshake failures",
            "Dimensions": "userId,loadBalancerId,listenerProtocol,listenerPort",
            "Labels": "[{\"name\":\"minAlertPeriod\",\"value\":\"60\"},{\"name\":\"alertDefault\",\"value\":\"\"},{\"name\":\"unitFactor\",\"value\":\"1\"},{\"name\":\"alertUnit\",\"value\":\"Count/s\"},{\"name\":\"productCategory\",\"value\":\"alb\"},{\"name\":\"is_alarm\",\"value\":\"true\"},{\"name\":\"metricCategory\",\"value\":\"listener\"}]",
            "Unit": "Count/s",
            "Statistics": "Value",
            "Namespace": "acs_alb"
          },
          {
            "MetricName": "ListenerHTTPCode2XX",
            "Periods": "60,300",
            "Description": "The number of HTTP 2XX status codes returned per second",
            "Dimensions": "userId,loadBalancerId,listenerProtocol,listenerPort",
            "Labels": "[{\"name\":\"minAlertPeriod\",\"value\":\"60\"},{\"name\":\"alertDefault\",\"value\":\"\"},{\"name\":\"unitFactor\",\"value\":\"1\"},{\"name\":\"alertUnit\",\"value\":\"Count/s\"},{\"name\":\"productCategory\",\"value\":\"alb\"},{\"name\":\"is_alarm\",\"value\":\"true\"},{\"name\":\"metricCategory\",\"value\":\"listener\"}]",
            "Unit": "Count/s",
            "Statistics": "Value",
            "Namespace": "acs_alb"
          },
          {
            "MetricName": "ListenerHTTPCode3XX",
            "Periods": "60,300",
            "Description": "The number of HTTP 3XX status codes returned per second",
            "Dimensions": "userId,loadBalancerId,listenerProtocol,listenerPort",
            "Labels": "[{\"name\":\"minAlertPeriod\",\"value\":\"60\"},{\"name\":\"alertDefault\",\"value\":\"\"},{\"name\":\"unitFactor\",\"value\":\"1\"},{\"name\":\"alertUnit\",\"value\":\"Count/s\"},{\"name\":\"productCategory\",\"value\":\"alb\"},{\"name\":\"is_alarm\",\"value\":\"true\"},{\"name\":\"metricCategory\",\"value\":\"listener\"}]",
            "Unit": "Count/s",
            "Statistics": "Value",
            "Namespace": "acs_alb"
          },
          {
            "MetricName": "ListenerHTTPCode4XX",
            "Periods": "60,300",
            "Description": "The number of HTTP 4XX status codes returned per second",
            "Dimensions": "userId,loadBalancerId,listenerProtocol,listenerPort",
            "Labels": "[{\"name\":\"minAlertPeriod\",\"value\":\"60\"},{\"name\":\"alertDefault\",\"value\":\"\"},{\"name\":\"unitFactor\",\"value\":\"1\"},{\"name\":\"alertUnit\",\"value\":\"Count/s\"},{\"name\":\"productCategory\",\"value\":\"alb\"},{\"name\":\"is_alarm\",\"value\":\"true\"},{\"name\":\"metricCategory\",\"value\":\"listener\"}]",
            "Unit": "Count/s",
            "Statistics": "Value",
            "Namespace": "acs_alb"
          },
          {
            "MetricName": "ListenerHTTPCode500",
            "Periods": "60,300",
            "Description": "The number of HTTP 500 status codes returned per second",
            "Dimensions": "userId,loadBalancerId,listenerProtocol,listenerPort",
            "Labels": "[{\"name\":\"minAlertPeriod\",\"value\":\"60\"},{\"name\":\"alertDefault\",\"value\":\"\"},{\"name\":\"unitFactor\",\"value\":\"1\"},{\"name\":\"alertUnit\",\"value\":\"Count/s\"},{\"name\":\"productCategory\",\"value\":\"alb\"},{\"name\":\"is_alarm\",\"value\":\"true\"},{\"name\":\"metricCategory\",\"value\":\"listener\"}]",
            "Unit": "Count/s",
            "Statistics": "Value",
            "Namespace": "acs_alb"
          },
          {
            "MetricName": "ListenerHTTPCode502",
            "Periods": "60,300",
            "Description": "The number of HTTP 502 status codes returned per second",
            "Dimensions": "userId,loadBalancerId,listenerProtocol,listenerPort",
            "Labels": "[{\"name\":\"minAlertPeriod\",\"value\":\"60\"},{\"name\":\"alertDefault\",\"value\":\"\"},{\"name\":\"unitFactor\",\"value\":\"1\"},{\"name\":\"alertUnit\",\"value\":\"Count/s\"},{\"name\":\"productCategory\",\"value\":\"alb\"},{\"name\":\"is_alarm\",\"value\":\"true\"},{\"name\":\"metricCategory\",\"value\":\"listener\"}]",
            "Unit": "Count/s",
            "Statistics": "Value",
            "Namespace": "acs_alb"
          },
          {
            "MetricName": "ListenerHTTPCode503",
            "Periods": "60,300",
            "Description": "The number of HTTP 503 status codes returned per second",
            "Dimensions": "userId,loadBalancerId,listenerProtocol,listenerPort",
            "Labels": "[{\"name\":\"minAlertPeriod\",\"value\":\"60\"},{\"name\":\"alertDefault\",\"value\":\"\"},{\"name\":\"unitFactor\",\"value\":\"1\"},{\"name\":\"alertUnit\",\"value\":\"Count/s\"},{\"name\":\"productCategory\",\"value\":\"alb\"},{\"name\":\"is_alarm\",\"value\":\"true\"},{\"name\":\"metricCategory\",\"value\":\"listener\"}]",
            "Unit": "Count/s",
            "Statistics": "Value",
            "Namespace": "acs_alb"
          },
          {
            "MetricName": "ListenerHTTPCode504",
            "Periods": "60,300",
            "Description": "The number of HTTP 504 status codes returned per second",
            "Dimensions": "userId,loadBalancerId,listenerProtocol,listenerPort",
            "Labels": "[{\"name\":\"minAlertPeriod\",\"value\":\"60\"},{\"name\":\"alertDefault\",\"value\":\"\"},{\"name\":\"unitFactor\",\"value\":\"1\"},{\"name\":\"alertUnit\",\"value\":\"Count/s\"},{\"name\":\"productCategory\",\"value\":\"alb\"},{\"name\":\"is_alarm\",\"value\":\"true\"},{\"name\":\"metricCategory\",\"value\":\"listener\"}]",
            "Unit": "Count/s",
            "Statistics": "Value",
            "Namespace": "acs_alb"
          },
          {
            "MetricName": "ListenerHTTPCode5XX",
            "Periods": "60,300",
            "Description": "The number of HTTP 5XX status codes returned per second",
            "Dimensions": "userId,loadBalancerId,listenerProtocol,listenerPort",
            "Labels": "[{\"name\":\"minAlertPeriod\",\"value\":\"60\"},{\"name\":\"alertDefault\",\"value\":\"\"},{\"name\":\"unitFactor\",\"value\":\"1\"},{\"name\":\"alertUnit\",\"value\":\"Count/s\"},{\"name\":\"productCategory\",\"value\":\"alb\"},{\"name\":\"is_alarm\",\"value\":\"true\"},{\"name\":\"metricCategory\",\"value\":\"listener\"}]",
            "Unit": "Count/s",
            "Statistics": "Value",
            "Namespace": "acs_alb"
          },
          {
            "MetricName": "ListenerHTTPCodeUpstream2XX",
            "Periods": "60,300",
            "Description": "The number of HTTP 2XX status codes returned from the backend server per second",
            "Dimensions": "userId,loadBalancerId,listenerProtocol,listenerPort",
            "Labels": "[{\"name\":\"minAlertPeriod\",\"value\":\"60\"},{\"name\":\"alertDefault\",\"value\":\"\"},{\"name\":\"unitFactor\",\"value\":\"1\"},{\"name\":\"alertUnit\",\"value\":\"Count/s\"},{\"name\":\"productCategory\",\"value\":\"alb\"},{\"name\":\"is_alarm\",\"value\":\"true\"},{\"name\":\"metricCategory\",\"value\":\"listener\"}]",
            "Unit": "Count/s",
            "Statistics": "Value",
            "Namespace": "acs_alb"
          },
          {
            "MetricName": "ListenerHTTPCodeUpstream3XX",
            "Periods": "60,300",
            "Description": "The number of HTTP 3XX status codes returned from the backend server per second",
            "Dimensions": "userId,loadBalancerId,listenerProtocol,listenerPort",
            "Labels": "[{\"name\":\"minAlertPeriod\",\"value\":\"60\"},{\"name\":\"alertDefault\",\"value\":\"\"},{\"name\":\"unitFactor\",\"value\":\"1\"},{\"name\":\"alertUnit\",\"value\":\"Count/s\"},{\"name\":\"productCategory\",\"value\":\"alb\"},{\"name\":\"is_alarm\",\"value\":\"true\"},{\"name\":\"metricCategory\",\"value\":\"listener\"}]",
            "Unit": "Count/s",
            "Statistics": "Value",
            "Namespace": "acs_alb"
          },
          {
            "MetricName": "ListenerHTTPCodeUpstream4XX",
            "Periods": "60,300",
            "Description": "The number of HTTP 4XX status codes returned from the backend server per second",
            "Dimensions": "userId,loadBalancerId,listenerProtocol,listenerPort",
            "Labels": "[{\"name\":\"minAlertPeriod\",\"value\":\"60\"},{\"name\":\"alertDefault\",\"value\":\"\"},{\"name\":\"unitFactor\",\"value\":\"1\"},{\"name\":\"alertUnit\",\"value\":\"Count/s\"},{\"name\":\"productCategory\",\"value\":\"alb\"},{\"name\":\"is_alarm\",\"value\":\"true\"},{\"name\":\"metricCategory\",\"value\":\"listener\"}]",
            "Unit": "Count/s",
            "Statistics": "Value",
            "Namespace": "acs_alb"
          },
          {
            "MetricName": "ListenerHTTPCodeUpstream5XX",
            "Periods": "60,300",
            "Description": "The number of HTTP 5XX status codes returned from the backend server per second",
            "Dimensions": "userId,loadBalancerId,listenerProtocol,listenerPort",
            "Labels": "[{\"name\":\"minAlertPeriod\",\"value\":\"60\"},{\"name\":\"alertDefault\",\"value\":\"\"},{\"name\":\"unitFactor\",\"value\":\"1\"},{\"name\":\"alertUnit\",\"value\":\"Count/s\"},{\"name\":\"productCategory\",\"value\":\"alb\"},{\"name\":\"is_alarm\",\"value\":\"true\"},{\"name\":\"metricCategory\",\"value\":\"listener\"}]",
            "Unit": "Count/s",
            "Statistics": "Value",
            "Namespace": "acs_alb"
          },
          {
            "MetricName": "ListenerHTTPFixedResponse",
            "Periods": "60,300",
            "Description": "The number of custom responses per second",
            "Dimensions": "userId,loadBalancerId,listenerProtocol,listenerPort",
            "Labels": "[{\"name\":\"minAlertPeriod\",\"value\":\"60\"},{\"name\":\"alertDefault\",\"value\":\"\"},{\"name\":\"unitFactor\",\"value\":\"1\"},{\"name\":\"alertUnit\",\"value\":\"Count/s\"},{\"name\":\"productCategory\",\"value\":\"alb\"},{\"name\":\"is_alarm\",\"value\":\"true\"},{\"name\":\"metricCategory\",\"value\":\"listener\"}]",
            "Unit": "Count/s",
            "Statistics": "Value",
            "Namespace": "acs_alb"
          },
          {
            "MetricName": "ListenerHTTPRedirect",
            "Periods": "60,300",
            "Description": "The number of redirects per second",
            "Dimensions": "userId,loadBalancerId,listenerProtocol,listenerPort",
            "Labels": "[{\"name\":\"minAlertPeriod\",\"value\":\"60\"},{\"name\":\"alertDefault\",\"value\":\"\"},{\"name\":\"unitFactor\",\"value\":\"1\"},{\"name\":\"alertUnit\",\"value\":\"Count/s\"},{\"name\":\"productCategory\",\"value\":\"alb\"},{\"name\":\"is_alarm\",\"value\":\"true\"},{\"name\":\"metricCategory\",\"value\":\"listener\"}]",
            "Unit": "Count/s",
            "Statistics": "Value",
            "Namespace": "acs_alb"
          },
          {
            "MetricName": "ListenerHealthyHostCount",
            "Periods": "60,300",
            "Description": "The number of healthy servers",
            "Dimensions": "userId,loadBalancerId,listenerProtocol,listenerPort",
            "Labels": "[{\"name\":\"minAlertPeriod\",\"value\":\"60\"},{\"name\":\"alertDefault\",\"value\":\"\"},{\"name\":\"unitFactor\",\"value\":\"1\"},{\"name\":\"alertUnit\",\"value\":\"Count\"},{\"name\":\"productCategory\",\"value\":\"alb\"},{\"name\":\"is_alarm\",\"value\":\"true\"},{\"name\":\"metricCategory\",\"value\":\"listener\"}]",
            "Unit": "Count",
            "Statistics": "Value",
            "Namespace": "acs_alb"
          },
          {
            "MetricName": "ListenerInBits",
            "Periods": "60,300",
            "Description": "The number of bits to the ALB instance per second",
            "Dimensions": "userId,loadBalancerId,listenerProtocol,listenerPort",
            "Labels": "[{\"name\":\"minAlertPeriod\",\"value\":\"60\"},{\"name\":\"alertDefault\",\"value\":\"\"},{\"name\":\"unitFactor\",\"value\":\"1\"},{\"name\":\"alertUnit\",\"value\":\"bits/s\"},{\"name\":\"productCategory\",\"value\":\"alb\"},{\"name\":\"is_alarm\",\"value\":\"true\"},{\"name\":\"metricCategory\",\"value\":\"listener\"}]",
            "Unit": "bits/s",
            "Statistics": "Value",
            "Namespace": "acs_alb"
          },
          {
            "MetricName": "ListenerNewConnection",
            "Periods": "60,300",
            "Description": "The number of new connections per second",
            "Dimensions": "userId,loadBalancerId,listenerProtocol,listenerPort",
            "Labels": "[{\"name\":\"minAlertPeriod\",\"value\":\"60\"},{\"name\":\"alertDefault\",\"value\":\"\"},{\"name\":\"unitFactor\",\"value\":\"1\"},{\"name\":\"alertUnit\",\"value\":\"Count/s\"},{\"name\":\"productCategory\",\"value\":\"alb\"},{\"name\":\"is_alarm\",\"value\":\"true\"},{\"name\":\"metricCategory\",\"value\":\"listener\"}]",
            "Unit": "Count/s",
            "Statistics": "Value",
            "Namespace": "acs_alb"
          },
          {
            "MetricName": "ListenerNonStickyRequest",
            "Periods": "60,300",
            "Description": "The number of new requests per second due to sticky session unavailability",
            "Dimensions": "userId,loadBalancerId,listenerProtocol,listenerPort",
            "Labels": "[{\"name\":\"minAlertPeriod\",\"value\":\"60\"},{\"name\":\"alertDefault\",\"value\":\"\"},{\"name\":\"unitFactor\",\"value\":\"1\"},{\"name\":\"alertUnit\",\"value\":\"Count/s\"},{\"name\":\"productCategory\",\"value\":\"alb\"},{\"name\":\"is_alarm\",\"value\":\"true\"},{\"name\":\"metricCategory\",\"value\":\"listener\"}]",
            "Unit": "Count/s",
            "Statistics": "Value",
            "Namespace": "acs_alb"
          },
          {
            "MetricName": "ListenerOutBits",
            "Periods": "60,300",
            "Description": "The number of bits from the ALB instance per second",
            "Dimensions": "userId,loadBalancerId,listenerProtocol,listenerPort",
            "Labels": "[{\"name\":\"minAlertPeriod\",\"value\":\"60\"},{\"name\":\"alertDefault\",\"value\":\"\"},{\"name\":\"unitFactor\",\"value\":\"1\"},{\"name\":\"alertUnit\",\"value\":\"bits/s\"},{\"name\":\"productCategory\",\"value\":\"alb\"},{\"name\":\"is_alarm\",\"value\":\"true\"},{\"name\":\"metricCategory\",\"value\":\"listener\"}]",
            "Unit": "bits/s",
            "Statistics": "Value",
            "Namespace": "acs_alb"
          },
          {
            "MetricName": "ListenerQPS",
            "Periods": "60,300",
            "Description": "The number of requests per second",
            "Dimensions": "userId,loadBalancerId,listenerProtocol,listenerPort",
            "Labels": "[{\"name\":\"minAlertPeriod\",\"value\":\"60\"},{\"name\":\"alertDefault\",\"value\":\"\"},{\"name\":\"unitFactor\",\"value\":\"1\"},{\"name\":\"alertUnit\",\"value\":\"Count/s\"},{\"name\":\"productCategory\",\"value\":\"alb\"},{\"name\":\"is_alarm\",\"value\":\"true\"},{\"name\":\"metricCategory\",\"value\":\"listener\"}]",
            "Unit": "Count/s",
            "Statistics": "Value",
            "Namespace": "acs_alb"
          },
          {
            "MetricName": "ListenerRejectedConnection",
            "Periods": "60,300",
            "Description": "The number of connections dropped per second due to specification limits",
            "Dimensions": "userId,loadBalancerId,listenerProtocol,listenerPort",
            "Labels": "[{\"name\":\"minAlertPeriod\",\"value\":\"60\"},{\"name\":\"alertDefault\",\"value\":\"\"},{\"name\":\"unitFactor\",\"value\":\"1\"},{\"name\":\"alertUnit\",\"value\":\"Count/s\"},{\"name\":\"productCategory\",\"value\":\"alb\"},{\"name\":\"is_alarm\",\"value\":\"true\"},{\"name\":\"metricCategory\",\"value\":\"listener\"}]",
            "Unit": "Count/s",
            "Statistics": "Value",
            "Namespace": "acs_alb"
          },
          {
            "MetricName": "ListenerUnHealthyHostCount",
            "Periods": "60,300",
            "Description": "The number of unhealthy servers",
            "Dimensions": "userId,loadBalancerId,listenerProtocol,listenerPort",
            "Labels": "[{\"name\":\"minAlertPeriod\",\"value\":\"60\"},{\"name\":\"alertDefault\",\"value\":\"\"},{\"name\":\"unitFactor\",\"value\":\"1\"},{\"name\":\"alertUnit\",\"value\":\"Count\"},{\"name\":\"productCategory\",\"value\":\"alb\"},{\"name\":\"is_alarm\",\"value\":\"true\"},{\"name\":\"metricCategory\",\"value\":\"listener\"}]",
            "Unit": "Count",
            "Statistics": "Value",
            "Namespace": "acs_alb"
          },
          {
            "MetricName": "ListenerUpstreamConnectionError",
            "Periods": "60,300",
            "Description": "The number of connection failures per second between the ALB instance and the destination",
            "Dimensions": "userId,loadBalancerId,listenerProtocol,listenerPort",
            "Labels": "[{\"name\":\"minAlertPeriod\",\"value\":\"60\"},{\"name\":\"alertDefault\",\"value\":\"\"},{\"name\":\"unitFactor\",\"value\":\"1\"},{\"name\":\"alertUnit\",\"value\":\"Count/s\"},{\"name\":\"productCategory\",\"value\":\"alb\"},{\"name\":\"is_alarm\",\"value\":\"true\"},{\"name\":\"metricCategory\",\"value\":\"listener\"}]",
            "Unit": "Count/s",
            "Statistics": "Value",
            "Namespace": "acs_alb"
          },
          {
            "MetricName": "ListenerUpstreamResponseTime",
            "Periods": "60,300",
            "Description": "The response time of the backend server",
            "Dimensions": "userId,loadBalancerId,listenerProtocol,listenerPort",
            "Labels": "[{\"name\":\"minAlertPeriod\",\"value\":\"60\"},{\"name\":\"alertDefault\",\"value\":\"\"},{\"name\":\"unitFactor\",\"value\":\"1\"},{\"name\":\"alertUnit\",\"value\":\"milliseconds\"},{\"name\":\"productCategory\",\"value\":\"alb\"},{\"name\":\"is_alarm\",\"value\":\"true\"},{\"name\":\"metricCategory\",\"value\":\"listener\"}]",
            "Unit": "milliseconds",
            "Statistics": "Value",
            "Namespace": "acs_alb"
          },
          {
            "MetricName": "ListenerUpstreamTLSNegotiationError",
            "Periods": "60,300",
            "Description": "The number of TLS connection failures per second between the ALB instance and the destination",
            "Dimensions": "userId,loadBalancerId,listenerProtocol,listenerPort",
            "Labels": "[{\"name\":\"minAlertPeriod\",\"value\":\"60\"},{\"name\":\"alertDefault\",\"value\":\"\"},{\"name\":\"unitFactor\",\"value\":\"1\"},{\"name\":\"alertUnit\",\"value\":\"Count/s\"},{\"name\":\"productCategory\",\"value\":\"alb\"},{\"name\":\"is_alarm\",\"value\":\"true\"},{\"name\":\"metricCategory\",\"value\":\"listener\"}]",
            "Unit": "Count/s",
            "Statistics": "Value",
            "Namespace": "acs_alb"
          },
          {
            "MetricName": "LoadBalancerActiveConnection",
            "Periods": "60,300",
            "Description": "The number of active connections from the client to the ALB instance",
            "Dimensions": "userId,loadBalancerId",
            "Labels": "[{\"name\":\"minAlertPeriod\",\"value\":\"60\"},{\"name\":\"alertDefault\",\"value\":\"\"},{\"name\":\"unitFactor\",\"value\":\"1\"},{\"name\":\"alertUnit\",\"value\":\"Count\"},{\"name\":\"productCategory\",\"value\":\"alb\"},{\"name\":\"is_alarm\",\"value\":\"true\"},{\"name\":\"metricCategory\",\"value\":\"loadBalancer\"}]",
            "Unit": "Count",
            "Statistics": "Value",
            "Namespace": "acs_alb"
          },
          {
            "MetricName": "LoadBalancerClientTLSNegotiationError",
            "Periods": "60,300",
            "Description": "The number of failed connections per second from the client to the ALB instance due to TLS handshake failures",
            "Dimensions": "userId,loadBalancerId",
            "Labels": "[{\"name\":\"minAlertPeriod\",\"value\":\"60\"},{\"name\":\"alertDefault\",\"value\":\"\"},{\"name\":\"unitFactor\",\"value\":\"1\"},{\"name\":\"alertUnit\",\"value\":\"Count/s\"},{\"name\":\"productCategory\",\"value\":\"alb\"},{\"name\":\"is_alarm\",\"value\":\"true\"},{\"name\":\"metricCategory\",\"value\":\"loadBalancer\"}]",
            "Unit": "Count/s",
            "Statistics": "Value",
            "Namespace": "acs_alb"
          },
          {
            "MetricName": "LoadBalancerHTTPCode2XX",
            "Periods": "60,300",
            "Description": "The number of HTTP 2XX status codes returned per second",
            "Dimensions": "userId,loadBalancerId",
            "Labels": "[{\"name\":\"minAlertPeriod\",\"value\":\"60\"},{\"name\":\"alertDefault\",\"value\":\"\"},{\"name\":\"unitFactor\",\"value\":\"1\"},{\"name\":\"alertUnit\",\"value\":\"Count/s\"},{\"name\":\"productCategory\",\"value\":\"alb\"},{\"name\":\"is_alarm\",\"value\":\"true\"},{\"name\":\"metricCategory\",\"value\":\"loadBalancer\"}]",
            "Unit": "Count/s",
            "Statistics": "Value",
            "Namespace": "acs_alb"
          }
        ]
      },
      "Code": 200,
      "Success": true
    }

DescribeMetricLast

Call the DescribeMetricLast operation to query the latest monitoring data of an ALB metric. The following example describes how to query the number of healthy servers associated with a listener based on the ListenerHealthyHostCount metric. For more information, see DescribeMetricLast.

  1. Log on to OpenAPI Explorer.

  2. Set the request parameters for ListenerHealthyHostCount and click Initiate Call.

    Configure the following parameters and use the default values for the other parameters.

    • MetricName: the metric name. In this example, ListenerHealthyHostCount is used.

    • Dimensions: the resource whose monitoring information you want to query. In this example, [{"loadBalancerId":"alb-t93aj3yndojot5****"}] is used.

    • Namespace: the namespace of the service. In this example, acs_alb is used.

    View the sample request

    http(s)://[Endpoint]/?Action=DescribeMetricLast
    &MetricName=ListenerHealthyHostCount
    &Namespace=acs_alb
    &Dimensions=[{"loadBalancerId":"alb-t93aj3yndojot5****"}]
    &<Common request parameters>
  3. View the latest monitoring information about ListenerHealthyHostCount based on the response parameters.

    View the example response

    {
      "RequestId": "5CC32511-24DD-58B3-A1D3-D9715DC41F9D",
      "Period": "60",
      "Datapoints": "[{\"timestamp\":1663221840000,\"loadBalancerId\":\"alb-t93aj3yndojot5****\",\"listenerProtocol\":\"https\",\"listenerPort\":\"443\",\"userId\":\"1461700914926653\",\"Value\":1.0}]",
      "Code": "200",
      "Success": true
    }

DescribeMetricList

Call the DescribeMetricList operation to query the monitoring data of an ALB metric within a time period. The following example describes how to query the monitoring data of RuleHealthyHostCount within a time period. For more information, see DescribeMetricList.

  1. Log on to OpenAPI Explorer.

  2. Set the request parameters for RuleHealthyHostCount and click Initiate Call.

    Configure the following parameters and use the default values for the other parameters:

    • MetricName: the metric name. In this example, RuleHealthyHostCount is used.

    • Namespace: the namespace of the service. In this example, acs_alb is used.

    • Dimensions: the resource whose monitoring information you want to query. In this example, [{"loadBalancerId":"alb-2c9oquqqdcgbf8****"}] is used.

    • StartTime the start time. This value must not be greater than or equal to the value of EndTime. In this example, 2022-09-14 14:10:00 is used.

      Supported formats:

      • UNIX timestamp: the number of milliseconds that have elapsed since January 1, 1970, 00:00:00 UTC

      • UTC time: the UTC time that follows the YYYY-MM-DDThh:mm:ssZ format

    • EndTime: the end time. The supported formats are the same as those supported by the start time. In this example, 2022-09-14 14:11:00 is used.

    View the sample request

    http(s)://[Endpoint]/?Action=DescribeMetricList
    &MetricName=RuleHealthyHostCount
    &Namespace=acs_alb
    &Dimensions=[{"loadBalancerId":"alb-2c9oquqqdcgbf8****"}]
    &StartTime=2022-09-14 14:10:00
    &EndTime=2022-09-14 14:11:00
    &<Common request parameters>
  3. View the monitoring of RuleHealthyHostCount within the specific time period based on the response parameters.

    View the sample response

    {
      "RequestId": "FECF5168-616A-584A-B149-A622348A01C3",
      "Period": "60",
      "Datapoints": "[{\"timestamp\":1663135860000,\"loadBalancerId\":\"alb-2c9oquqqdcgbf8****\",\"listenerProtocol\":\"https\",\"listenerPort\":\"443\",\"ruleId\":\"rule-default-lsn-icqehvs7afp600qcj8\",\"userId\":\"1461700914926653\",\"Value\":1.0}]",
      "Code": "200",
      "Success": true
    }

Query monitoring information by using the SDK

This section describes how to query the metrics and detailed monitoring data of ALB by using the SDK. The following example describes how to query the number of active connections to an ALB instance by using the SDK to call the DescribeMetricList operation.

You can also download the SDK to query the monitoring information. For more information, see SDK references.

  1. Log on to OpenAPI Explorer.

  2. Configure the following parameters and use the default values for the other parameters.

    • MetricName: the metric name. In this example, LoadBalancerActiveConnection is used.

    • Namespace: the namespace of the service. In this example, acs_alb is used.

    • Dimensions: the resource whose monitoring information you want to query. In this example, [{"loadBalancerId":"alb-2c9oquqqdcgbf8****"}] is used.

    • StartTime: the start time. This value must not be greater than or equal to the value of EndTime. In this example, 2022-09-14 14:10:00 is used.

      Supported formats:

      • UNIX timestamp: the number of milliseconds that have elapsed since January 1, 1970, 00:00:00 UTC

      • UTC time: the UTC time that follows the YYYY-MM-DDThh:mm:ssZ format

    • EndTime: the end time. The supported formats are the same as those supported by the start time. In this example, 2022-09-14 14:11:00 is used.

  3. Choose SDK Sample > Python and click Example.

  4. In the panel below, view the results.

References