atop lets you instantly view the system status through an interactive interface. It can also run as a background service to record snapshots of system and process activity at a specified frequency. These snapshots are saved as binary logs, which help you trace and diagnose system issues.
Install atop
Install atop.
Alibaba Cloud Linux 2/3, CentOS 7/8, or Fedora
# Update packages.
sudo yum update -y

# Install atop.
sudo yum install atop -y
Ubuntu or Debian
# Update packages.
sudo apt update -y

# Install atop.
sudo apt install atop -y
CentOS Stream 9 or Rocky Linux 9
# Update packages.
sudo dnf update -y

# Install the EPEL repository.
sudo dnf install epel-release -y

# Install atop.
sudo dnf install atop -y
openSUSE
# Update packages.
sudo zypper update -y

# Install atop.
sudo zypper install atop atop-daemon -y
Start the atop service.
sudo systemctl start atopVerify that the atop service started successfully.
Run
sudo systemctl status atopto check the service status. Theactive (running)status indicates success.
View real-time metrics with atop
Run the
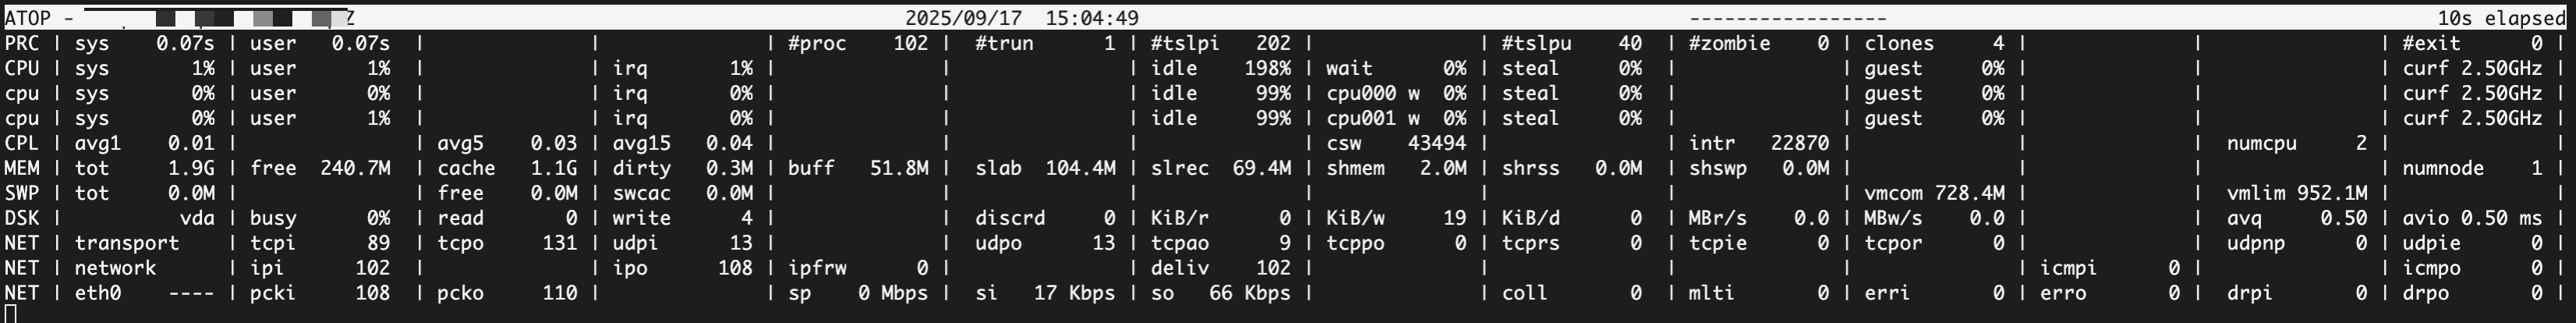
atop [sampling_interval_in_seconds] [number_of_samples]command to enter interactive mode. The command output contains two sections: the section of system resource overview and the section of process details.# View with default settings (refreshes every 10 seconds). atop # View system metrics every 5 seconds. atop 5 # Collect system metrics 30 times at 10-second intervals. atop 10 30 # Collect metrics 10 times at 30-second intervals and write the results to a file. atop 30 10 > /tmp/atop.memSystem resource overview: This section summarizes CPU, memory, swap space, disk I/O, and network resource usage.
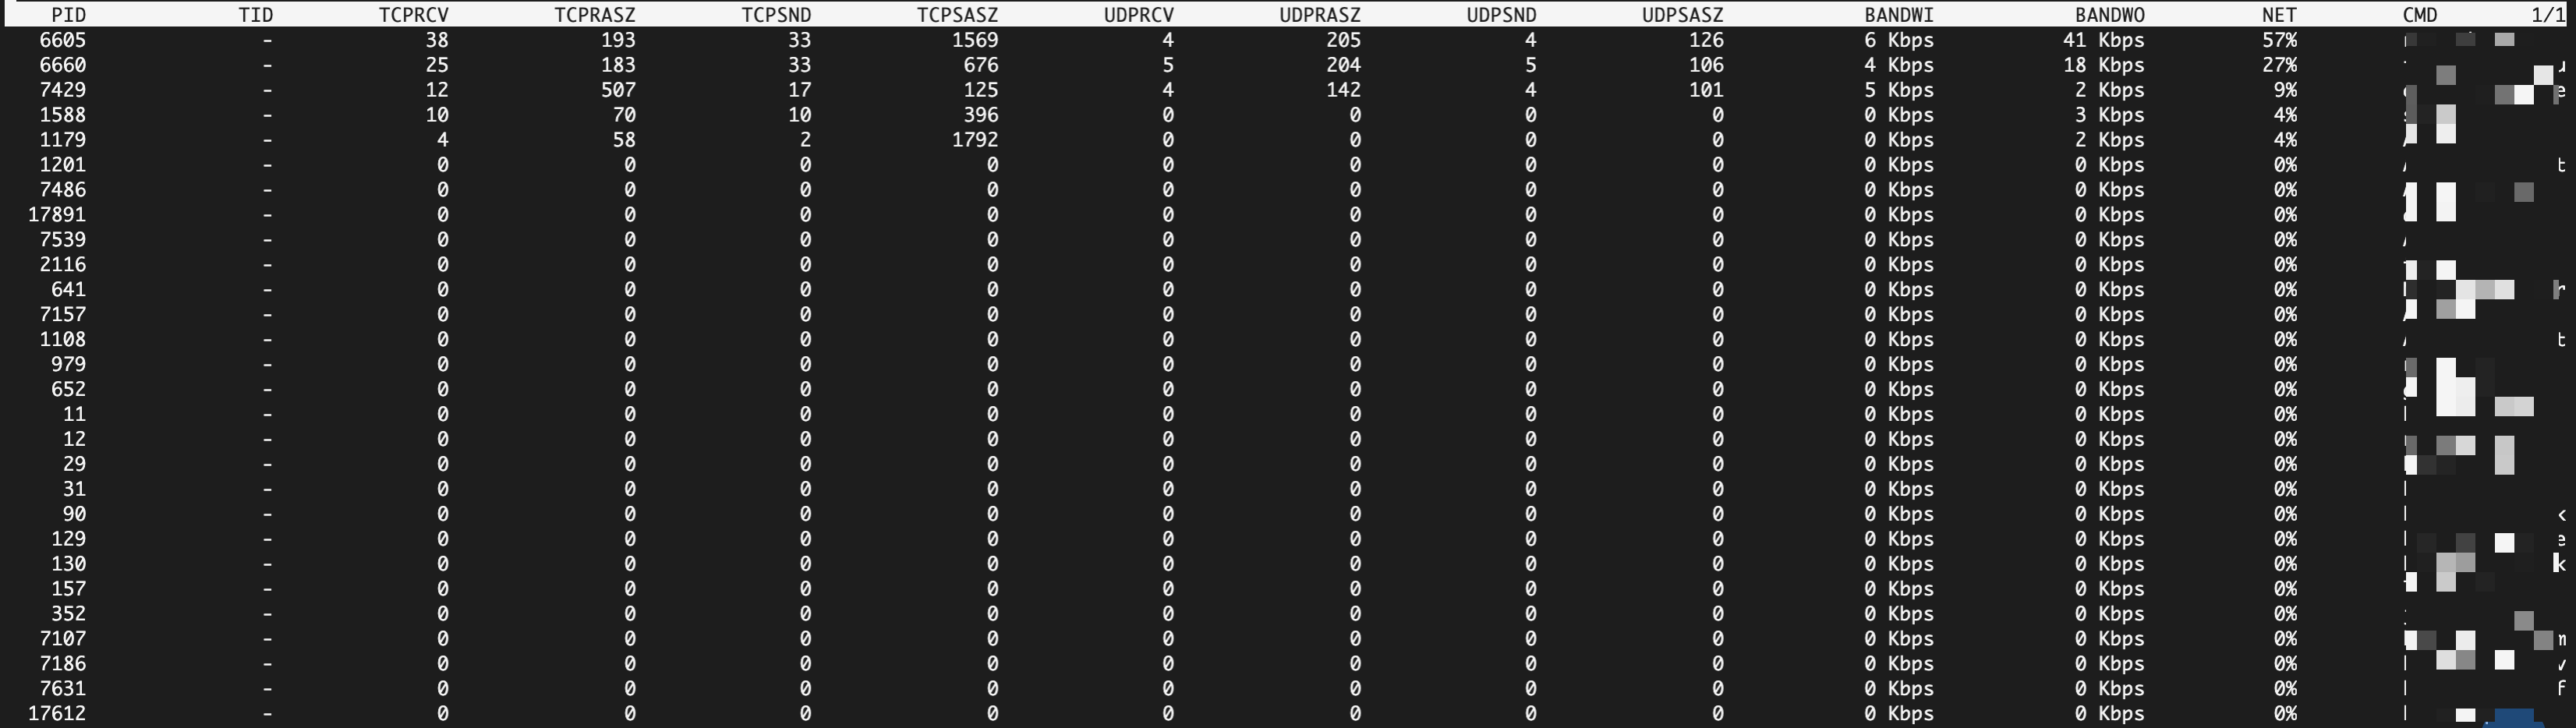
Process-level details: This section shows resource consumption for each process.
In interactive mode, use single-letter keys to switch views or sort processes.
Key
Function
Purpose
c
Display the full command line
View the specific parameters used to start a process.
g
Generic view (default)
View a summary of CPU, memory growth, and disk I/O.
m/M
Memory view/Sort by memory
Analyze memory usage and page faults. Troubleshoot memory leaks.
d/D
Disk view/Sort by disk
Analyze disk I/O. Identify processes with high disk read/write activity.
n/N
Network view/Sort by network (requires you to install and load the netatop kernel module)
Analyze network traffic. Identify processes with high network traffic.
a
Aggregation view
Aggregate the resource consumption of all threads or processes of a program.
C
Sort by CPU
Quickly identify the processes that consume the most CPU.
h
Show help
View more keyboard shortcuts.
q
Quit
Exit interactive mode.
View historical metrics with atop
After the atop service starts, it periodically generates binary log files in the /var/log/atop/ directory. The files are named in the atop_YYYYMMDD format.
atoplogs are binary files. Opening them with a text editor likecat,less, orvimdisplays unreadable characters.
Read historical logs
Read a historical log file.
Use the
atop -r <log_file>command to load a specific log file.# View today's log. atop automatically finds the log file for the current day. atop -r # View the log for a specific date. atop -r /var/log/atop/atop_YYYYMMDDNavigate to a specific point in time within the log.
When you load a log file, the interface shows the first snapshot from that file.
Press
tto jump forward to the next snapshot.Press
T(uppercase) to jump backward to the previous snapshot.Press
band enter a time inHH:MMformat to jump directly to that time.
Optimize atop logging behavior
When analyzing historical logs, you may find that the default logging frequency (once every 10 minutes) is too broad for certain issues, or the default 28-day retention period does not meet your needs. You can adjust atop's background logging frequency, retention period, and storage path by modifying its configuration file.
Open the configuration file using
vimor another text editor.For RHEL and its derivatives (Alibaba Cloud Linux, CentOS, Fedora, and Rocky Linux):
sudo vim /etc/sysconfig/atopFor Debian and its derivatives (Ubuntu and Debian) and openSUSE:
sudo vim /etc/default/atop
The default configuration file contains the following content:
LOGOPTS="" LOGINTERVAL=600 LOGGENERATIONS=28 LOGPATH=/var/log/atopLOGOPTS: Additional logging options. For example, setting-Lcreates a symbolic link at/var/log/atop/atop_currentthat points to the latest log file for quick access during log rotation.LOGINTERVAL: The sampling interval for logging, in seconds. The default is600(10 minutes), meaningatoprecords a system snapshot every 10 minutes.LOGGENERATIONS:The lifecycle of log files, in days. The default is28, meaningatopdeletes log files older than 28 days.LOGPATH: The storage path for log files. The default is/var/log/atop.To change this path, ensure the new directory exists and the atop process has write permissions to it.
Restart the
atopservice to apply your changes.sudo systemctl restart atop
Generate metric reports
atopsar is a non-interactive command-line tool included in the atop package. It extracts data from atop's binary log files to generate system performance reports.
Examples
Generate a report on CPU utilization metrics for the current system over a 1-minute period (12 samples at 5-second intervals).
atopsar -c 5 12Generate a report on memory metrics for a specific time range on the current day.
# View the memory metric report for today from 18:00 to 18:01.
atopsar -m -b 18:00 -e 18:01
Generate a report on memory metrics for a specific time range on a specific date.
# View the memory metric report for August 15, 2025, from 18:00 to 18:01.
atopsar -m -r /var/log/atop/atop_20250815 -b 18:00 -e 18:01
atopsar command syntax
atopsar [options] [interval] [count][options]: Flags to specify the report type, such as
-c(CPU),-m(memory), and-d(disk).[interval]: The time interval for the report output, in seconds.
[count]: The number of times the report is generated.
Understand the metrics
System resource overview
Metric Category | Metric | Description | Unit |
ATOP | Hostname, Date | Shows the current hostname, sampling date, and time. | - |
Sampling interval | Shows the time interval between two samples. | Seconds | |
PRC (Process totals) |
| The total CPU time consumed by all processes in kernel mode during the sampling interval. | Seconds |
| The total CPU time consumed by all processes in user mode during the sampling interval. | Seconds | |
| The total number of processes in the system. | Unit | |
| The average number of threads in the running state. | Unit | |
| The number of threads in an interruptible sleep state. | Item | |
| The number of threads in an uninterruptible sleep state. | Unit | |
| The number of zombie processes. | Unit | |
| The number of new processes or threads created by the clone system call during the sampling interval. | Count/second | |
| The number of processes that exited during the sampling interval. | Count/second | |
CPU/cpu (Total/Per core) |
| The percentage of time the CPU spent in kernel mode. | % |
| The percentage of time the CPU spent in user mode. | % | |
| The percentage of time the CPU spent handling hardware interrupts (irq) and software interrupts (softirq). | % | |
| The percentage of time the CPU was completely idle. | % | |
| The percentage of time the CPU was idle while waiting for disk I/O to complete. | % | |
| The percentage of time a virtual CPU waited for a physical CPU (time stolen by the host or other VMs). | % | |
| The percentage of CPU time spent running a virtual machine. | % | |
| The average running frequency of the CPU as a percentage of its maximum frequency. | % | |
CPL (CPU load) |
| The system average load over the last 1 minute, 5 minutes, and 15 minutes. | - |
| The number of context switches during the sampling interval. | Count/second | |
| The total number of interrupts that occurred during the sampling interval. | Count/second | |
MEM (Physical memory) |
| The total amount of physical memory in the system. | GiB/MiB |
| The amount of completely unused free memory. | GiB/MiB | |
| The amount of memory used as page cache for caching file data. | GiB/MiB | |
| The amount of dirty pages in the page cache that have been modified but not yet written to disk. | MiB | |
| The amount of memory used as buffer cache for caching block device metadata. | MiB | |
| The amount of memory used by the kernel for its own data structures (slab allocator). | MiB | |
| The size of shared memory, including tmpfs. | MiB | |
| (32-bit systems only) The amount of balanced memory for virtual memory areas. | MiB | |
SWP (Swap partition) |
| The total size of the swap partition. | GiB/MiB |
| The size of the free swap partition. | GiB/MiB | |
| The amount of memory that has been swapped out but is also cached. | MiB | |
| The total amount of virtual memory committed by applications. | GiB/MiB | |
| The limit on the amount of virtual memory that can be committed. | GiB/MiB | |
PAG (Paging activity) |
| The number of pages scanned by the kernel to reclaim memory during the sampling interval. | Pages/second |
| The number of pages successfully reclaimed by the kernel after scanning. | Pages/second | |
| The number of times the kernel stalled to wait for page reclamation because of insufficient memory. | Count/second | |
| The number of pages swapped in from the swap partition to physical memory. | Pages/second | |
| The number of pages swapped out from physical memory to the swap partition. | Pages/second | |
DSK (Disk) LVM (Logical Volume) |
| The percentage of time the disk was busy. A value of 100% indicates that the disk is saturated. | % |
| The number of read/write requests completed during the sampling interval. | Count/second | |
| The average data size per read/write request. | KB | |
| The average time per read/write request, including queuing and service time. | Milliseconds | |
| The average service time for an I/O request, excluding queuing time. | Milliseconds | |
NET (Network) |
| Packet statistics for the TCP and UDP layers. | Packets/second |
| Packet statistics for the IP layer, including received, sent, and forwarded packets. | Packets/second | |
| Shows the activity for each network interface. | - | |
| The number of data packets received/sent by the interface. | Packets/second | |
| The speed at which the interface receives/sends data. | Mbps | |
| The number of errors that occurred during receiving/sending on the interface. | Count/second | |
| The number of data packets dropped during receiving/sending on the interface. | Count/second |
Process-level details
View | Metric | Description | Unit |
Generic view (default) |
| Process ID. A unique process identifier in the system. | - |
| Process status. R-running, S-interruptible sleep, D-uninterruptible sleep, Z-zombie, E-exited. | - | |
| CPU utilization. | % | |
| Memory usage. | % | |
| Number of threads. | Unit | |
| Major page faults. The number of times the process needed to read data from disk into memory. This is a measure of disk I/O pressure. | Count/second | |
| Command name. The executable file name of the process. Press the c key to show the full command line. | - | |
Memory view |
| Virtual memory size. The total size of the virtual address space requested by the process. | KiB/MiB/GiB |
| Resident set size. The actual amount of physical memory currently occupied by the process. | KiB/MiB/GiB | |
| Shared memory size. | KiB/MiB/GiB | |
| Resident memory growth. A positive number indicates that memory consumption is increasing. A negative number indicates that it is decreasing. | KiB | |
| Virtual memory growth. | KiB | |
Disk view |
| Disk activity percentage. The percentage of total disk busy time that is caused by the process's disk I/O. | % |
| Disk data read/written. | KiB/MB | |
| Canceled write amount. The amount of data that a process wrote to the page cache but was deleted before being synced to the disk. | KiB/MB | |
Network view |
| Network activity percentage. The percentage of total network traffic from all processes that is generated by this process. | % |
| TCP data sent/received. | KiB/MB | |
| UDP data sent/received. | KiB/MB |
Apply in production
Disk space planning: The size of
atoplogs depends on the collection frequency, the number of system processes, and the retention period. To estimate the required space, check the size of a single log file with thels -lh /var/log/atop/command and then multiply that size by the value ofLOGGENERATIONS.Monitoring interval: For scenarios that require more granular analysis, you can change the
LOGINTERVALin the default configuration to 30 seconds. However, be aware that shortening the interval increases disk I/O and the CPU overhead of theatopprocess. Adjust this value based on your instance's workload.
FAQ
Why do I get the error
stat raw file: No such file or directorywhen runningatop -r?This error means
atopcannot find the log file for the specified date. Possible reasons include:The
atopservice was not running on the specified date.The log file was deleted due to the log rotation policy (the retention period set by
LOGGENERATIONSwas exceeded).You are querying a future date.
Check the
/var/log/atopdirectory for a list of available log files.
How can I reduce
atop's disk space usage?You can reduce disk space usage by modifying the configuration file. Remember to restart the
atopservice after making changes.Reduce the log retention period: Lower the value of
LOGGENERATIONSin the configuration file, for example, from28to14.Decrease the collection frequency: Increase the value of
LOGINTERVALin the configuration file, for example, from600to1200.
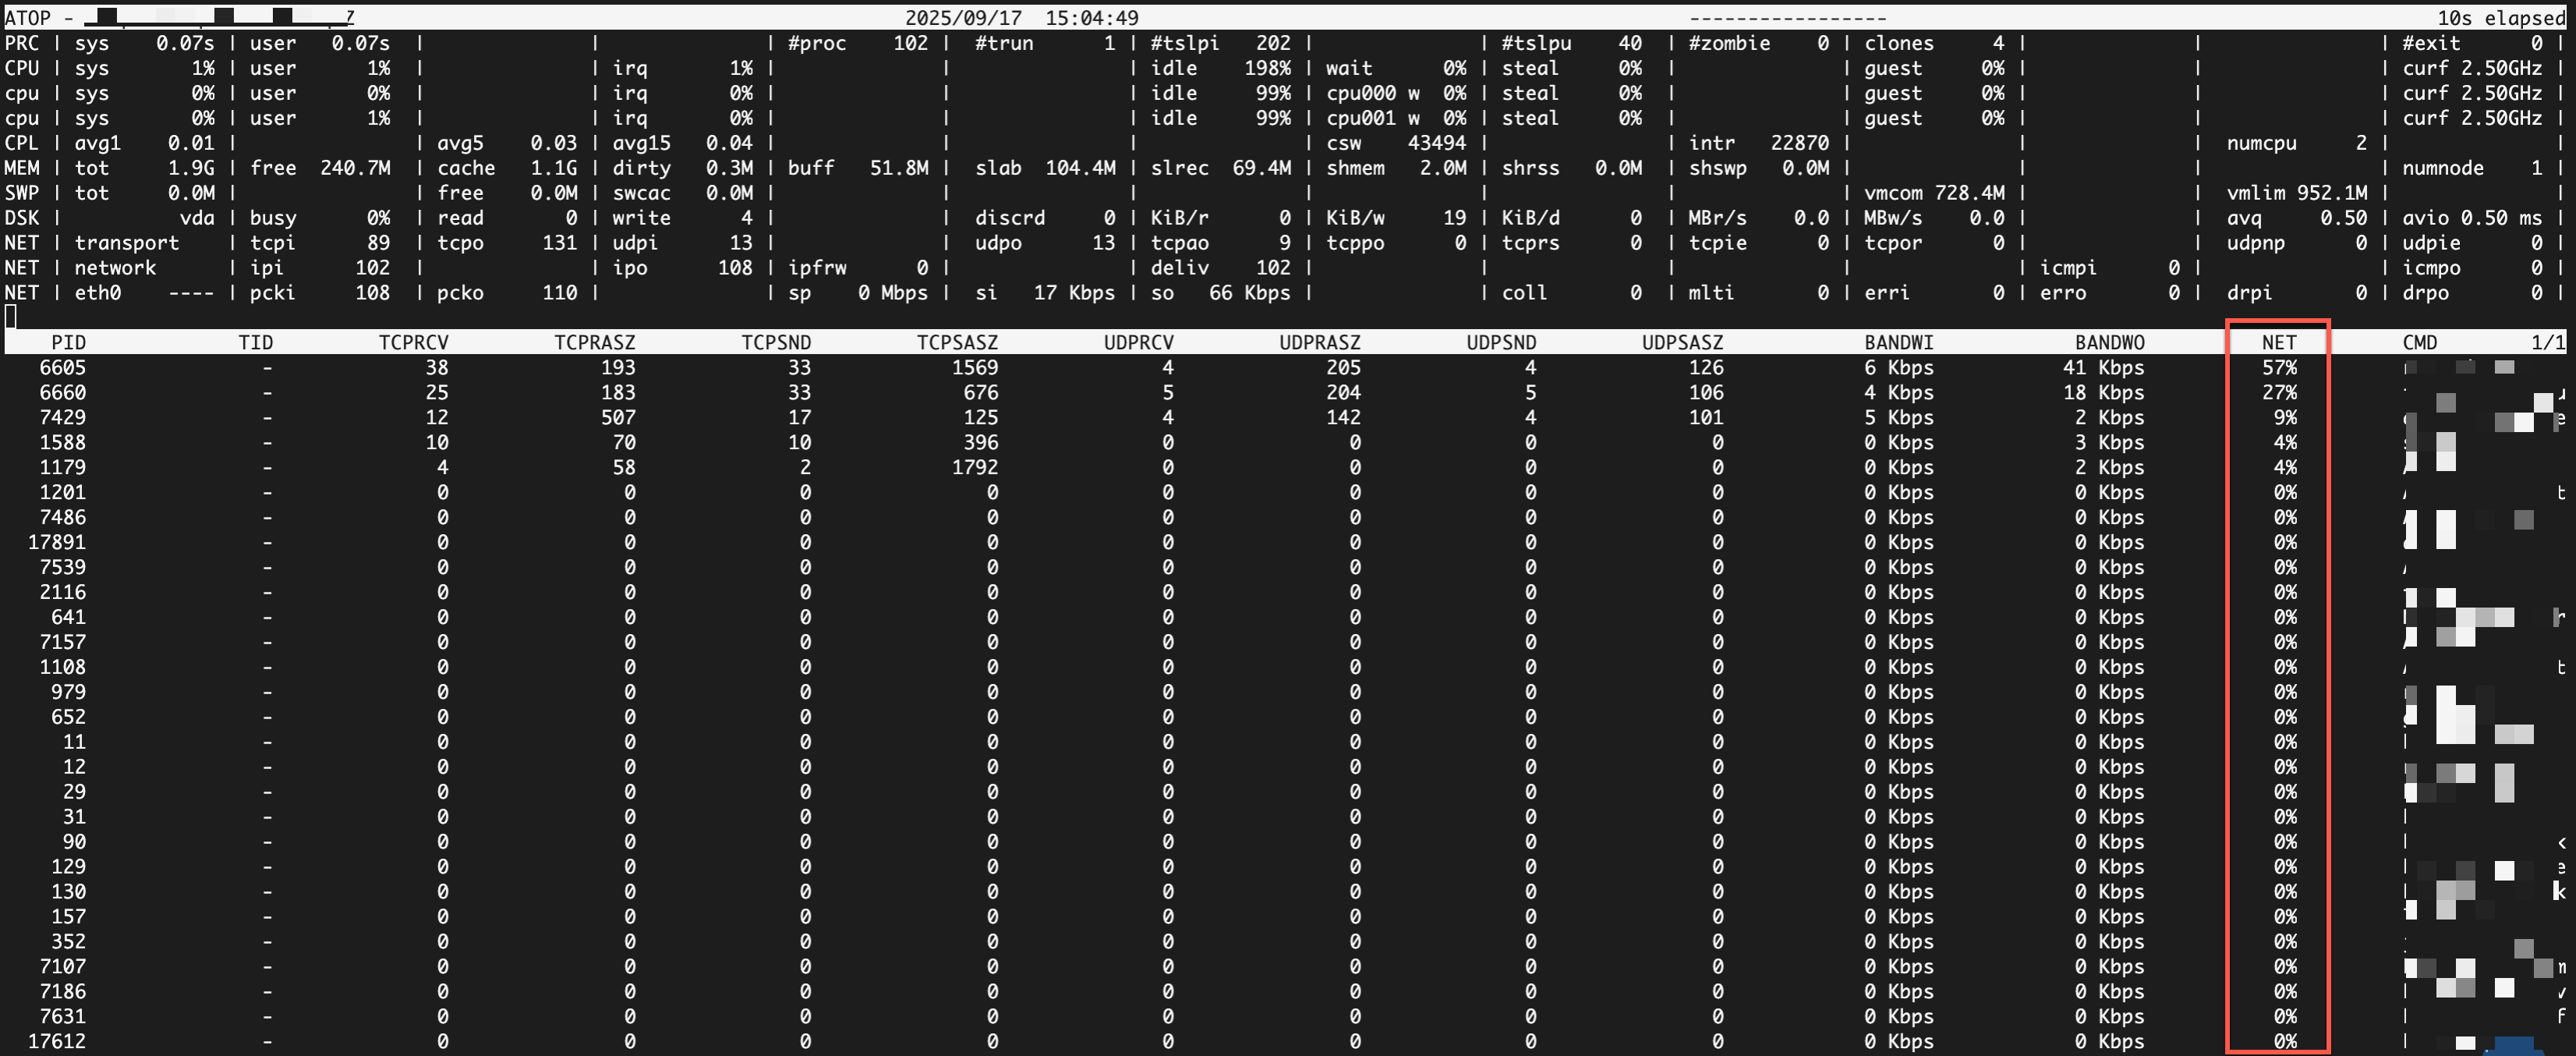
Why can't I see per-process network traffic when I press the
nkey in atop's interactive mode?By default,
atopdoes not track per-process network traffic. To enable this, you must install and load thenetatopkernel module.Install the kernel development package and required compilation tools.
sudo yum install -y kernel-devel dkms elfutils-libelf-develDownload the netatop source code to the specified directory.
cd /usr/src/ && sudo wget https://www.atoptool.nl/download/netatop-3.2.2.tar.gzDecompress the source code and navigate into the source directory.
sudo tar -zxvf netatop-3.2.2.tar.gz && cd netatop-3.2.2Build and install the module and daemon from the source code.
sudo make && sudo make installStart the
netatopservice.sudo systemctl start netatopVerify that
netatopwas installed successfully.Run
atopand pressn. If the process details list includes aNETcolumn, the installation was successful.