To efficiently analyze metrics, logs, and traces from your ApsaraDB for SelectDB instance without managing server configurations or software updates, use Managed Service for Grafana to monitor your SelectDB instance. This topic describes how to add an ApsaraDB for SelectDB data source to Managed Service for Grafana and use it to build visualizations.
Prerequisites
Currently, SelectDB only supports connections from Managed Service for Grafana over a public network. You must Apply for Public Endpoint for your SelectDB instance. For more information, see Apply for or release a public endpoint.
You have the username and password for your SelectDB instance.
NoteFor enhanced security, we recommend using a read-only account to configure the data source.
You have a target workspace for Managed Service for Grafana. For more information about how to create one, see Create a Grafana workspace.
You have added the public IP address of your Managed Service for Grafana workspace to the SelectDB of your SelectDB instance.
To obtain the public IP address of your Managed Service for Grafana workspace:
-
Log on to the ARMS console. In the left-side navigation pane, choose .
Click the target OfficeSiteId/OfficeSiteName to open the Workspace Information page and get the Public IP.
-
Add the Public IP of the target workspace to the IP address whitelist of your SelectDB instance. For more information, see Set an IP address whitelist.
Billing
The Shared Edition of Managed Service for Grafana is free, while the Pro Edition is a paid service. For more information, see billing rules for Grafana.
Procedure
Step 1: Add a data source
-
Log on to the ARMS console. In the left-side navigation pane, choose .
-
On the Workspace Management page, find the workspace that you want to manage and click the URL in the URL column to go to Grafana.
NoteYou can log on to Grafana with the administrator account of Grafana and the password that you configured when you created the workspace. You can also click Sign in with Alibaba Cloud to log on to Grafana with the current Alibaba Cloud account.
Grafana 9.x
In the navigation pane on the left, click the
 icon, click Add data source, and then click MySQL.Note
Grafana does not have a dedicated data source for SelectDB. Select the MySQL data source instead, as SelectDB is compatible with the
MySQL 5.7connection protocol and syntax.Grafana 10.x
On the Grafana homepage, click the
 icon in the upper-left corner.
In the navigation pane on the left, choose .
On the Data Source tab, click + Add data source. Then, click MySQL.
NoteGrafana does not have a dedicated data source for SelectDB. Select the MySQL data source instead, as SelectDB is compatible with the
MySQL 5.7connection protocol and syntax.
On the Settings page, configure the following parameters.
The following table describes the common parameters. For more information, see the official Grafana documentation.
Parameter
Description
Name
A custom name for the data source.
Host
The public endpoint of your SelectDB instance. You can obtain it from the details page of your SelectDB instance.
Format:
<public_endpoint>:<MySQL_protocol_port>Example: selectdb-cn-bcd****-public.selectdbfe.rds.aliyuncs.com:9030
Database
The name of the database in your SelectDB instance.
User
The account for your SelectDB instance.
ImportantFor enhanced security, we recommend using a read-only account to configure the data source.
Password
The password for your SelectDB instance account.
Click Save & Test to add the data source.
Success: A
Database Connection OKmessage confirms that the data source was added successfully.Failure: If an error occurs after you click Save & Test, troubleshoot the issue as follows:
Verify that the endpoint, database name, username, and password are correct.
If the information is correct, confirm that the public IP address of Managed Service for Grafana is added to the SelectDB of your SelectDB instance. For more information, see Add the Grafana public IP address to the SelectDB IP address whitelist.
Step 2: Create a dashboard
This section shows how to create a table panel and a time series chart by using the following sample data.
SELECT * FROM `test_table` where operate_time<'2022-07-20 03:00:00';ID | City (place) | User (user) | Action (operate) | Time (operate_time) | Count |
1 | China (Hangzhou) | User A | Browse | 2022/7/20 0:00 | 3 |
2 | China (Hangzhou) | User A | Browse | 2022/7/20 1:00 | 8 |
3 | China (Hangzhou) | User A | Browse | 2022/7/20 2:00 | 13 |
11 | China (Beijing) | User A | Browse | 2022/7/20 0:00 | 23 |
12 | China (Beijing) | User B | Browse | 2022/7/20 1:00 | 18 |
13 | China (Beijing) | User B | Browse | 2022/7/20 2:00 | 3 |
21 | China (Beijing) | User C | Browse | 2022/7/20 0:00 | 13 |
22 | China (Beijing) | User C | Browse | 2022/7/20 1:00 | 22 |
23 | China (Beijing) | User C | Browse | 2022/7/20 2:00 | 23 |
Create a table panel
In the navigation pane on the left of Grafana, click the
 icon, and then click + New dashboard.
On the New dashboard page, click Add a new panel.
In the Edit Panel view, go to the Visualization panel on the right and select Table.
In the Query section, select the data source that you added in Step 1.
Under query A, enter the SQL query and set Format as to Table.
SELECT
  id AS "ID",
  place AS "City",
  user AS "User",
  operate AS "Action",
  count AS "Count",
  operate_time AS "Time"
FROM test_table
In the upper-right corner, click Apply.
Create a time series chart
On your dashboard, click the
 icon in the upper-right corner, and then click Add a new panel.
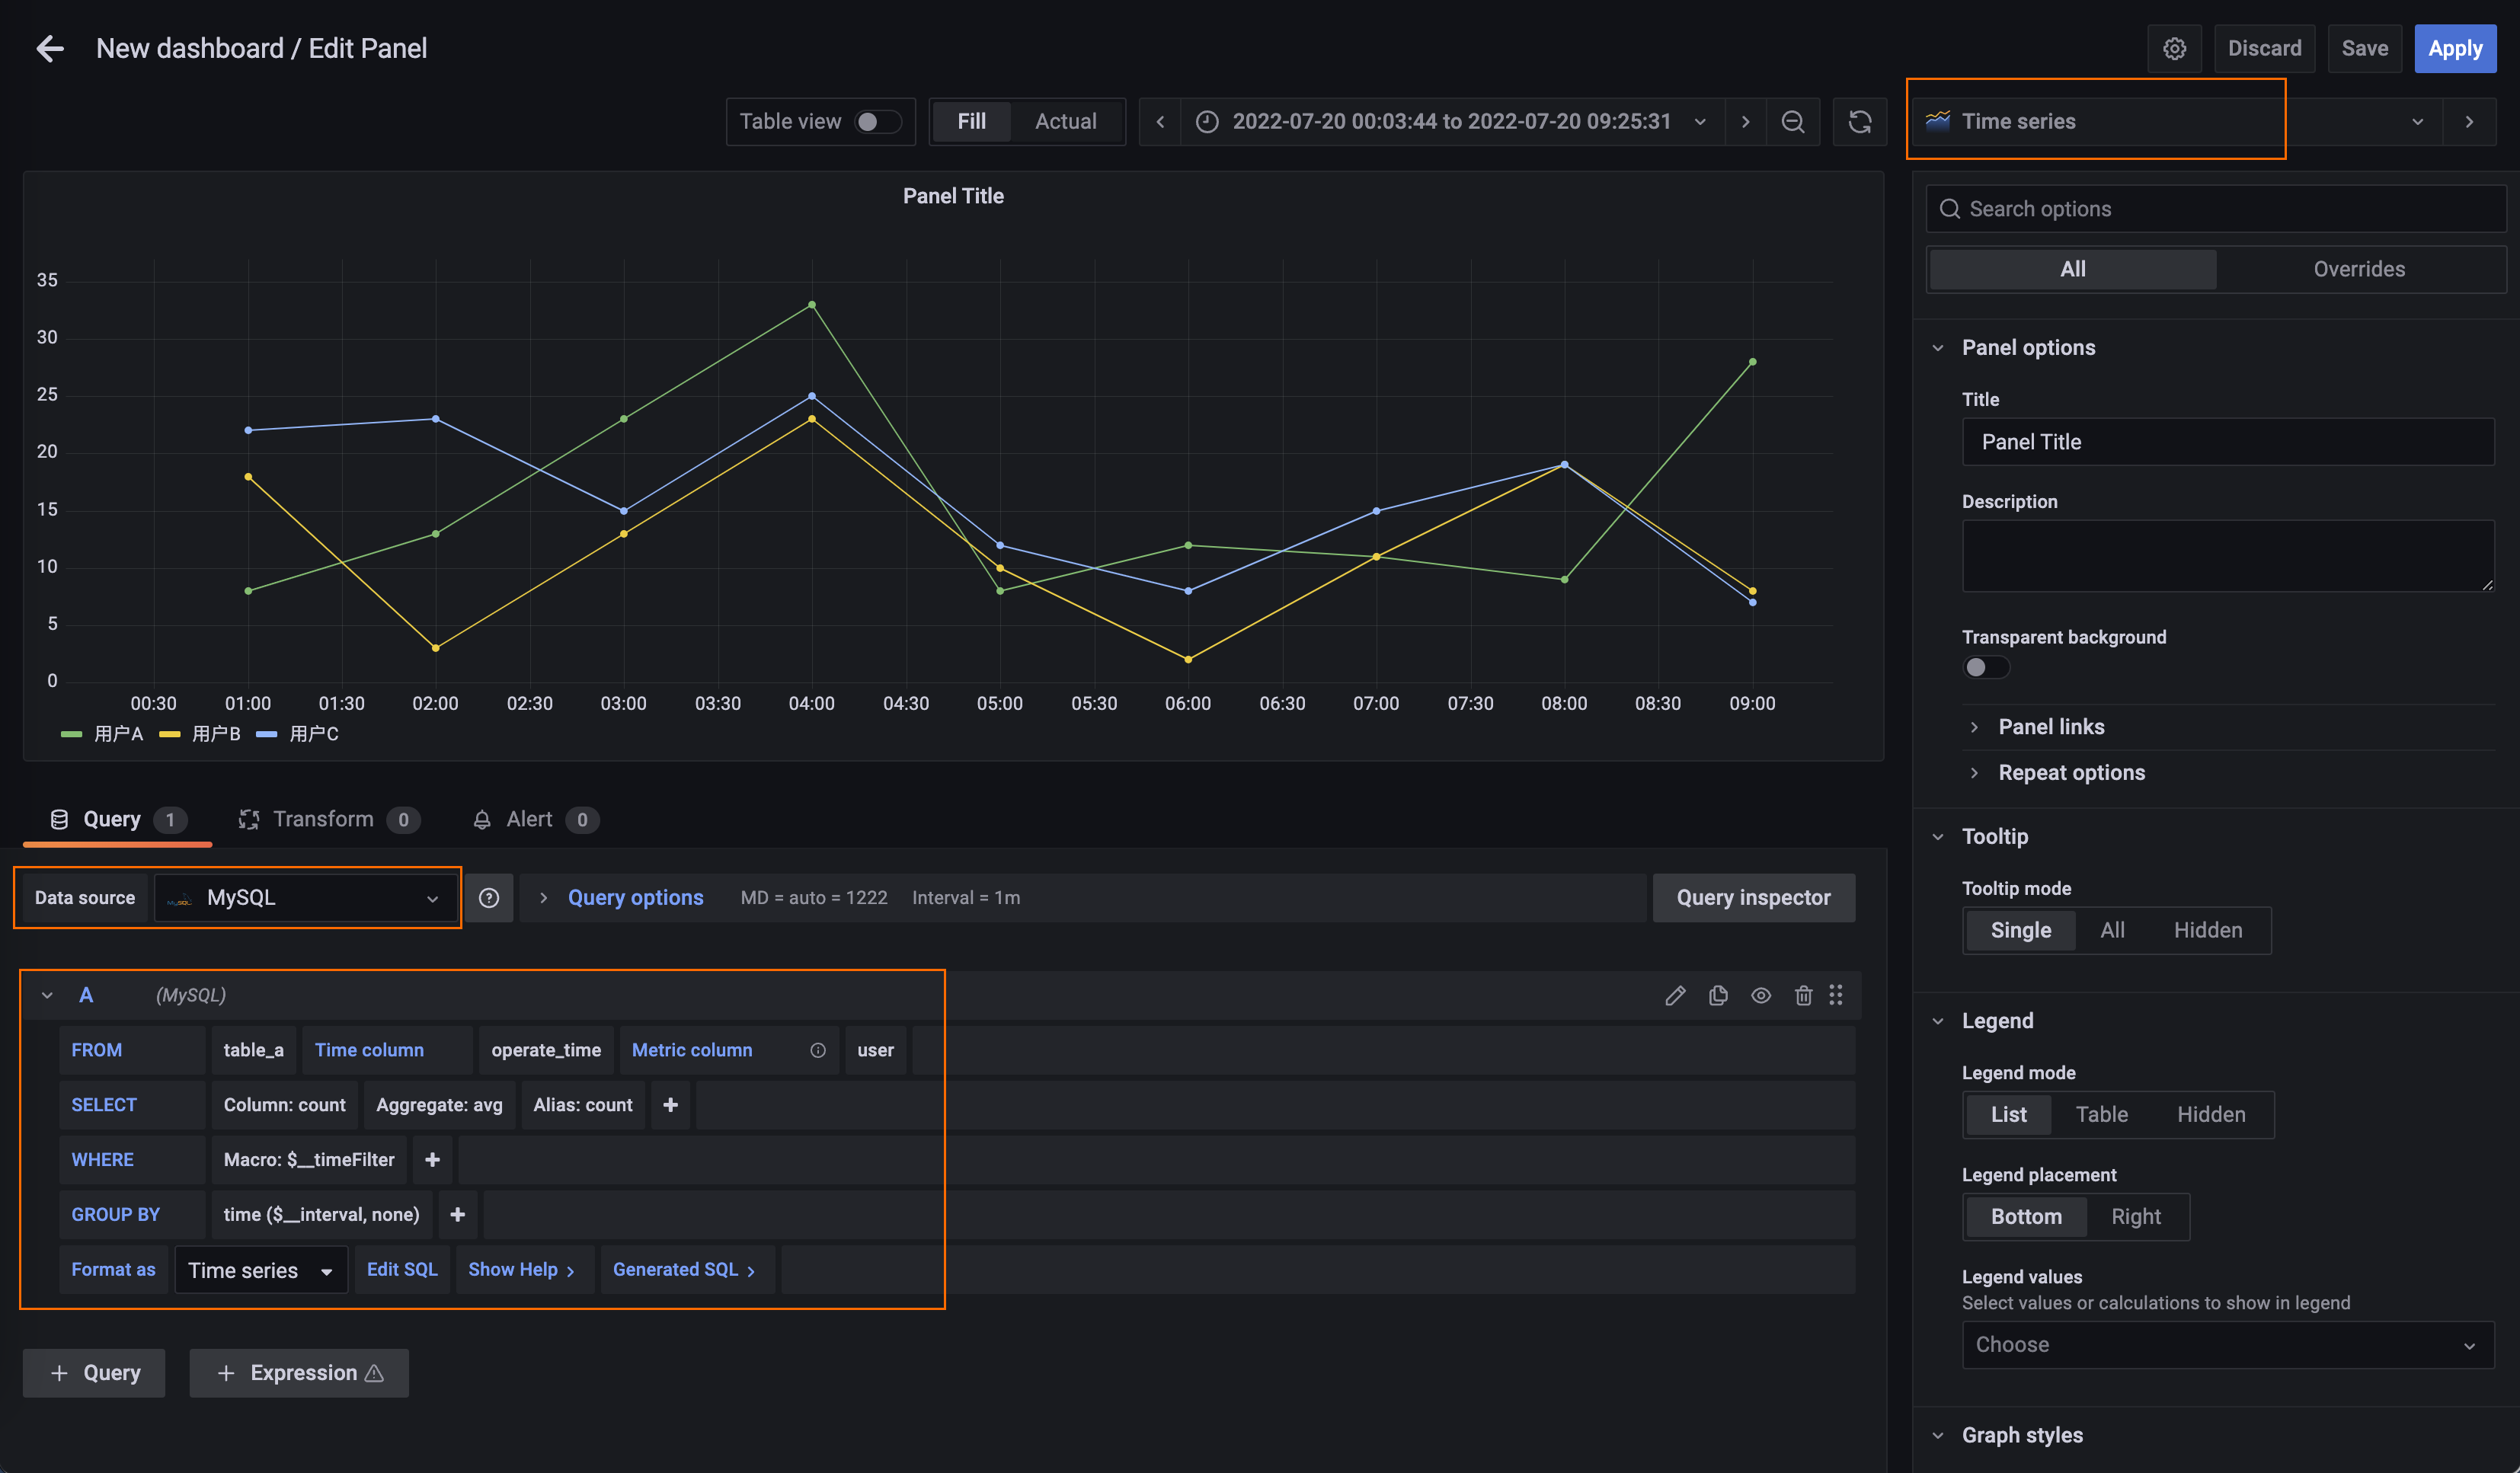
In the Edit Panel view, go to the Visualization panel on the right and select Time series.
In the Query section, select the data source that you added in Step 1.
Under query A, configure the following parameters:
Time column: Select the time column from your table. For this example, select operate_time.
Metric column: Select the column to use as the metric name. For this example, select user.
SELECT: Select the numeric value column. For this example, select count.
Format as: Set the format to Time Series.
(Optional) To display the data as bars, set Style to Bars in the Graph style panel on the right.
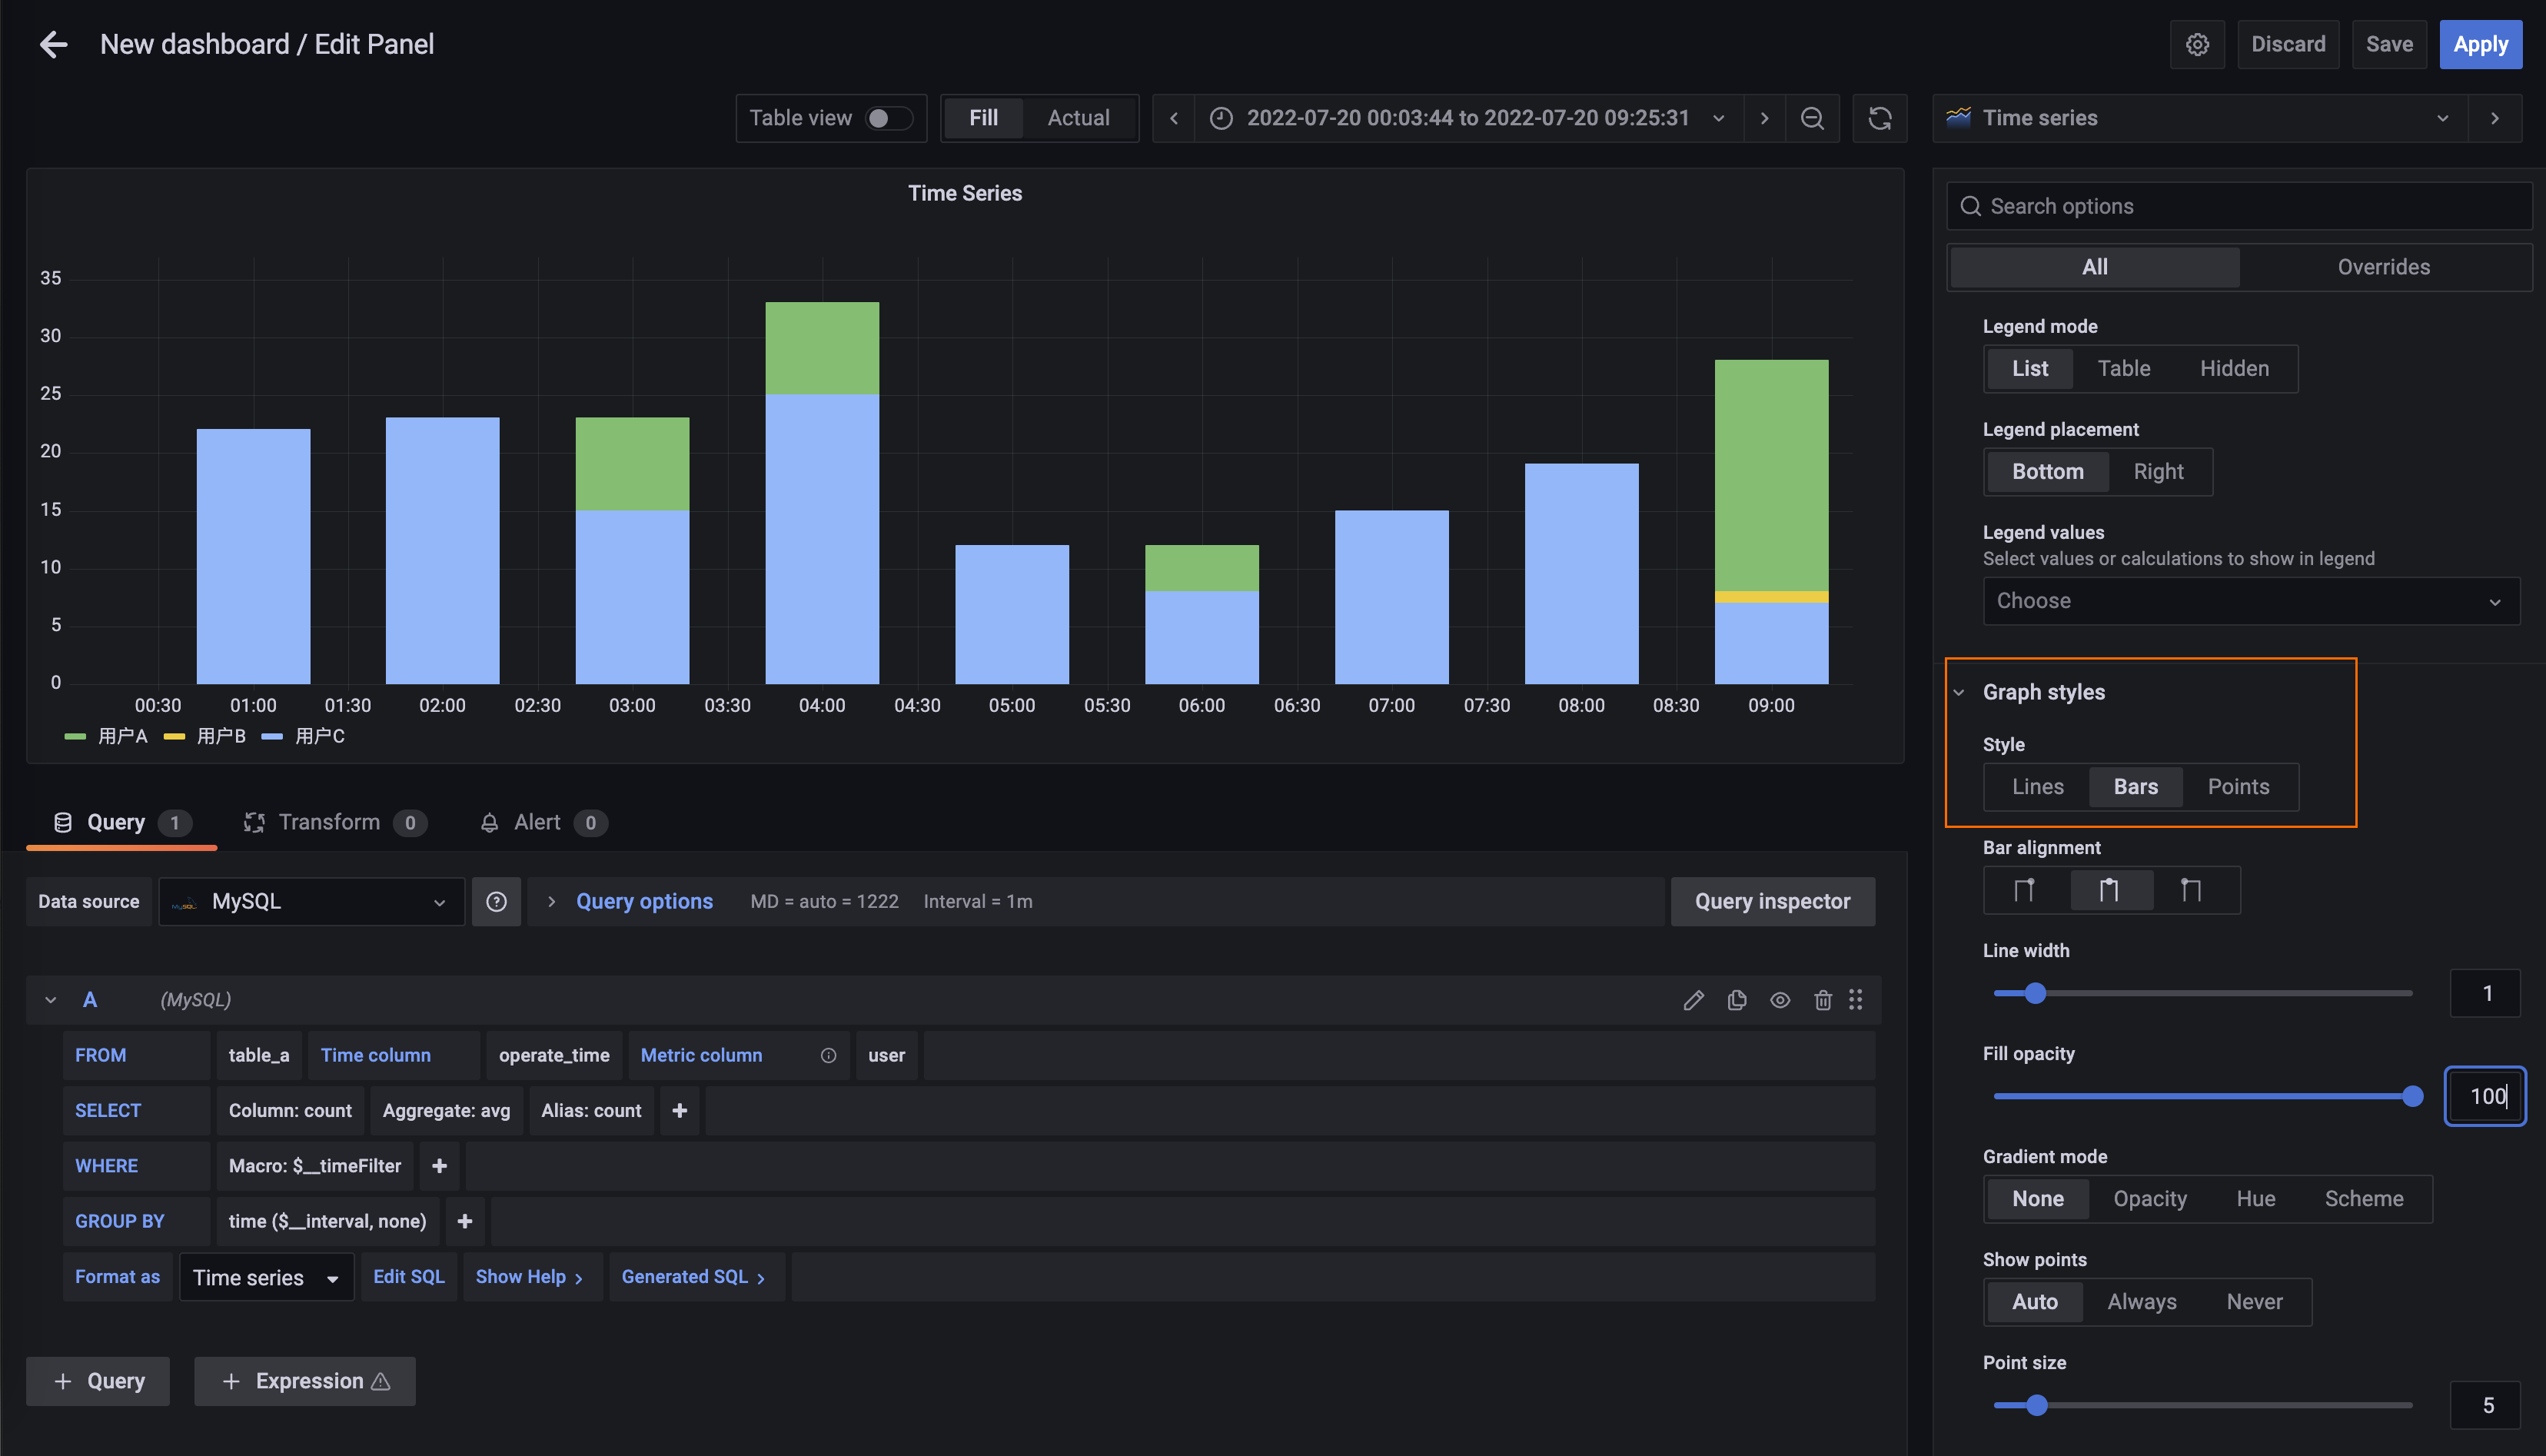
In the upper-right corner, click Apply.