You can view the distribution of logs within a specific time range on the Log Analysis page. The distribution is displayed in a column chart. This topic describes how to view the distribution of logs within a specific time range.
Procedure
-
Log on to the Security Center console. In the top navigation bar, select the region of the asset that you want to manage. The following regions are supported: China and Outside China.
-
In the left-side navigation pane, choose .
-
On the Log Analysis tab, view the distribution of logs within a specific time range.
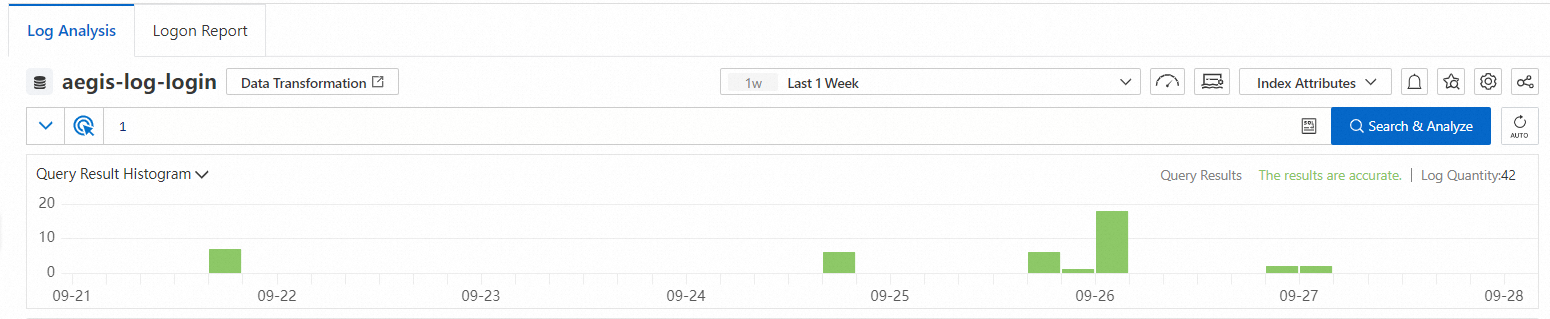
The column chart displays the log distribution over the specified query time range and the total number of queried logs. The x-axis displays the time. The y-axis displays the number of logs that are queried. You can perform the following operations:
-
Click a column in the chart to narrow the time range and display the query results in the new time range.
-
Click the time picker in the upper-right corner and select the time range in which you want to query logs.

-