When traffic spikes hit — during promotions, product launches, or unexpected load bursts — manually scaling your application is too slow and too risky. SAE auto scaling adds and removes instances automatically, based on real-time metrics, so your application handles peak load without over-provisioning during quiet periods.
This guide covers the full setup: preparing your application for safe scaling, choosing the right metrics and thresholds, setting instance limits, observing the scaling process, and maintaining your policy over time.
Prerequisites
Before configuring auto scaling, complete the following tasks:
Health checks configured. SAE only routes traffic to instances that have started, passed their health checks, and are ready. Without health checks, a new instance may receive traffic before it can handle requests — causing errors during scale-out. See Configure application health checks.
Lifecycle management configured. Configure PreStop Settings to enable graceful shutdown. Without this, in-flight requests are dropped when instances are removed during scale-in. See Configure application lifecycle management.
Exponential retry implemented (Java). New instances take time to warm up, and upstream services may not immediately detect new capacity. An exponential retry mechanism in your Java services prevents transient errors during scale-out from surfacing as failures.
Application startup optimized. The faster instances start, the sooner they serve traffic after a scale-out event. Three approaches:
Software packages: Reduce class loading and caching overhead to shorten JVM startup time.
Container images: Minimize image size to reduce pull time when instances are created. Use dive to analyze and trim image layers.
Java startup acceleration: In the SAE console, select the Dragonwell 11 environment and enable startup acceleration when creating a Java application. See Configure startup acceleration for a Java application.
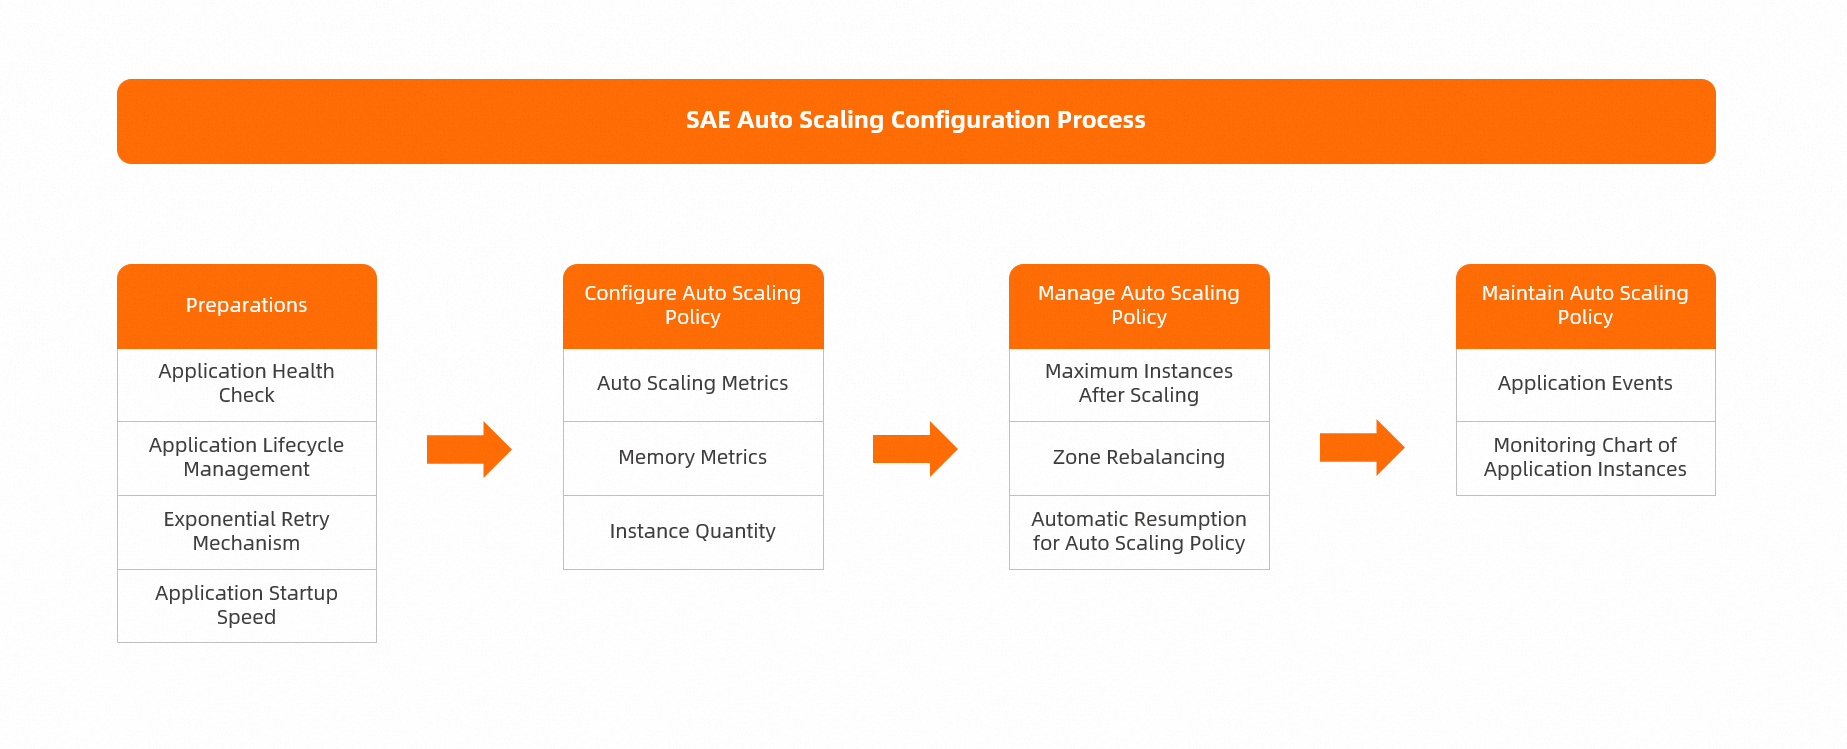
How SAE auto scaling works
The following diagram shows the end-to-end process for configuring SAE auto scaling.
Configure an auto scaling policy
Choose your scaling metrics
SAE supports multiple metric dimensions — CPU utilization, memory usage, and I/O — from the Basic Monitoring and Application Monitoring modules. Choose metrics that reflect your application's actual bottleneck.
Gather baseline data before setting thresholds:
In the Basic Monitoring or Application Monitoring module, review historical metric data for the past 6 hours, 12 hours, 1 day, or 7 days. Note the P95 or P99 values during peak periods.
Run load tests with Performance Testing (PTS) to determine how many concurrent requests each instance handles and at what CPU/memory levels performance degrades.
Choose a threshold based on your priority:
| Priority | Threshold | Effect |
|---|---|---|
| Availability-first | 40% | Scale out earlier; more instances running at any time |
| Balanced | 50% | Moderate buffer between scaling events and resource usage |
| Cost-first | 70% | Fewer instances; less headroom before scaling triggers |
Account for downstream dependencies. Auto scaling your application can overload downstream databases, middleware, or services that haven't been scaled. Configure throttling or graceful degradation alongside auto scaling to preserve end-to-end availability.
After configuring the policy, monitor actual vs. expected load in Basic monitoring and tune the threshold to reduce the gap.
Configure memory metrics for Java applications
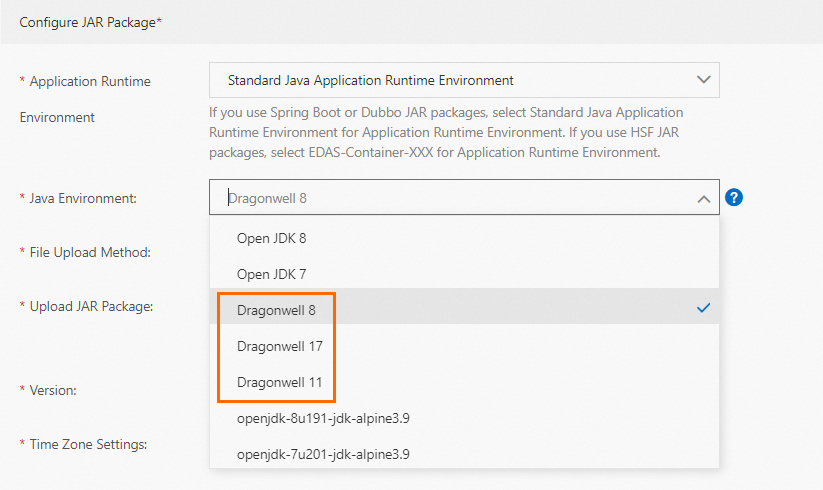
For Java applications running on Dragonwell, enable ElasticHeap to release physical memory back to the OS when the heap is idle. Without this, idle memory stays resident — the memory metric stays elevated even when the application is lightly loaded — which blocks scale-in.
In the Configure JAR Package section, select a Dragonwell runtime from the Java Environment drop-down list.
In the Startup Command Settings section, add the JVM parameter
-XX:+ElasticHeapPeriodicUncommit.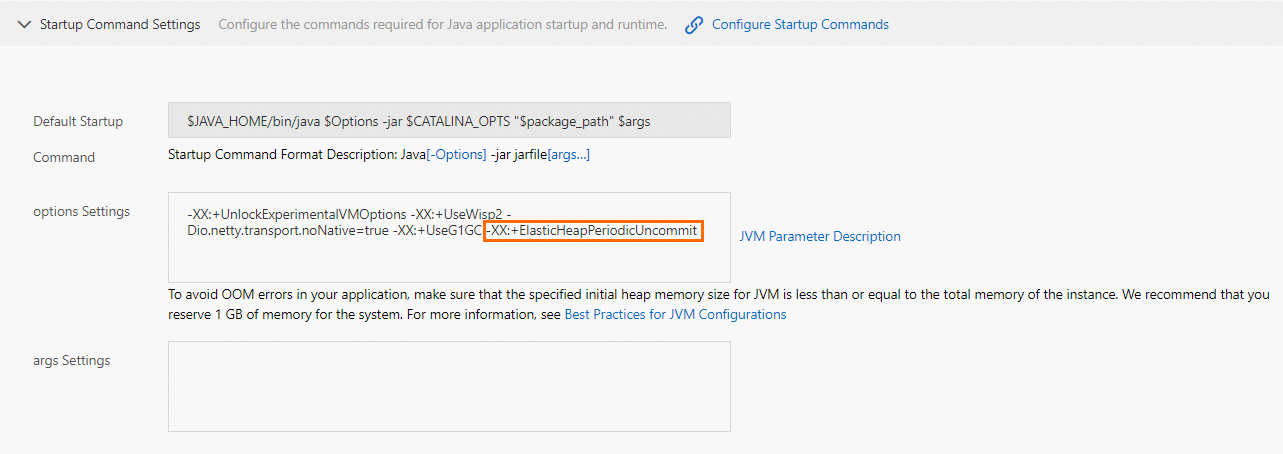
For details on ElasticHeap, see G1ElasticHeap.
Do not use memory-based scaling if your application manages memory through a JVM memory management tool, the glibc malloc allocator, or calls free() explicitly. If idle memory is not promptly released to the OS, the memory metric stays elevated on idle instances and blocks scale-in.Set instance count limits
Minimum instances
Set the minimum to 2 or more, and configure vSwitches across multiple zones. If a zone experiences an underlying node failure, instances in that zone may be evicted. With a single zone or a minimum of 1, the application can stop entirely until a new instance starts elsewhere.
Maximum instances
The maximum instance count must not exceed the number of available IP addresses in the vSwitch. If the limit is exceeded, new instances cannot be added — scale-out silently fails.
Check available IP addresses in the Application Information section of the Basic Information page:
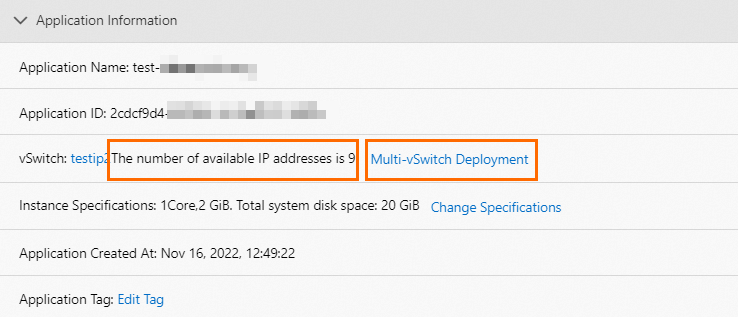
If IP addresses are insufficient, switch to a vSwitch with a larger address range or add additional vSwitches. See Verify an auto scaling policy.
To scale beyond 50 instances for a single application, join DingTalk group 32874633 to add your account to the allowlist.
Observe the scaling process
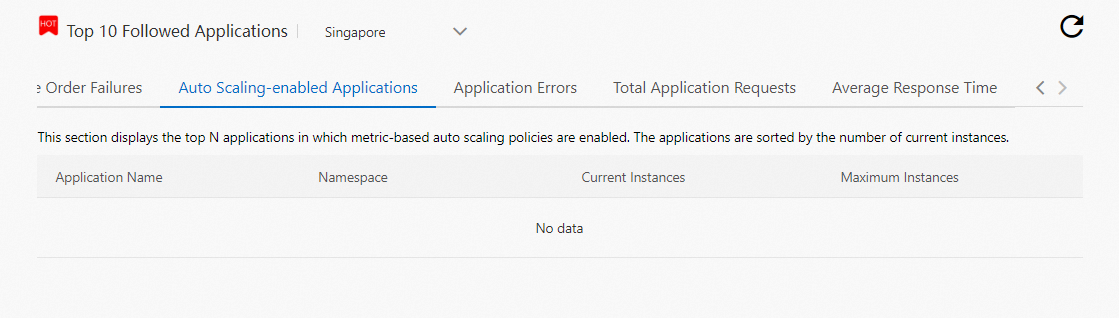
Monitor applications at the instance limit
On the Overview page, SAE highlights applications that have reached their maximum instance count. Review these applications periodically. If an application is consistently at its limit, either raise the maximum or lower the scaling threshold.
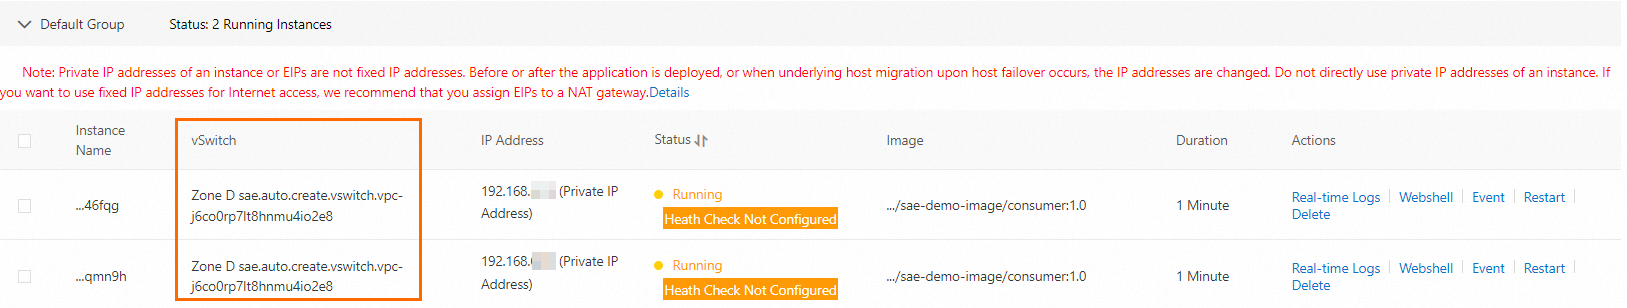
Fix zone imbalances after scale-in
After scale-in, instances may end up concentrated in fewer zones. Check the zone distribution on the Basic Information page. If instances are unevenly distributed, restart one instance to trigger zone rebalancing.
Resume auto scaling after a deployment
SAE automatically disables the auto scaling policy when a change order (such as a deployment) is in progress to avoid conflicts. To restore the policy automatically after the deployment completes, select Automatic on the Deploy Application page.

Maintain auto scaling policies
View scaling events
On the Application Events page, review the history of scaling actions — including the time and direction (scale-out or scale-in) of each event. Use this data to evaluate whether the policy responds at the right thresholds and adjust as needed. See View application events.
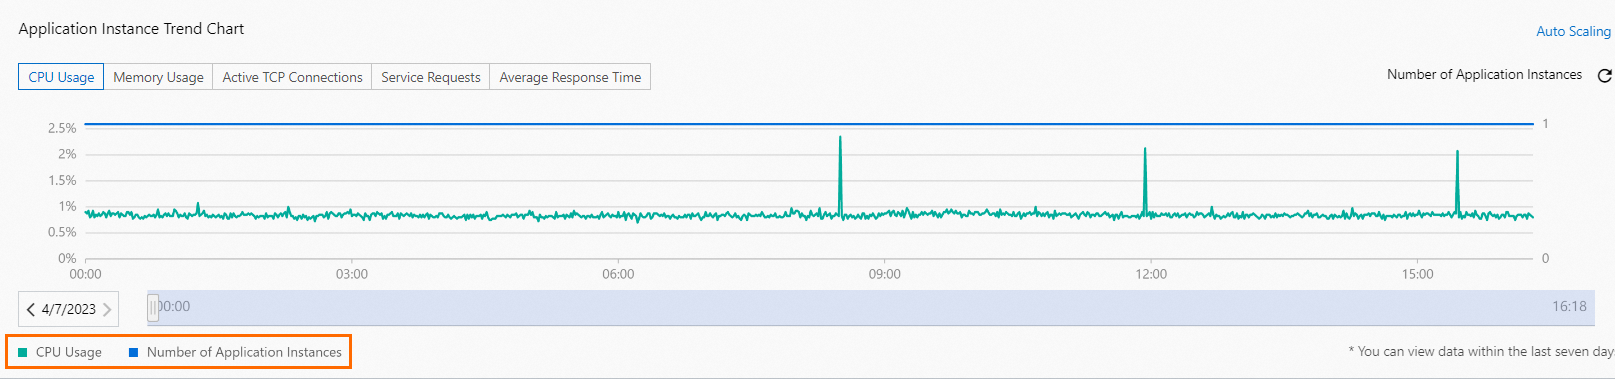
View instance trend charts
The Application Instance Trend Chart on the Basic Information tab shows instance-level metrics for the previous seven days:
| Metric | Description |
|---|---|
| CPU utilization | Percentage of CPU used per instance |
| Memory usage | Memory consumed per instance |
| Active TCP connections | Number of open connections per instance |
| Service requests | Request count per instance |
| Average response time | Mean latency per instance |
Use this chart to correlate scaling events with metric trends and confirm that your thresholds are calibrated correctly. See View the metrics of application instances (invitational preview).