Manually install the ARMS agent for a Go application and deploy it to SAE to enable monitoring. ARMS provides application topology, call trace analysis, and SQL performance analysis for your application.
Prerequisites
-
Activate Container Registry (ACR) and create an Enterprise Edition instance or a Personal Edition instance.
-
Ensure your image build environment can connect to the public internet or the Alibaba Cloud internal network, and the security group for your build environment allows outbound TCP traffic on ports 8080, 9990, 80, and 443.
-
Check your network environment. For more information, see Network configuration for Go application monitoring.
-
Check the operating system, architecture, Go version, and framework version of your image build environment. For more information, see Supported Go components and frameworks for ARMS Application Monitoring.
Limitations
This feature applies only to Go applications deployed using an image.
Overview
-
Prepare a project: This topic uses a demo project as an example.
-
Build an image and push it to an ACR image repository: Build an image from the project and push it to an Alibaba Cloud ACR repository to create a microservice application in SAE.
-
Create an application: Deploy the image from the image repository to SAE and access the application.
-
View application monitoring data: View various types of monitoring data generated by the application.
1. Prepare the project
Upload the Go project to your environment.
2. Build image and push to repository
2.1 Build the image
Download the compile tool and build the application.
-
Download the compile tool.
# Download the wget command.
RUN yum -y install wget
# This example shows how to download the compile tool from the public endpoint in the China (Hangzhou) region.
RUN wget "http://arms-apm-cn-hangzhou.oss-cn-hangzhou.aliyuncs.com/instgo/instgo-linux-amd64" -O instgo
In a production environment, select a download address based on the region where your build machine is located. For a list of download addresses, see Download commands for each region.
NoteThe compile tool binary is the same for all regions. If your environment can access OSS over the public internet, use the China (Hangzhou) public endpoint to download the compile tool for your OS and architecture.
-
Add the execute permission to the binary file.
RUN chmod +x instgo -
Call OpenAPI to obtain the LicenseKey. For more information, see ListLicenseKey.
-
Replace the
go buildcommand with the./instgo buildcommand to build the application.# Use the ./instgo build command to compile the Go project. # Replace {licenseKey} with the LicenseKey that you obtained in the preceding step. RUN ./instgo build --licenseKey="{licenseKey}" --cacheDir=./If you want to test the build or cannot obtain a LicenseKey yet, you can add the
--devflag to enable development mode. In this mode, you do not need to pass a LicenseKey.NoteIf your original build command includes additional build arguments, add them after a
--separator. For example:RUN ./instgo build --licenseKey="{licenseKey}" --cacheDir=./ -- {arg1} {arg2} ...-
-
During the first build, the agent is downloaded to the
/optdirectory by default. You can use the--cacheDirflag to specify a custom cache directory.
-
2.2 Push image to repository
Push the built Go image to an Alibaba Cloud image repository. For more information, see Push and pull images (Enterprise Edition) or Push and pull images (Personal Edition).
3. Create a Go application
Only key steps are covered here. For the full procedure, see Deploy an application using an image.
3.1 Create the application
-
On the Specify Image panel, set Technology Stack Programming Language to Go, and then select an image version.
Select the My Alibaba Cloud Images tab and Container Registry Personal Edition. From the Select Image Version drop-down list, select go-demo-2.
-
On the Advanced Settings page, in the Application Monitoring section, enable Application Monitoring.
Before you enable this feature, modify the custom image and manually install the agent during the build process. ARMS provides a free monthly quota of 200 GB for SAE users. Once enabled, SAE monitors metrics such as request count, error count, average response time, instance GC, and heap memory, and supports call trace analysis.
-
Click Create Application.
3.2 Test access
-
Add a public endpoint to the application. For more information, see Bind an SLB instance to an application and generate a public or private IP address for the application.
After the configuration is complete, the Public Endpoint section of the Application Access Settings page shows the SLB record, including the IP address, port (for example,
2222), and protocol (for example,HTTP). -
Copy the public endpoint and open it in a browser to test access.
4. View application monitoring
SAE console
Go to the Basic Information page of your application. In the left navigation pane, click Application Monitoring. On the Application Monitoring page, view the Monitoring Data.
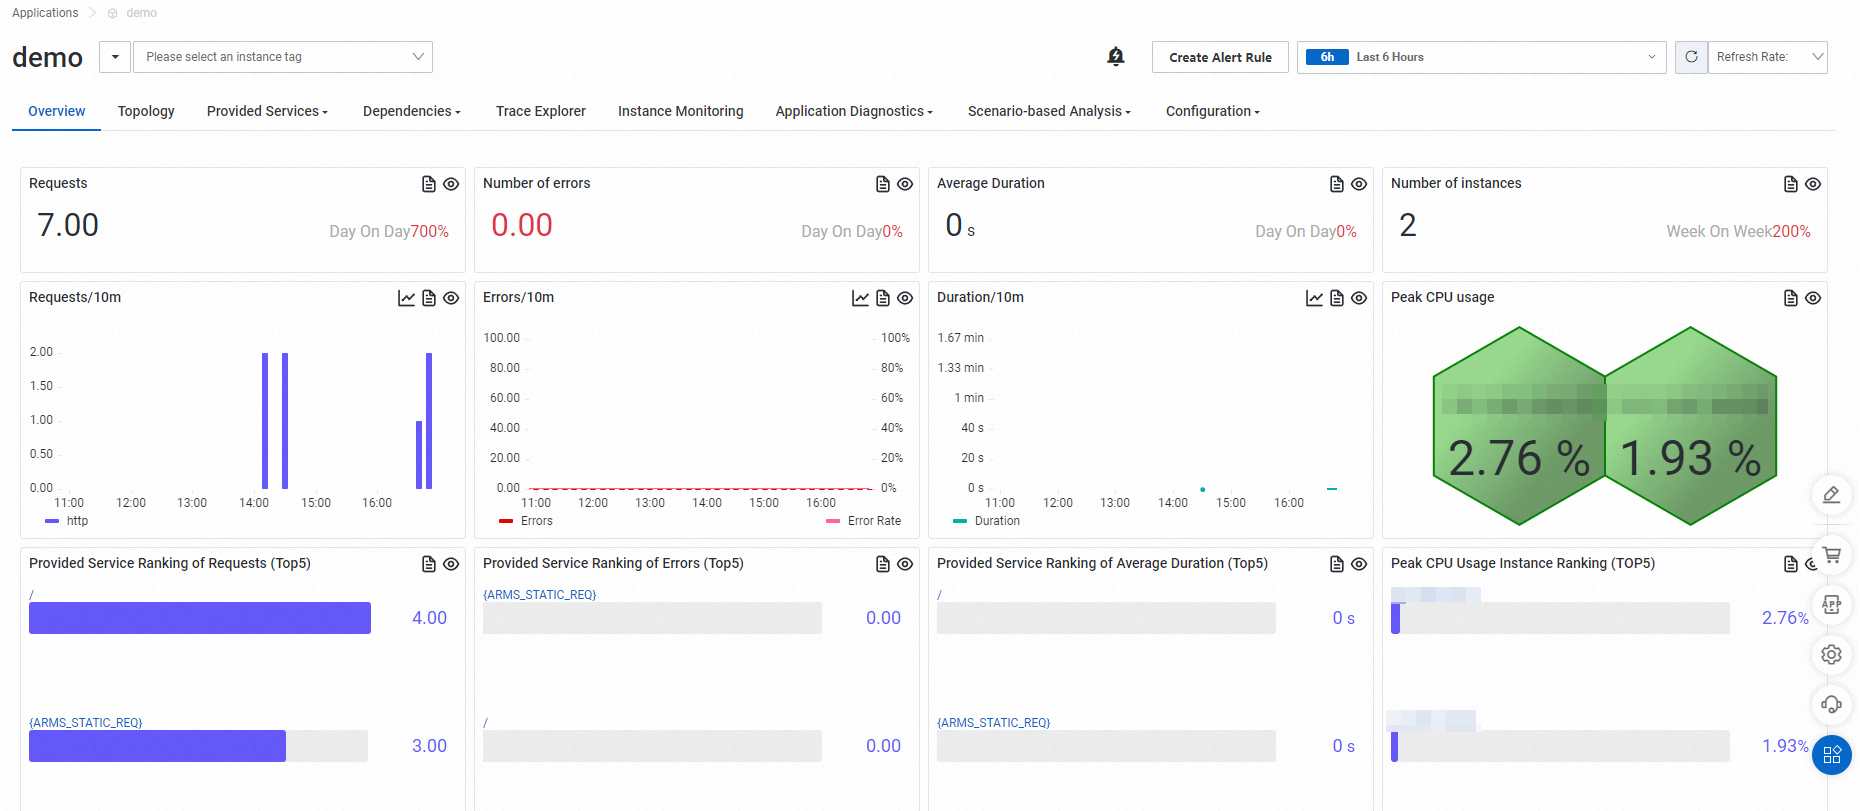
The Application Overview page displays metrics such as request count, error count, average response time, and instance count, along with trend charts. This confirms that monitoring data is collected correctly.
ARMS console
Log on to the ARMS console.
-
In the left navigation pane, choose . In the top menu bar, select the target region.
The page displays metrics for your connected application, such as requests per second, error rate, average response time, number of CVEs, Smart Insight, and response time trend. This confirms that monitoring data is collected correctly.
-
In the search box on the Application List page, search for your application, and then click the application name.
-
View the monitoring data on the details page.