After you manually install the ARMS agent for a Python application and deploy the application to SAE, you can use ARMS to monitor the application. With ARMS, you can view various types of monitoring data, such as application topology, call trace analysis, and SQL performance analysis. This topic describes how to manually install the ARMS agent for an application and deploy the application to SAE.
Prerequisites
-
Ensure that your build environment can connect to the public internet or an Alibaba Cloud internal network. The security group for your build environment must allow outbound TCP traffic on ports 80 and 443.
-
Check that your Python version and framework are supported. For specific requirements, see Python components and frameworks supported by ARMS Application Monitoring.
-
If you plan to deploy your Python project to SAE by using an image, you must activate Container Registry (ACR) and create an Enterprise instance or a Personal instance.
Python framework compatibility
Review these framework-specific requirements before you proceed.
uvicorn
If your application starts with uvicorn, choose one of the following approaches:
Approach A: Import the agent in code. Add this import statement to the first line of your uvicorn entry file:
from aliyun.opentelemetry.instrumentation.auto_instrumentation import sitecustomizeApproach B: Switch to gunicorn with the aliyun-instrument prefix. Replace your uvicorn command:
# Before
uvicorn app:app --workers 4 --port=9090 --host 0.0.0.0

# After
aliyun-instrument gunicorn -w 4 -k uvicorn.workers.UvicornWorker -b 0.0.0.0:8000 app:appThe aliyun-instrument prefix handles initialization and non-intrusive instrumentation of the ARMS Python agent.
uWSGI
If your application starts with uWSGI, see Install the Python agent for a Django or Flask project that starts with uWSGI.
gevent
If you use gevent coroutines, set the GEVENT_ENABLE environment variable to true.
For example, if your code contains:
from gevent import monkey
monkey.patch_all()
Set the following environment variable in your deployment:
GEVENT_ENABLE=trueOverview
-
Prepare the project: This topic uses a demo project as an example.
-
Build a Docker image or package the project: If you deploy the application using an image, you must install the Python agent during the image build process. If you deploy the application using a code package, the system automatically installs the agent. You only need to configure the startup command to launch the application with the ARMS agent.
-
Deploy the Python application: Deploy the application in SAE and enable Application Monitoring. If you use a code package, you must also set the startup command to launch the application with the ARMS agent.
-
View monitoring data: View the monitoring data generated by the application.
Step 1: Prepare the project
-
Upload your project to your build environment.
-
Install the required dependencies to test the project. For more information, see Installing packages.
-
Test the project locally to ensure it runs correctly.
Step 2: Build a Docker image or package the project
Docker image
-
Build the Python image.
This section provides the commands to download, install, and start the application with the ARMS Python agent.
... # Download the agent installer from PyPI. RUN pip3 install aliyun-bootstrap # Install the Python agent by using aliyun-bootstrap. RUN aliyun-bootstrap -a install ... # Start the application by using the ARMS Python agent. CMD ["aliyun-instrument","python","main.py"]NoteIf you do not want to use the Python agent to start the application, you must import the agent in your application's main entry file, such as
main.py, and then start the application.from aliyun.opentelemetry.instrumentation.auto_instrumentation import sitecustomize -
Push the built Python image to Alibaba Cloud Container Registry (ACR). For more information, see Push and pull images (Enterprise Edition) or Push and pull images (Personal Edition).
ZIP package
Package your Python project into a ZIP file in your local environment. For more information, see Instructions for packaging a Python project into a ZIP file.
Step 3: Create the application
From image
Step 3.1: Create the application
This section covers only the key steps. For detailed instructions, see Deploy an application using an image.
-
On the Specify Image panel, set Technology Stack Programming Language to Python and select your desired image version.
Select the My Alibaba Cloud Images tab and Personal Edition of Container Registry. From the Select Image Version drop-down list, select
python2. -
On the Advanced Settings page, in the Application Monitoring section, enable Application Monitoring.
To use Application Monitoring with a custom image, you must first modify the image to install the Python agent during the build process. ARMS provides a free quota of 200 GB per month for SAE users.
-
Click Create Application.
Step 3.2: Verify access
Public endpoint
-
Add a public endpoint for the application. For more information, see Bind a CLB instance to an application and generate a public or internal endpoint.
After configuration, the Public Endpoint section displays the bound CLB address, with the port set to
2222and the protocol toHTTP. -
Copy the public endpoint and paste it into your browser to test it.
Webshell
-
Go to the Basic Information page of the application and click the Instances tab.
-
In the Actions column for the target instance, click Webshell.
-
On the Webshell page, run the command
curl 127.0.0.1:<container port>to test.
From code package
Step 3.1: Create the application
This section covers only the key steps. For detailed instructions, see Deploy a Python application.
-
On the Configure Code Package-based Deployment panel, set Technology Stack Programming Language to Python. In the Upload ZIP Package section, click the
 icon to upload your ZIP file.
From the Python Environment drop-down list, select Python 3.9.15.
-
On the Advanced Settings page, configure the following settings.
-
In the Startup Command section, enter the following command.
aliyun-instrument python main.py
# Start the application by using the ARMS Python agent. main.py is the main entry file in this example.
Select /bin/sh as the command type.
-
In the Application Monitoring section, enable Application Monitoring.
-
-
Click Create Application.
Step 3.2: Verify access
Public endpoint
-
Add a public endpoint for the application. For more information, see Bind a CLB instance to an application and generate a public or internal endpoint.
-
Copy the public endpoint and paste it into your browser to test it.
Webshell
-
Go to the Basic Information page of the application and click the Instances tab.
-
In the Actions column for the target instance, click Webshell.
-
On the Webshell page, run the command
curl 127.0.0.1:<container port>to test.
Step 4: View monitoring data
SAE console
Go to the Basic Information page of your application. In the left-side navigation pane, click Application Monitoring. On the Application Monitoring page, you can view the Monitoring Data.
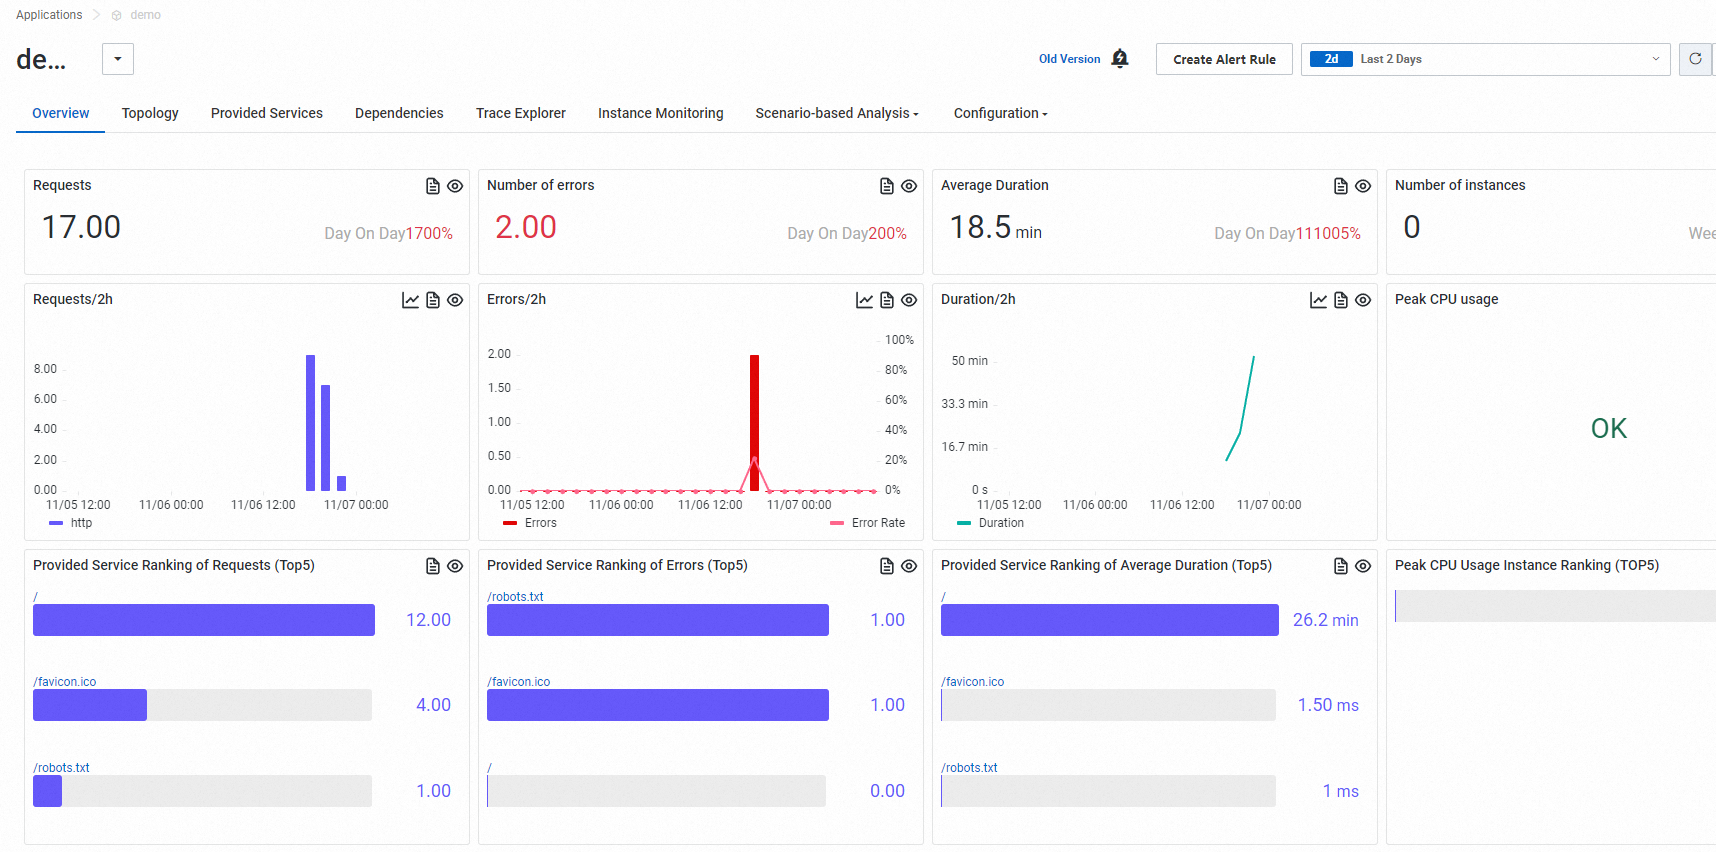
The Application Overview tab displays four core metric cards: Requests, Errors, Avg. Response Time, and Instances, complete with day-over-day and week-over-week comparisons. The tab also features a time-series trend chart and lists the top five rankings for requests, errors, average response time, and peak CPU utilization.
ARMS console
Log on to the ARMS console.
-
In the left-side navigation pane, choose . In the top navigation bar, select the target region.
On the Applications page, you can see the connected applications and their key monitoring metrics, such as requests per second, error rate, and average response time. This confirms your application is connected to Application Monitoring.
-
On the Application List page, search for your application and click its name.
-
View the application's monitoring data on the details page.