This white paper covers peak throughput and latency benchmarks for Tair memory-optimized, Tair Persistent Memory-optimized, and Redis Open-Source Edition instances, along with the test environment, tool, and commands needed to reproduce the results.
Test results
These numbers reflect peak performance on new instances under single-command tests, averaged across multiple runs and zones. An error margin of approximately 10% is normal. Do not run instances at peak load in production. For accurate sizing, run tests with your own workload.
The following table shows QPS and latency measurements for eleven common Redis commands.
Command | Tair memory-optimized | Redis Open-Source Edition | Tair Persistent Memory-optimized | ||||||
QPS | Average Latency | 99th Percentile Latency | QPS | Average Latency | 99th Percentile Latency | QPS | Average Latency | 99th Percentile Latency | |
SET | 282,656 | 0.45 | 0.86 | 142,376 | 0.45 | 0.72 | 135,247 | 0.93 | 1.50 |
GET | 519,761 | 0.24 | 0.36 | 204,690 | 0.31 | 0.47 | 208,960 | 0.61 | 0.90 |
ZADD | 208,169 | 0.62 | 1.14 | 113,135 | 0.57 | 0.78 | 96,007 | 1.29 | 1.90 |
ZSCORE | 463,904 | 0.27 | 0.40 | 170,163 | 0.37 | 0.54 | 154,693 | 0.82 | 1.00 |
HSET | 260,069 | 0.49 | 1.03 | 124,613 | 0.51 | 0.97 | 68,565 | 1.81 | 3.80 |
HGET | 494,603 | 0.25 | 0.37 | 188,903 | 0.34 | 0.52 | 180,050 | 0.70 | 0.91 |
LPUSH | 286,324 | 0.44 | 0.84 | 153,269 | 0.42 | 0.59 | 143,951 | 0.87 | 1.20 |
LINDEX | 414,070 | 0.30 | 0.45 | 157,568 | 0.40 | 0.58 | 62,112 | 2.01 | 2.80 |
SADD | 292,738 | 0.44 | 0.86 | 140,155 | 0.45 | 0.63 | 138,710 | 0.90 | 1.20 |
SISMEMBER | 531,139 | 0.24 | 0.34 | 181,492 | 0.35 | 0.52 | 162,585 | 0.78 | 0.99 |
EVALSHA | 214,303 | 0.60 | 1.12 | 101,136 | 0.63 | 0.91 | 89,726 | 1.38 | 2.10 |
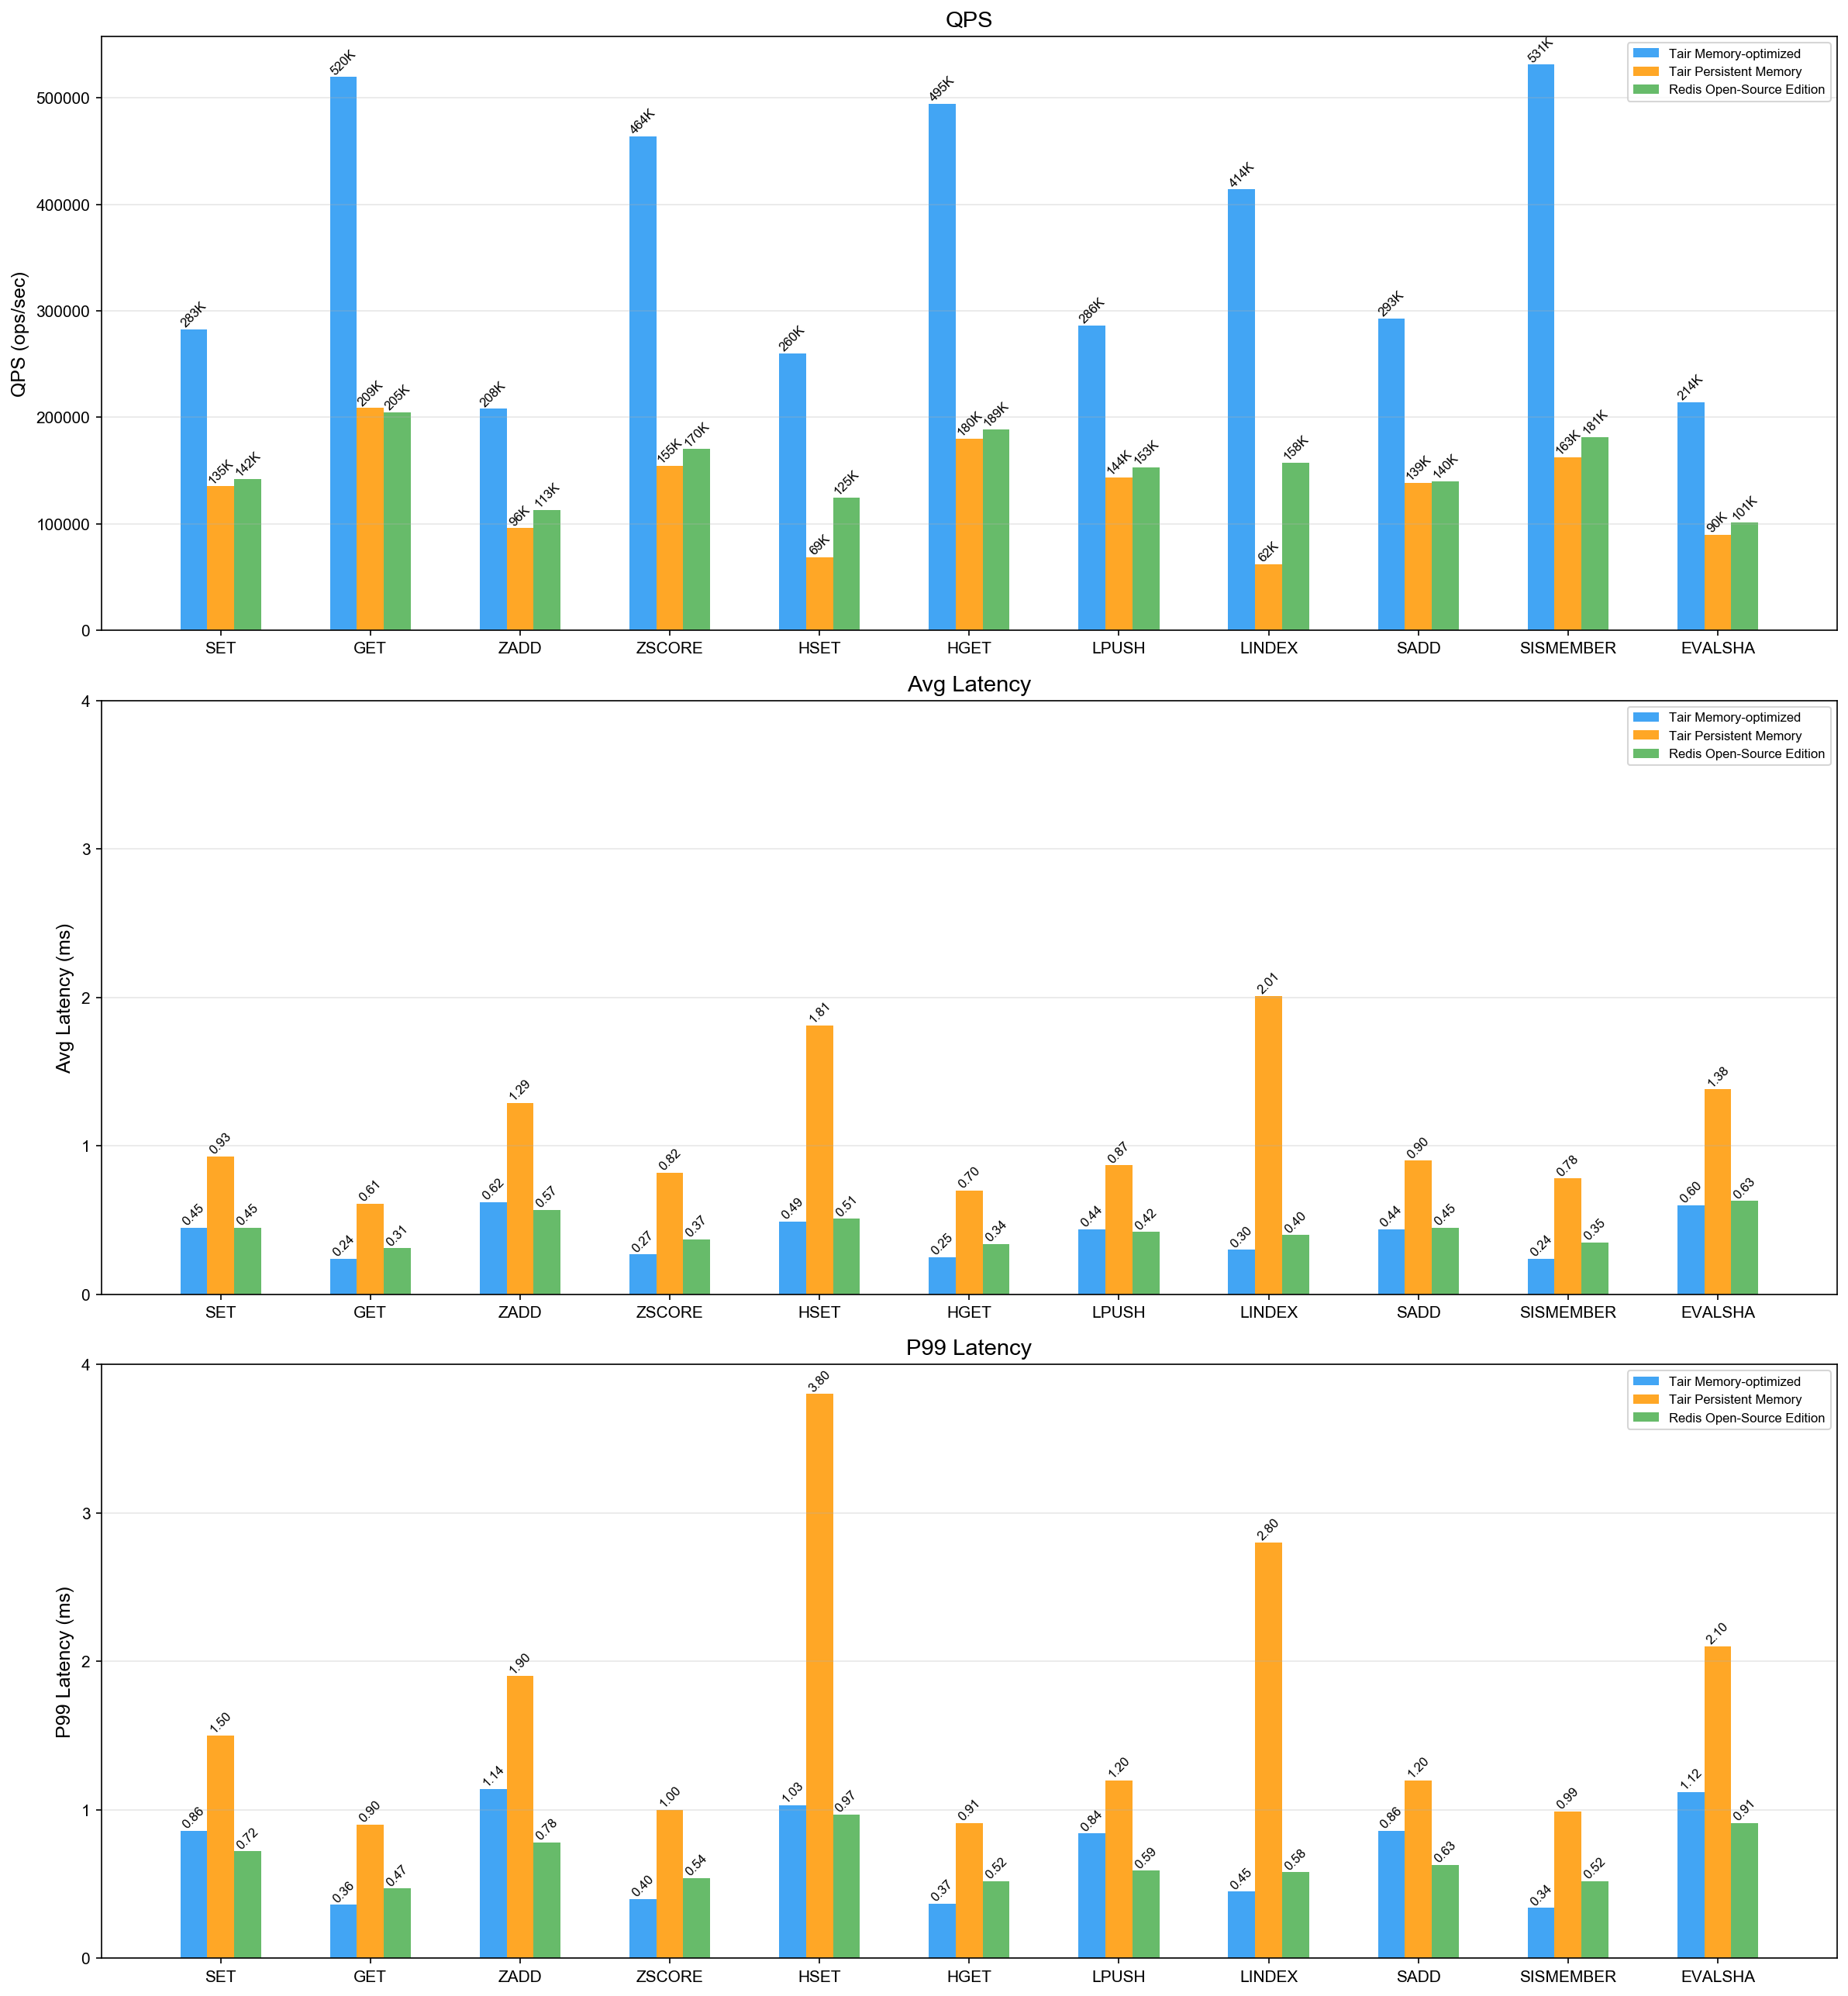
Metric definitions:
QPS (Queries Per Second): Number of read and write operations processed per second.
Average latency: Average operation latency, in milliseconds (ms).
99th percentile latency: The maximum latency for 99% of operations, in ms. For example, 0.5 ms means 99% of requests complete within 0.5 ms.
Latency is measured end-to-end, including queuing time on both the database and the stress testing client.
99th percentile latency spikes can be triggered by data-structure encoding transitions, especially when writing to an empty instance for the first time.
Performance scaling for other architectures
The table above covers the standard architecture (dual-replica). For other architectures, scale from the standard baseline using the following rules, where *n* is the number of shards in a cluster architecture or the total number of nodes in a read/write splitting architecture:
Architecture | QPS scaling rule |
Cluster (proxy mode) | >= n x standard architecture QPS (with evenly distributed keys) |
Cluster (direct connection mode) | = n x standard architecture QPS (with evenly distributed keys) |
Read/write splitting | Write: slightly below standard because of more replication traffic; Read: >= n x standard architecture QPS |
Test environment
Database
Parameter | Value |
Regions and zones | China (Beijing) Zone L, China (Hangzhou) Zone K, China (Shanghai) Zone N, China (Shenzhen) Zone C |
Instance architecture | Standard architecture (dual-replica); cluster not enabled |
Instance version | Redis 7.0 |
Instance types | Tair memory-optimized 8 GB ( |
The version has little impact on test results.
For more information, see Standard architecture and Instance types and FAQ.
Test client
Parameter | Value |
Instance type | Elastic Compute Service (ECS) |
Region and zone | Same as the database instance |
Operating system | Alibaba Cloud Linux 3 |
Network | Same virtual private cloud (VPC) as the Tair instance |
Test tool
All tests use resp-benchmark, an open-source tool from the Tair team.
For common commands (SET, GET), its behavior is consistent with redis-benchmark.
For complex commands, it uses a test mode that more closely simulates real-world workloads.
Multi-threaded mode is enabled by default to maximize request pressure on the server and prevent the client from becoming a bottleneck.
Install resp-benchmark:
pip install resp-benchmark==0.1.7After installation, run resp-benchmark --help for the full list of configuration options.
If you use redis-benchmark instead, use Redis 7.0 or later for optimized multi-threaded support.
Run the tests
Before you begin
Clear the database before each test to avoid interference from existing data.
Tune the connection count
The connection count (-c) directly affects your results:
Too few connections: Insufficient load on the server, resulting in low QPS that does not reflect peak capacity.
Too many connections: The server's processing capacity is exceeded, causing data packets to queue in the network link and driving up latency.
Start with -c 128 and adjust based on your results. Common values are 32, 64, 128, 192, and 256. If you omit -c, resp-benchmark selects a value automatically.
Test commands
SET
Tests the performance of the SET command. Key range: 0–10,000,000. Value size: 64 bytes. Test duration: 20 seconds.
resp-benchmark -h r-bp1u****8qyvemv2em.redis.rds.aliyuncs.com -p 6379 -s 20 "SET {key uniform 10000000} {value 64}"GET
Tests the performance of the GET command. Value size: 64 bytes. Test duration: 20 seconds.
Load test data. Key range: 0–10,000,000.
resp-benchmark -h r-bp1u****8qyvemv2em.redis.rds.aliyuncs.com -p 6379 --load -c 256 -P 10 -n 10000000 "SET {key sequence 10000000} {value 64}"Run the GET test.
resp-benchmark -h r-bp1u****8qyvemv2em.redis.rds.aliyuncs.com -p 6379 -s 20 "GET {key uniform 10000000}"
ZADD
Tests write performance of the ZADD command. Key range: 0–1,000. Score range: 0–70,000. Maximum 10,000 members per key. Test duration: 20 seconds.
resp-benchmark -h r-bp1u****8qyvemv2em.redis.rds.aliyuncs.com -p 6379 -s 20 "ZADD {key uniform 1000} {rand 70000} {key uniform 10000}"ZSCORE
Tests the performance of the ZSCORE command. Test duration: 20 seconds.
Load test data. Key range: 0–1,000. 10,007 members per key.
resp-benchmark -h r-bp1u****8qyvemv2em.redis.rds.aliyuncs.com -p 6379 --load -c 256 -P 10 -n 10007000 "ZADD {key sequence 1000} {rand 70000} {key sequence 10007}"Run the ZSCORE test.
resp-benchmark -h r-bp1u****8qyvemv2em.redis.rds.aliyuncs.com -p 6379 -s 20 "ZSCORE {key uniform 1000} {key uniform 10007}"
HSET
Tests the performance of the HSET command. Key range: 0–1,000. Field range: 0–10,000. Value size: 64 bytes. Test duration: 20 seconds.
resp-benchmark -h r-bp1u****8qyvemv2em.redis.rds.aliyuncs.com -p 6379 -s 20 "HSET {key uniform 1000} {key uniform 10000} {value 64}"HGET
Tests the performance of the HGET command. Test duration: 20 seconds.
Load test data. Key range: 0–1,000. 10,007 fields per key. Value size: 64 bytes.
resp-benchmark -h r-bp1u****8qyvemv2em.redis.rds.aliyuncs.com -p 6379 --load -c 256 -P 10 -n 10007000 "HSET {key sequence 1000} {key sequence 10007} {value 64}"Run the HGET test.
resp-benchmark -h r-bp1u****8qyvemv2em.redis.rds.aliyuncs.com -p 6379 -s 20 "HGET {key uniform 1000} {key uniform 10007}"
LPUSH
Tests the performance of the LPUSH command. Key range: 0–1,000. Value size: 64 bytes. Test duration: 20 seconds.
resp-benchmark -h r-bp1u****8qyvemv2em.redis.rds.aliyuncs.com -p 6379 -s 20 "LPUSH {key uniform 1000} {value 64}"LINDEX
Tests the performance of the LINDEX command. Test duration: 20 seconds.
Load test data. Key range: 0–1,000. 10,000 elements per key. Value size: 64 bytes.
resp-benchmark -h r-bp1u****8qyvemv2em.redis.rds.aliyuncs.com -p 6379 --load -c 256 -P 10 -n 10000000 "LPUSH {key sequence 1000} {value 64}"Run the LINDEX test.
resp-benchmark -h r-bp1u****8qyvemv2em.redis.rds.aliyuncs.com -p 6379 -s 20 "LINDEX {key uniform 1000} {rand 10000}"
SADD
Tests the performance of the SADD command. Key range: 0–1,000. Value size: 64 bytes. Test duration: 20 seconds.
resp-benchmark -h r-bp1u****8qyvemv2em.redis.rds.aliyuncs.com -p 6379 -s 20 "SADD {key uniform 1000} {value 64}"SISMEMBER
Tests the performance of the SISMEMBER command. Test duration: 20 seconds.
Load test data. Key range: 0–1,000. 10,007 members per key. Value size: 64 bytes.
resp-benchmark -h r-bp1u****8qyvemv2em.redis.rds.aliyuncs.com -p 6379 --load -c 256 -P 10 -n 10007000 "SADD {key sequence 1000} {key sequence 10007}"Run the SISMEMBER test.
resp-benchmark -h r-bp1u****8qyvemv2em.redis.rds.aliyuncs.com -p 6379 -s 20 "SISMEMBER {key uniform 1000} {key uniform 10007}"
EVALSHA
Tests the performance of SET executed via a Lua script. Key range: 0–10,000,000. Value size: 64 bytes. Test duration: 20 seconds.
Load the Lua script.
redis-cli -h r-bp1u****8qyvemv2em.redis.rds.aliyuncs.com -p 6379 SCRIPT LOAD "return redis.call('SET', KEYS[1], ARGV[1])"Run the EVALSHA test using the SHA1 digest returned in the previous step.
resp-benchmark -h r-bp1u****8qyvemv2em.redis.rds.aliyuncs.com -p 6379 -s 20 "EVALSHA d8f2fad9f8e86a53d2a6ebd960b33c4972cacc37 1 {key uniform 10000000} {value 64}"