View the startup and operational logs of a running Flink job to monitor its status and troubleshoot issues.
Log types
Realtime Compute for Apache Flink (Realtime Flink) exposes two types of logs for a running job:
| Log type | Coverage |
|---|---|
| Startup logs | Generated from Flink environment initialization through Job Manager startup. |
| Operational logs | Job Manager and Task Manager logs during job execution. Available on the Job Logs page and the Flink UI. |
Startup logs do not include scheduling logs. For scheduling-related issues — such as insufficient resources or insufficient IP addresses for a vSwitch — check management events in the console.
Prerequisites
Before you begin, ensure that you have:
-
A job instance in the running state
Usage notes
Logs are paginated to help you troubleshoot faults. Each page displays 1 MB of logs, or roughly 8,000–9,000 lines. If you cannot find the issue on the current page, switch to the next page.
View startup logs
-
Log on to the Real-time Compute console.
-
In the Actions column of the target workspace, click Console.
-
In the navigation pane on the left, choose Operation Center > Job O&M.
-
Click the name of the target job.
-
Click Job Logs.
-
On the Startup Logs tab, view the startup logs.

View operational logs
Operational logs are available in two places: the Job Logs page in the console, and the Flink UI. Both provide access to Job Manager and Task Manager logs.
View logs on the Job Logs page
-
Log on to the Real-time Compute console.
-
In the Actions column of the target workspace, click Console.
-
In the navigation pane on the left, choose Operation Center > Job O&M.
-
Click the name of the target job.
-
Click Job Logs.
-
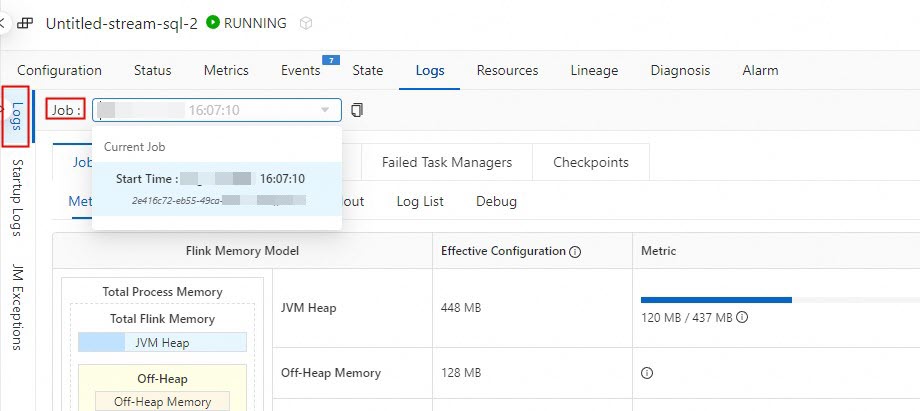
On the Operational Logs tab, click the drop-down list next to Job and select the running job.
-
View the logs:
-
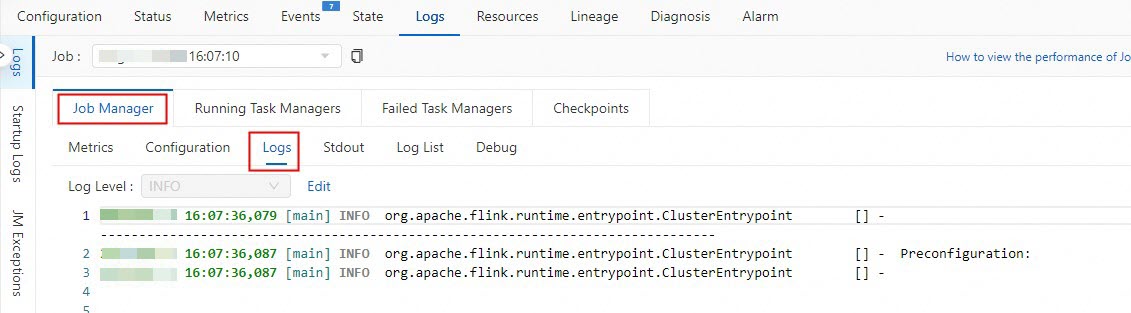
Job Manager logs: On the Job Manager tab, click Logs.
-
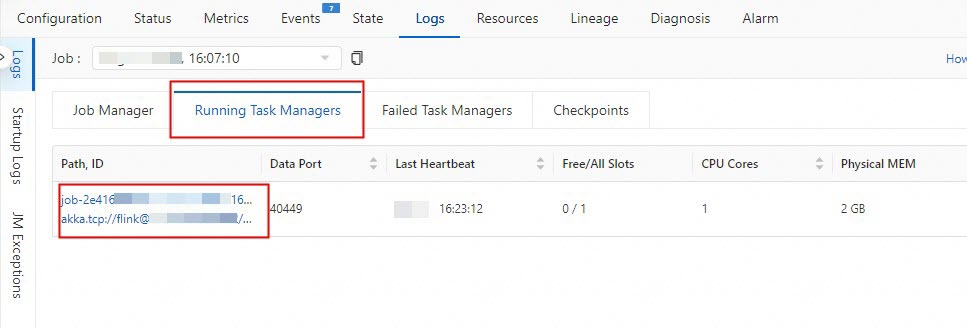
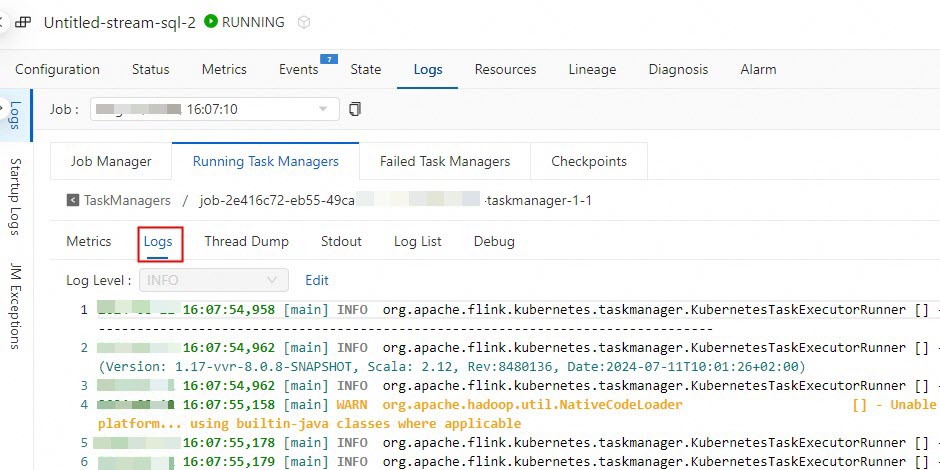
Task Manager logs: On the Running Task Managers tab, click Path, ID, then click Logs.
-
View logs on the Flink UI
-
Log on to the Real-time Compute console.
-
In the Actions column of the target workspace, click Console.
-
In the navigation pane on the left, choose Operation Center > Job O&M.
-
Click the name of the target job.
-
On the Overview page, click Flink UI.
-
In the left pane, click Task Managers or Job Manager:
-
Task Managers: Click the target Path, ID to view Task Manager logs.
-
Job Manager: On the Logs tab, view the Job Manager logs.
-