Diagnose performance bottlenecks in running deployments with flame graphs, memory profiling, thread sampling, and thread dumps at the JVM level.
Prerequisites
Before you begin, make sure that you have:
-
Namespace-level permissions for Realtime Compute for Apache Flink granted to your Alibaba Cloud account or RAM user. Grant namespace permissions.
Limitations
-
Only Ververica Runtime (VVR) 4.0.11 or later supports deployment performance monitoring.
-
Performance data is available only for running deployments. Historical deployment data is not retained.
Choose a tool
Start with the tool that matches the symptom you are investigating.
|
Symptom |
Tool |
What it shows |
|
High CPU usage or slow throughput |
Flame Graph |
CPU-intensive methods and their call stacks |
|
Suspected memory pressure |
Flame Graph (Alloc mode) or Memory |
Memory allocation by function, or JVM memory usage by space |
|
Thread contention or suspected deadlocks |
Flame Graph (Lock mode) or Threads |
Lock contention patterns, or per-thread stack traces via sampling |
|
Need a full snapshot of all thread states |
Thread Dump |
All thread stacks at a single point in time |
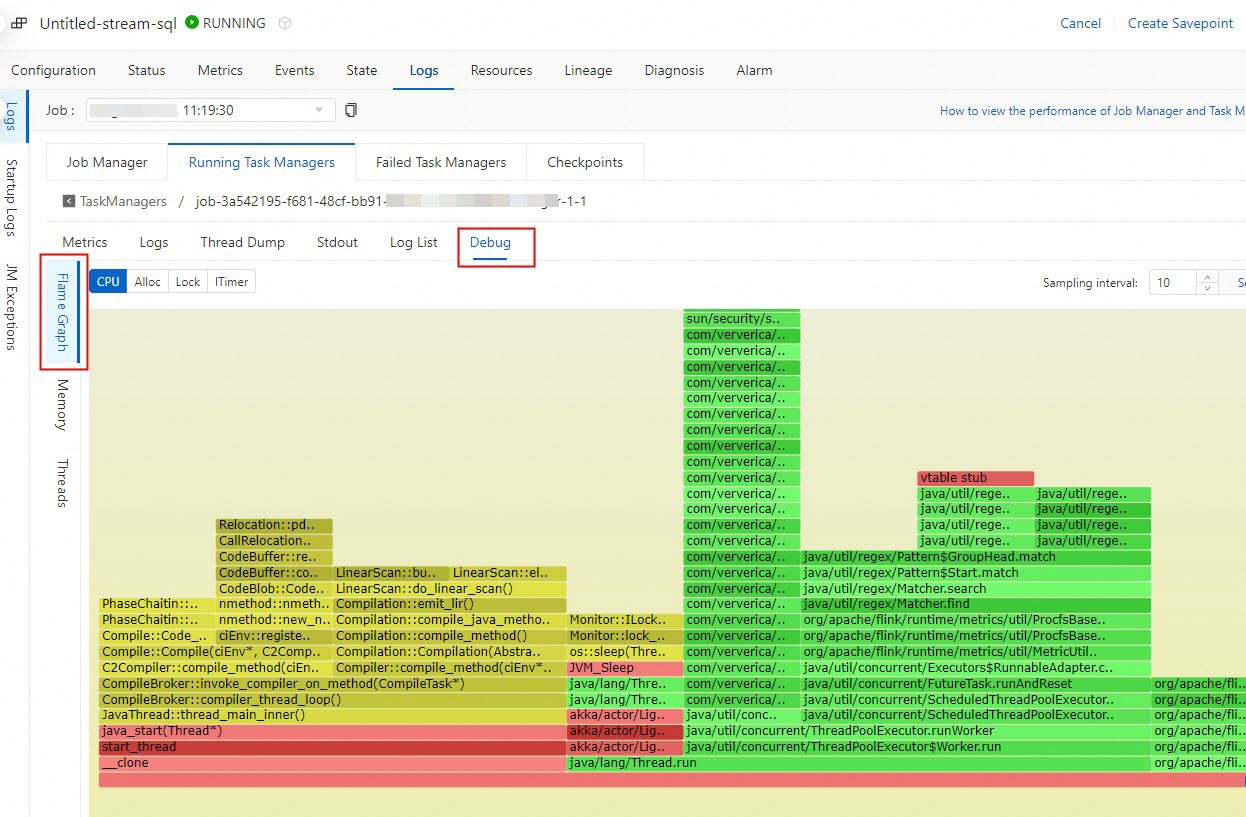
Flame Graph
Flame graphs render call stacks as layered horizontal bars. Each bar is a stack frame — wider bars indicate more CPU time and signal potential bottlenecks. The bottom layer is the entry point; higher layers are deeper calls.
The Apache Flink Flame Graphs documentation covers the underlying concepts.
Flame graph modes
|
Mode |
What it captures |
|
CPU |
Stack traces from actively running threads. Wider frames indicate higher CPU usage. |
|
Alloc |
Memory allocated by each function. Identifies functions that generate the most heap pressure. |
|
Lock |
Lock contention and deadlock patterns. Highlights functions waiting to acquire locks. |
|
ITimer |
CPU consumption across all threads within a sampling interval. Similar to CPU mode but does not require |
Identify bottlenecks with flame graphs
-
Look for wide frames. A wide frame means the function consumes a large share of CPU time — the most common hot-spot indicator.
-
Check frame frequency. Frames that appear repeatedly across samples indicate frequently called functions that may cause cumulative performance degradation.
-
Interpret vertical position. Wide frames near the bottom suggest issues in the main application path. Wide frames near the top point to a specific function deep in the call stack.
-
Optimize the hot spots. Review the code for problematic functions. Common fixes include reducing loop iterations, improving data structures, and minimizing synchronization.
-
Compare before and after. Generate a new flame graph after optimizing and compare it with the original to verify the fix.
Flame graphs use sampled data and may not capture the full execution context. Combine them with the other tools on this page for better diagnosis. Non-Java functions appear as "unknown" — the async-profiler discussion explains why.
Memory
The Memory tab shows memory usage across JVM spaces (heap, non-heap, metaspace, and others). Use it to identify memory leaks, excessive garbage collection, or spaces approaching their limits.
Threads
Thread sampling captures stack traces over a time window, showing what each thread does during a performance issue.
Sample a thread
Access the Debug tab for the component to inspect:
-
JobManager: On the Logs tab, click the Job Manager tab, then click Debug.
-
TaskManager: On the Logs tab, click the Running Task Managers tab, click the value in the Path, ID column, then click Debug.
On the Threads tab, find the operator to inspect and click Sample in the Actions column. Wait for sampling to complete, then review the thread stacks.
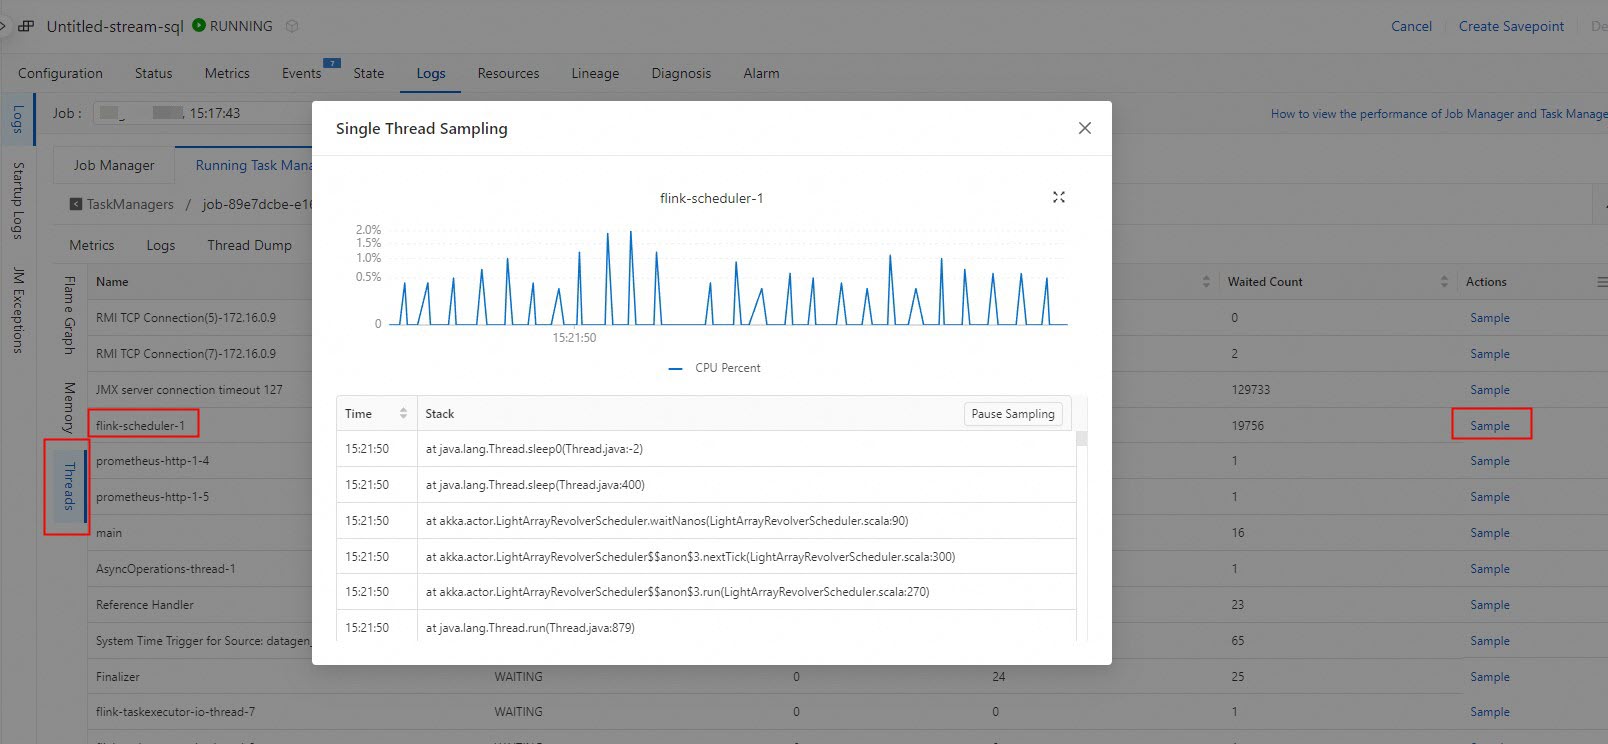
This example shows thread stacks accessed by Gemini State.
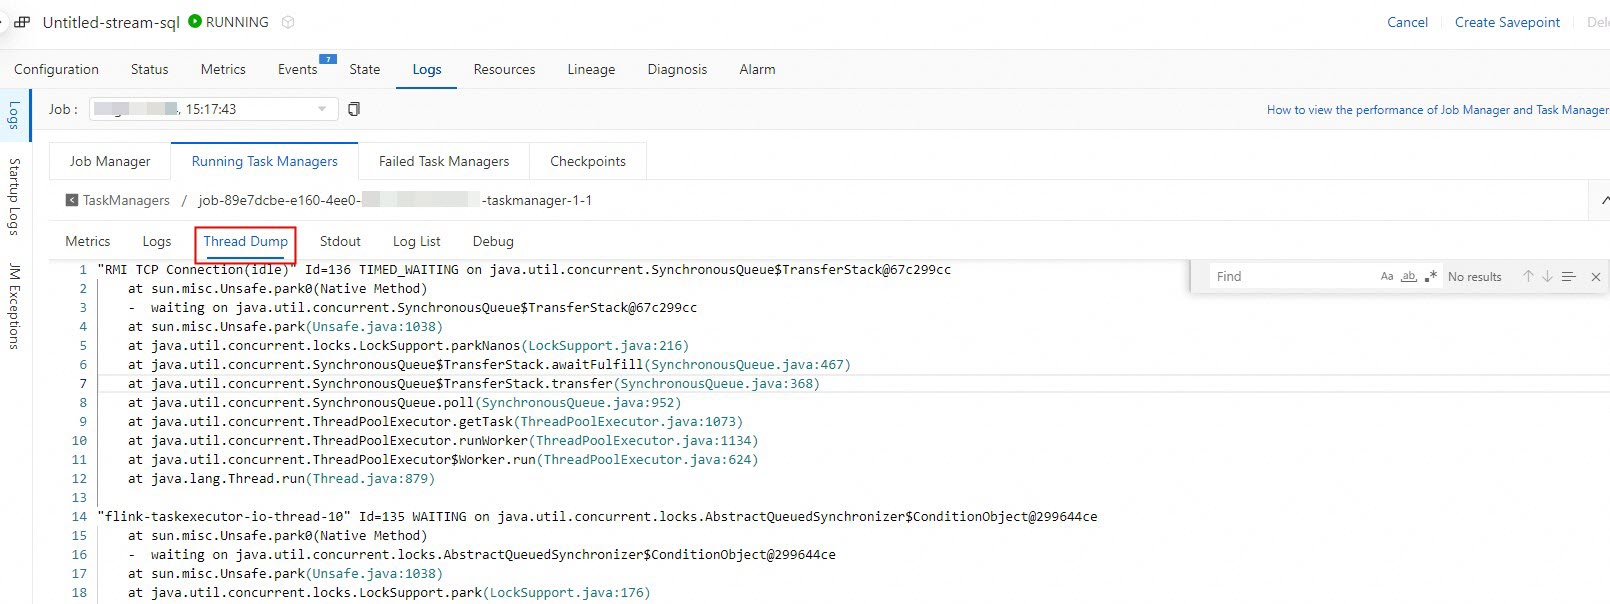
Thread Dump
A thread dump captures every thread's state at a single point in time. Use it to detect deadlocks, identify blocked threads, or verify state backend interactions.
Capture a thread dump
-
On the Logs tab, click the Running Task Managers tab, then click the value in the Path, ID column.
-
Click the Thread Dump tab.
-
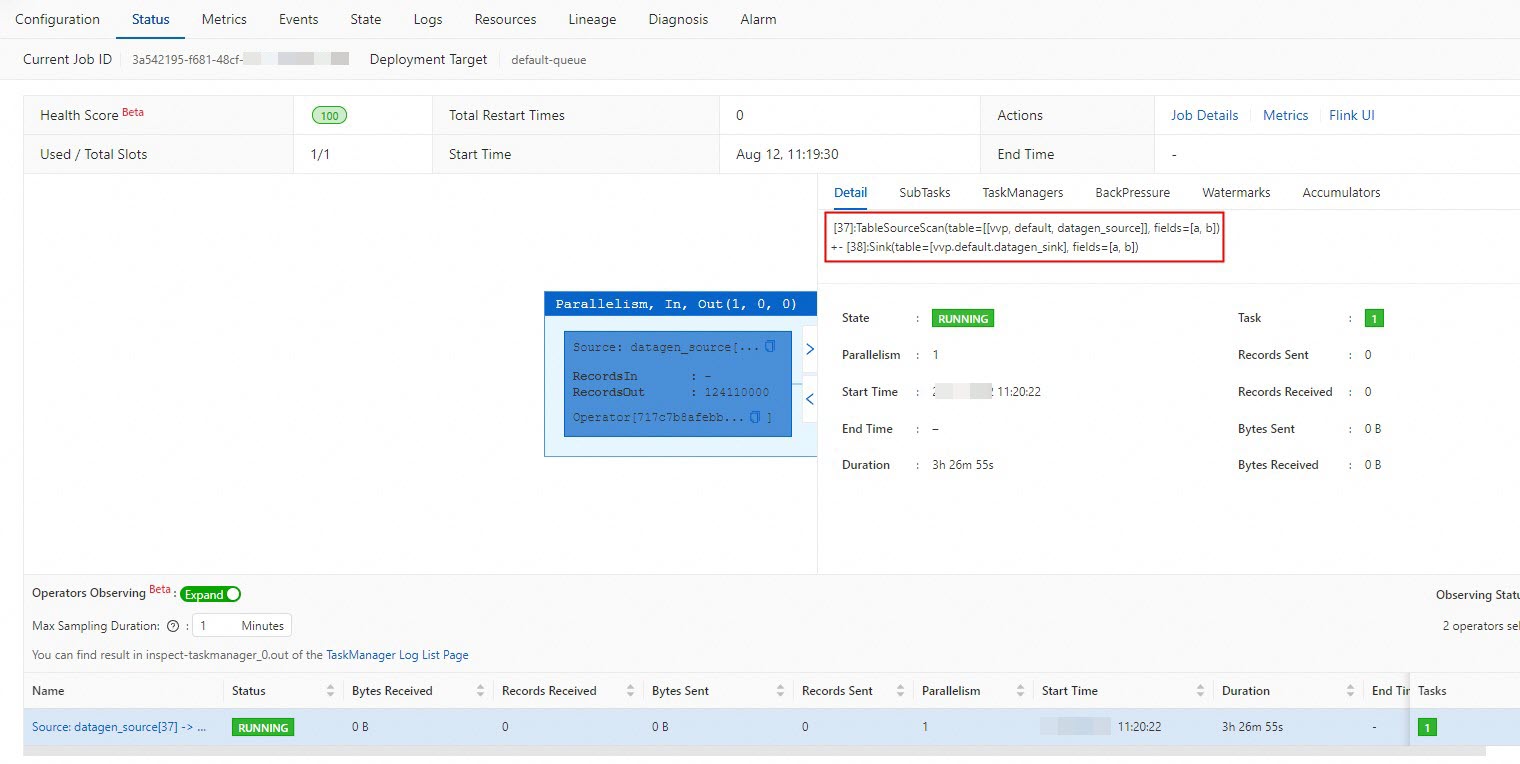
Search for the operator that processes state data. Check whether thread stacks under the operator show GeminiStateBackend or RocksDBStateBackend interactions.
Find the operator name on the Status tab.
References
-
Perform intelligent deployment diagnostics: Automatically detect deployment health and stability issues.
-
Optimize Flink SQL: Improve deployment performance through configuration tuning and Flink SQL optimization.