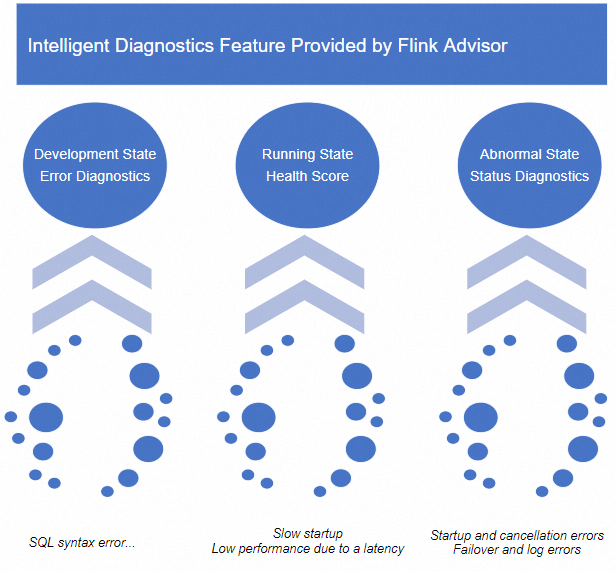
Flink Advisor diagnoses your Realtime Compute for Apache Flink deployments by analyzing logs, events, metrics, and configurations in real time. It monitors deployment health throughout the deployment lifecycle, detects exceptions and risks, and provides actionable optimization suggestions to reduce troubleshooting time and mean time to repair (MTTR).
Limitations
Only streaming deployments support intelligent deployment diagnostics. Batch deployments are not supported.
How it works
Flink Advisor evaluates your deployment's health status continuously. The health score starts at 100 and is deducted based on the number and severity of risks detected in the last 30 minutes.
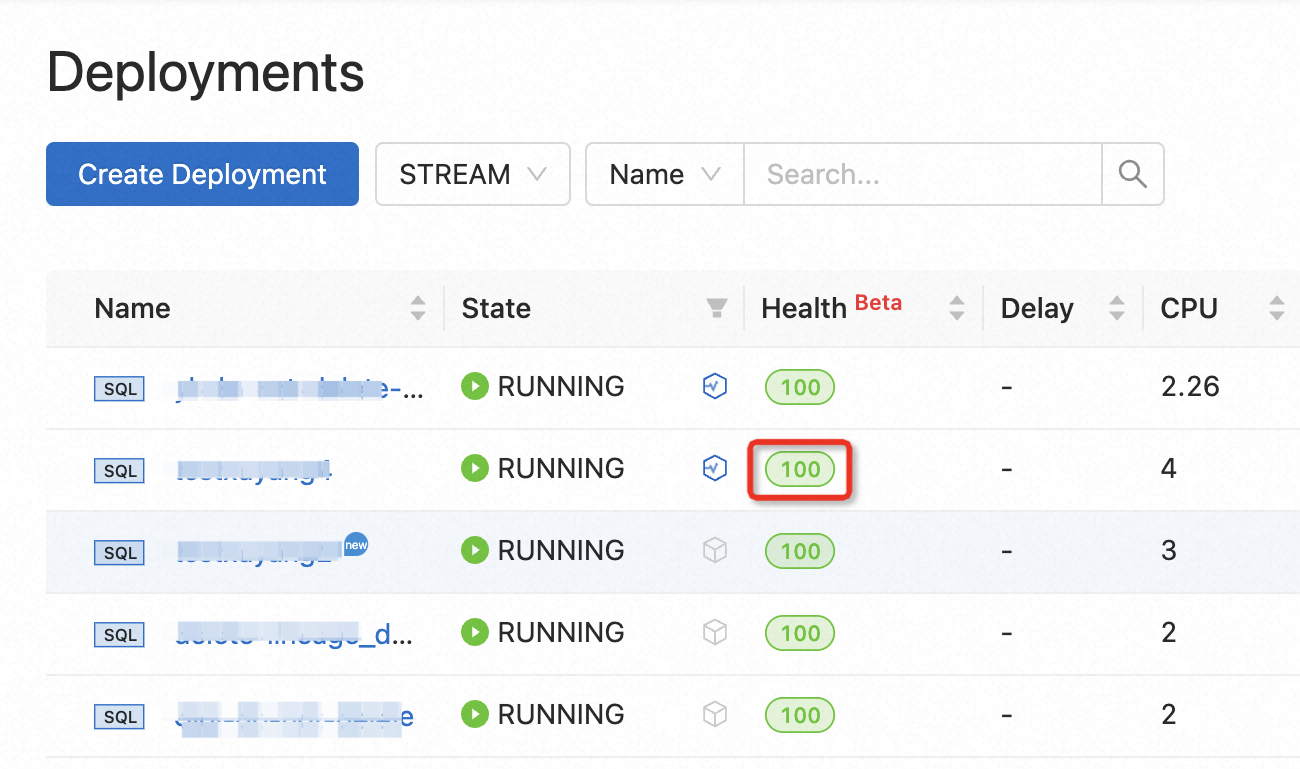
The score is displayed as a color-coded badge in the deployment list:
|
Color |
Score range |
Meaning |
|
Green |
Above 80 |
No potential risks. Configuration suggestions may be provided. |
|
Yellow |
60–80 |
Issues or potential risks detected. Review the deployment. |
|
Red |
Below 60 |
Serious issues detected. Act immediately to prevent deployment cancellation. |
Diagnose exception logs of a draft
Use this workflow to diagnose SQL errors before publishing a deployment.
-
Log on to the Realtime Compute for Apache Flink console. Find the workspace you want to manage and click Console in the Actions column.
-
In the left-side navigation pane, choose Development > ETL. Create a draft, write your SQL statements, and click Validate.
-
In the lower part of the SQL Editor page, review the error details, possible causes, and optimization suggestions.
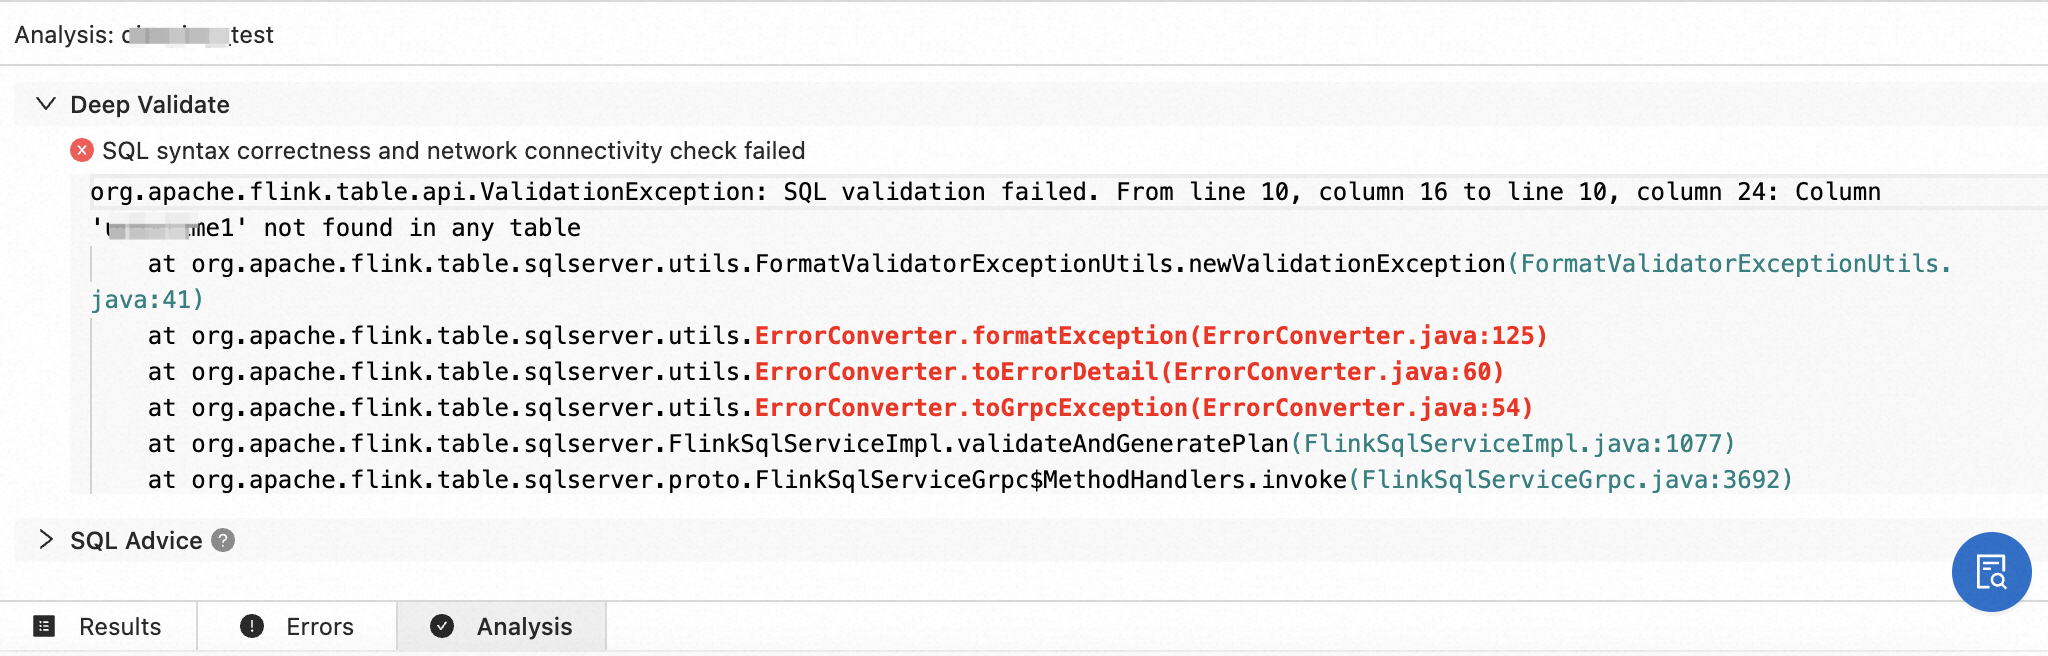
If you cannot identify the cause from the syntax check results, select the related logs and click Search in Documentation to find relevant information.
Diagnose exception logs of a deployment
Use this workflow to investigate log-level exceptions in a running or failed deployment.
-
Log on to the Realtime Compute for Apache Flink console. Find the workspace you want to manage and click Console in the Actions column.
-
In the left-side navigation pane, choose O&M > Deployments. Click the name of the deployment you want to investigate.
-
Click the Logs tab. In the left-side pane, click Logs, Startup Logs, or JM Exceptions to view the relevant logs.
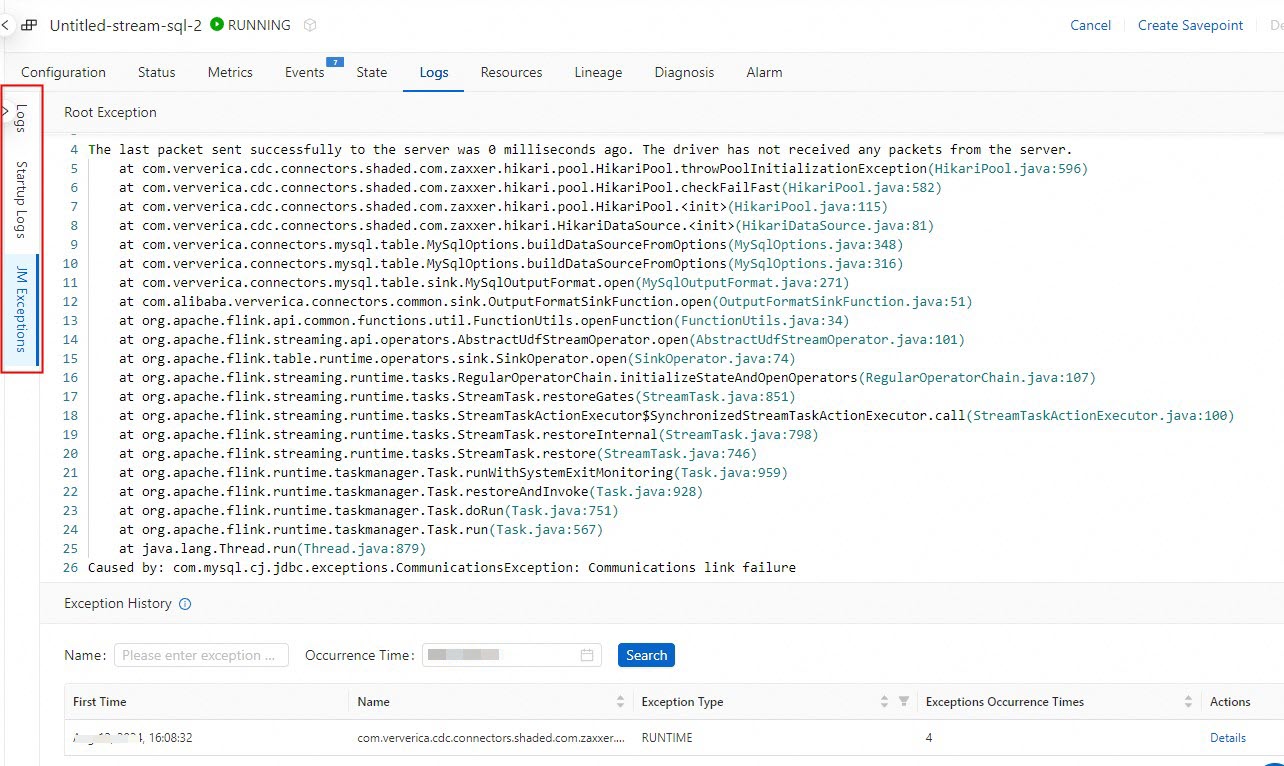
For more information about log types, see View the boot logs and operational logs of a deployment. To investigate exception logs, see View the exception logs of a deployment. To access historical records, see View the logs of a historical deployment.
Run intelligent diagnostics on an abnormal deployment
Use this workflow when a deployment is in an abnormal state and you need to identify the root cause.
-
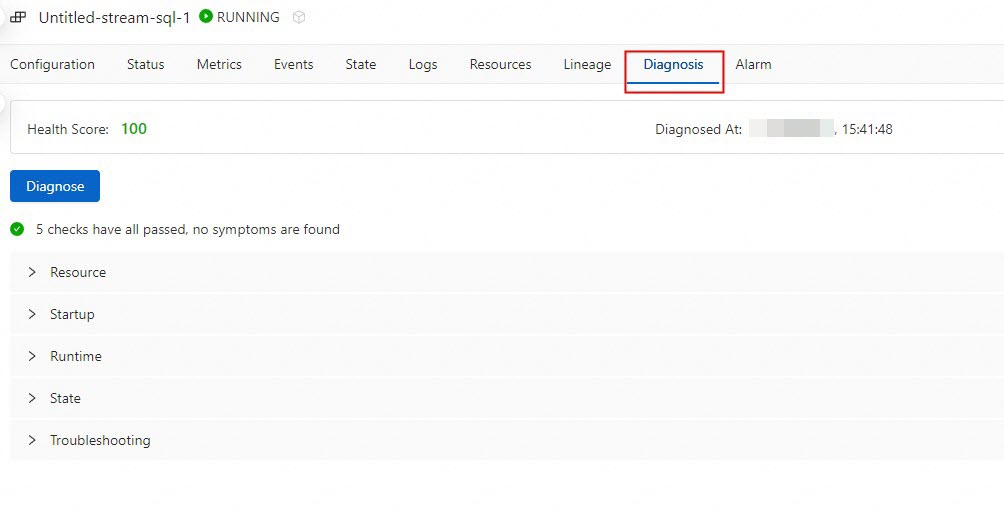
Navigate to the Diagnosis tab using one of these methods:
-
In the deployment list, find the deployment and click its score in the Health column.
-
Click the deployment name, then click the Diagnosis tab.
-
-
Click Diagnose. Flink Advisor provides a variety of log repositories for Flink exception logs. For the full list of diagnostic items and remediation steps, see Flink Advisor diagnostic items.
-
Review the diagnostic results and optimization suggestions. To apply a suggestion, click Apply next to it.
Flink Advisor diagnostic items
Diagnostic items fall into two categories:
-
Exception: The deployment execution is affected. Immediate action is required.
-
Risk: The deployment is currently running but a potential issue is detected. Address it proactively to prevent future failures.
|
Type |
Phase |
Diagnostic item |
Description |
|
Exception (deployment execution is affected) |
Startup |
Startup file analysis |
The required JAR package is missing from the Object Storage Service (OSS) directory. Re-upload the JAR package before starting the deployment. |
|
Startup |
Resource analysis |
Remaining available resources are insufficient. Reduce the resource configuration values for the deployment, or scale out the cluster. |
|
|
Startup |
Resource analysis |
The Container Network Interface (CNI) failed to bind to the deployment. Check whether the number of IP addresses of the related vSwitch has reached its upper limit. |
|
|
Startup |
Resource analysis |
The number of Elastic Network Interface (ENI) IP addresses exceeds the upper limit. Increase the number of ENIs and try again. |
|
|
Startup |
Topology network analysis |
No network connection is established between the TaskManager and JobManager. The deployment is abnormal. |
|
|
Startup |
Topology network analysis |
ENI binding to Elastic Compute Service (ECS) instances timed out within the previous 10 minutes. The deployment is starting at a low speed. Wait for the operation to complete. |
|
|
Startup |
Network analysis of upstream and downstream services |
TCP port detection is normal, but the upstream or downstream connector is not connected. Check the network configurations of the upstream and downstream services. |
|
|
Startup |
Permission detection of upstream and downstream services |
The upstream data source is not connected. Check the permission configuration of the upstream service. |
|
|
Startup |
Permission detection of upstream and downstream services |
The downstream data source is not connected. Check the permission configuration of the downstream service. |
|
|
Startup |
Startup speed analysis |
The JAR package is excessively large, causing a slow startup. Compress the JAR package and re-upload it, or wait for the startup to complete. |
|
|
Startup |
JobGraph check |
The configuration file from an earlier version of Realtime Compute for Apache Flink may be missing. The deployment may not recover after a failover. Manually cancel and restart the deployment. |
|
|
Startup |
Session cluster check |
A session cluster from an earlier version of Realtime Compute for Apache Flink may be abnormal, causing the deployment to be abnormal. |
|
|
Run icon |
High availability (HA) status check |
HA is not enabled. The deployment cannot recover after a failure. Publish the draft again, then manually cancel and restart the deployment. |
|
|
Run icon |
Checkpoint check |
The checkpoint feature from an earlier version of Realtime Compute for Apache Flink may be abnormal, which can cause checkpointing to fail. |
|
|
Run icon |
Permission detection of upstream and downstream services |
TCP port detection is normal, but the upstream or downstream connector is not connected. Check the permission configurations of the upstream and downstream services. |
|
|
Run icon |
Running status check |
An out-of-memory (OOM) error occurred in a TaskManager. Check the deployment configuration and increase the TaskManager memory. |
|
|
Cancellation |
Cancellation speed analysis |
Cancellation is slow in an earlier version of Realtime Compute for Apache Flink. Manually cancel and restart the deployment. |
|
|
Risk (deployment execution is not affected) |
Configurations |
JobGraph check |
The deployment is running normally. However, the configuration file from an earlier version may be missing. The deployment may not recover after a failure. Manually cancel and restart the deployment. |
|
Configurations |
HA status check |
The deployment is running normally. However, HA is not enabled. The deployment may not recover after a failure. Publish the draft again, then manually cancel and restart the deployment. |
|
|
Configurations |
Version check |
The deployment is running normally. However, a major defect is detected in the current version of Realtime Compute for Apache Flink. |
|
|
Run icon |
Checkpoint check |
The deployment is running normally. However, a checkpoint exception in an earlier version of Realtime Compute for Apache Flink may cause a potential stability issue. |
|
|
Run icon |
Checkpoint check |
The deployment is running normally. However, no checkpoint has been created for an extended period of time. |
|
|
Run icon |
Cancellation speed analysis |
The deployment is running normally. However, a risk is detected that may cause slow cancellation in an earlier version of Realtime Compute for Apache Flink. Manually cancel and restart the deployment. |
|
|
Run icon |
Runtime environment analysis |
The deployment failed over due to an exception on the host machine. The deployment can be automatically restored after the failover. No action is required. |
|
|
Run icon |
Runtime environment analysis |
A machine upgrade may cause the deployment to fail over within a few minutes. The deployment can be automatically restored after the failover. To prevent this, manually cancel and restart the deployment before the machine upgrade. |
|
|
Run icon |
Runtime environment analysis |
A hardware failure occurred on the host machine. The deployment failed over. Manually cancel and restart the deployment. |
|
|
Run icon |
Version check |
The version is at End of Service (EOS). Stability issues may occur, or product support may no longer be available. For more information, see Console operations. |
What's next
-
Monitor JobManager and TaskManager performance metrics for running deployments. For more information, see Monitor deployment performance.
-
Configure automatic tuning to let the system reconfigure resources automatically or on a schedule. For more information, see Enable automatic performance tuning.
-
Optimize Flink SQL deployments by tuning deployment configurations and SQL logic. For more information, see Optimize Flink SQL.