Autonomy Service provides real-time and historical TOP SQL, allowing you to analyze detailed performance overhead at the SQL statement level.
Prerequisites
-
This feature is not available for ApsaraDB RDS for SQL Server 2008 R2 instances that use cloud disks.
-
This feature is available only for ApsaraDB RDS for SQL Server instances in the following regions: China (Hangzhou), China (Shanghai), China (Qingdao), China (Beijing), China (Zhangjiakou), China (Hohhot), China (Ulanqab), China (Shenzhen), China (Heyuan), China (Guangzhou), China (Chengdu), China (Hong Kong), Singapore, or UAE (Dubai).
Procedure
Log on to the ApsaraDB RDS console and go to the Instances page. In the top navigation bar, select the region in which the RDS instance resides. Then, find the RDS instance and click the instance ID.
-
In the left-side navigation pane, choose .
-
Click the TOP SQL tab:
-
Query real-time TOP SQL
On the right side of the page, configure the display options and turn on the Auto-refresh switch.
Note-
Real-time TOP SQL data comes from an in-memory cache created after the instance starts. The cache updates automatically when SQL statements are executed. You can view the Last Executed At time for a statement in the Real-time Top SQL Statements - List section.
-
In the Real-time Top SQL Statements - List section, you can click an entry in the Statement or SQL Text column to Copy its content.
You can specify options such as the data retrieval interval (for example, every 10 seconds) and click Get, select a metric to sort by (for example, average CPU overhead), and set the number of results to display (for example, TOP 10).
-
-
Query historical TOP SQL
You can use SQL Explorer and Audit to view historical TOP SQL for the instance.
-
UI reference
-
TOP SQL overview: Displays the last time the page data was updated and provides controls for the entire page.
-
Real-time TOP SQL - average overhead: Ranks SQL statements by resource consumption per execution. Use this view to find inefficient queries.
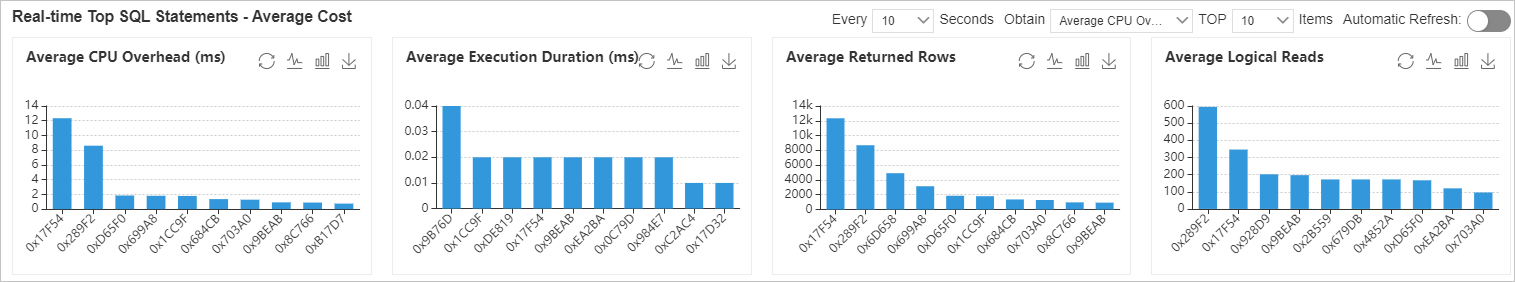
Table 1. Parameters for real-time TOP SQL - average overhead Parameter
Description
average CPU overhead
The average CPU time consumed per execution. Unit: milliseconds (ms).
average execution duration
The average time elapsed per execution. Unit: milliseconds (ms).
average returned rows
The average number of rows returned per execution.
average logical reads
The average number of logical read operations per execution.
average physical reads
The average number of physical read operations per execution.
average logical writes
The average number of logical write operations per execution.
-
Real-time TOP SQL - total overhead: Ranks SQL statements by cumulative resource consumption. Use this view to find frequently executed or long-running queries that create the highest overall load.
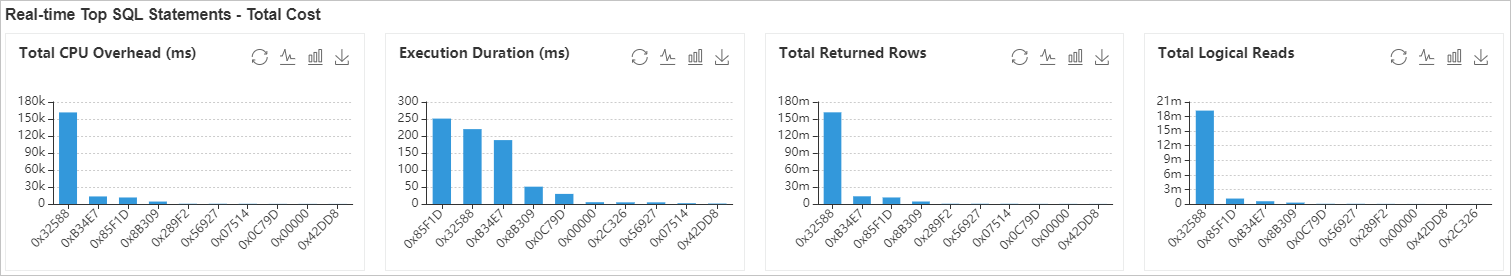
Table 2. Parameters for real-time TOP SQL - total overhead Parameter
Description
total CPU overhead
The total CPU time consumed across all executions. Unit: milliseconds (ms).
total execution duration
The total time elapsed across all executions. Unit: milliseconds (ms).
total returned rows
The total number of rows returned across all executions.
total logical reads
The total number of logical read operations across all executions.
total physical reads
The total number of physical read operations across all executions.
total executions
The total number of times the SQL statement was executed.
-
Real-time TOP SQL - list: Displays a detailed list of real-time TOP SQL statements and their metrics.
Table 3. Parameters for real-time TOP SQL - list Parameter
Description
Database
The name of the database where the statement was executed.
Statement
The SQL statement that was executed. Click to view the full statement.
SQL block
The text of the SQL block. Click to view the full text.
Executions
The total number of executions.
Total CPU time
The total CPU time consumed.
Average CPU time
The average CPU time consumed per execution.
Execution duration
The total time elapsed across all executions.
Average execution duration
The average time elapsed per execution.
Total returned rows
The total number of rows returned.
Average returned rows
The average number of rows returned per execution.
Total logical reads
The total number of logical read operations.
Average logical reads
The average number of logical read operations per execution.
Total physical reads
The total number of physical read operations.
Average physical reads
The average number of physical read operations per execution.
Total logical writes
The total number of logical write operations.
Average logical writes
The average number of logical write operations per execution.
Last executed at
The most recent time the statement was executed.