Up-to-date statistics are crucial for efficient system performance. Autonomy Services provides features to query statistics, view histograms, and update statistics.
Prerequisites
-
This feature is not available for ApsaraDB RDS for SQL Server 2008 R2 instances that use cloud disks.
-
This feature is available only for ApsaraDB RDS for SQL Server instances in the following regions: China (Hangzhou), China (Shanghai), China (Qingdao), China (Beijing), China (Zhangjiakou), China (Hohhot), China (Ulanqab), China (Shenzhen), China (Heyuan), China (Guangzhou), China (Chengdu), China (Hong Kong), Singapore, or UAE (Dubai).
Procedure
Log on to the ApsaraDB RDS console and go to the Instances page. In the top navigation bar, select the region in which the RDS instance resides. Then, find the RDS instance and click the instance ID.
In the left-side navigation pane, choose .
Click the Statistics tab.
Overview
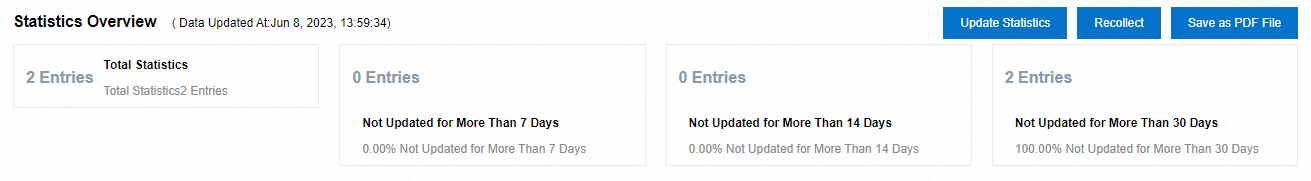
Statistics Overview: This section provides an overview of the statistics for the RDS instance. For more information, see the following table.
Table 1. Statistics overview parameters
Parameter
Description
Total statistics
The total number of statistics objects in the instance.
Not updated for more than 7 days
The number of statistics objects that have not been updated for more than 7 days.
Not updated for more than 14 days
The number of statistics objects that have not been updated for more than 14 days.
Not updated for more than 30 days
The number of statistics objects that have not been updated for more than 30 days.
Data updated at
The time when the data on this page was generated.
Recollect
If you find that the Data updated at time is outdated, click Recollect and confirm the action. The system then asynchronously recollects the data.
NoteData recollection is an asynchronous process. You may need to wait a few minutes and then refresh the page to view the updated results.
Save PDF
To save the page as a local file, click Save PDF and wait for the PDF to be generated.
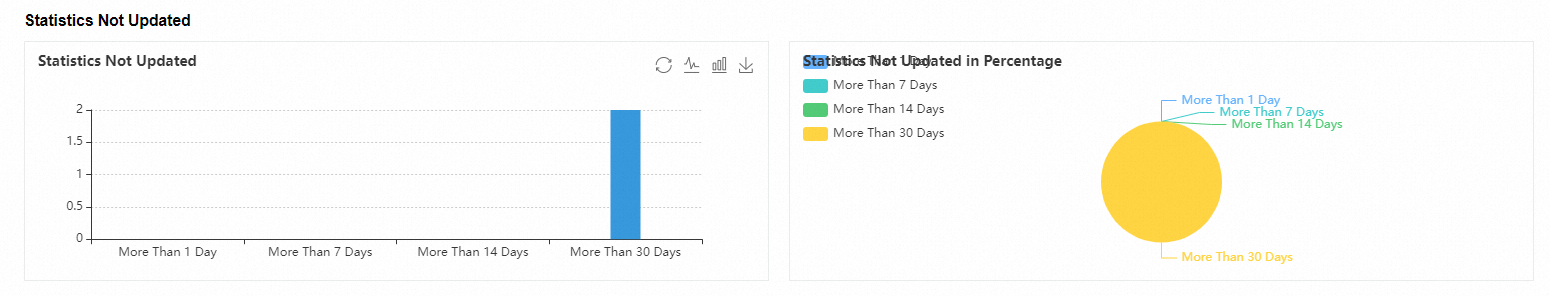
Statistics Not Updated: This section uses charts to display the number of outdated statistics objects in the instance. For more information, see the following table.
Table 2. Statistics not updated parameters
Parameter
Description
Statistics not updated
A bar chart that shows the number of statistics objects that have not been updated for more than one day, one week, two weeks, or one month.
For example, the screenshot shows that all statistics are more than a month out of date, indicating that you should update them for your RDS instance.
Percentage of outdated statistics
A pie chart that shows the percentage breakdown of statistics objects that have not been updated for more than one day, one week, two weeks, or one month.
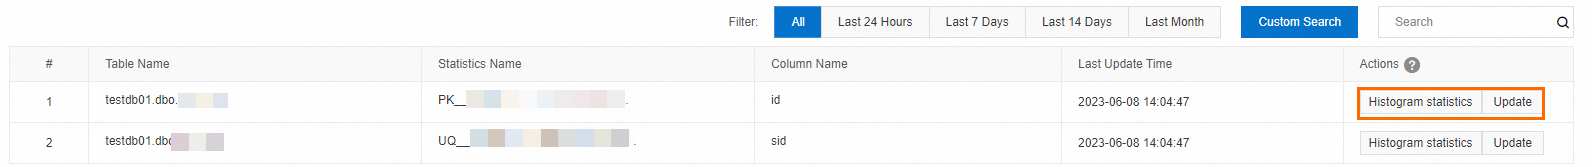
Statistics table: This table lists the details of all statistics objects in the instance. For more information, see the following table.
Table 3. Statistics table parameters
Parameter
Description
Table name
The name of the table, which consists of three parts:
Database name
Schema name
Object name
Statistics name
The name of the statistics object.
Column name
The name of the column that the statistics object is associated with.
Last update time
The time when the statistics were last updated. If the statistics have not been updated for a long time (for example, more than 14 days), you should manually update them by using the Update action.
Actions
The following actions are available:
Histogram: View the histogram to understand data distribution.
Update: Updates the statistics for this object.
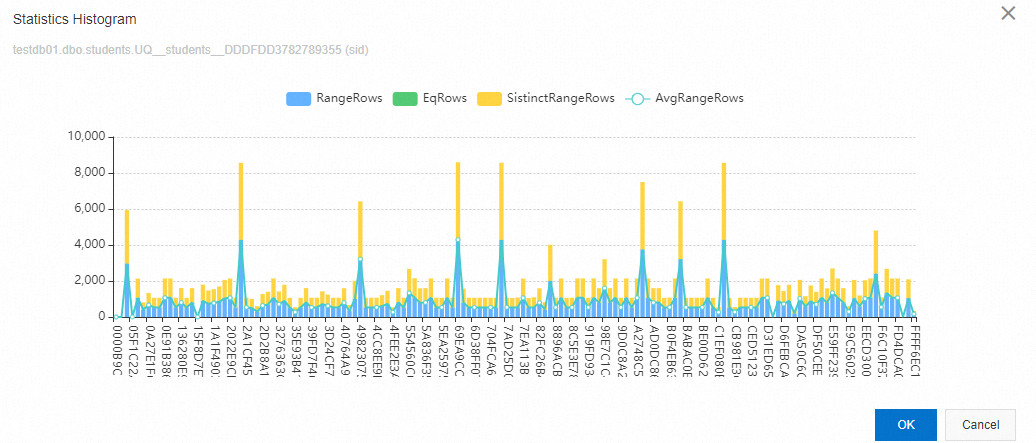
For example, this histogram shows that:
The statistics for the UQ__students__DDDFDD3782789355 index on the sid column of the testdb01.dbo.students table are unevenly distributed. The Avg_RangeRows metric fluctuates significantly, which might indicate data skew. To resolve this, simply click Update in the Actions column.