Database Autonomy Service (DAS) lets you query the usage and fragmentation of indexes on your tables.
Prerequisites
-
This feature is not available for ApsaraDB RDS for SQL Server 2008 R2 instances that use cloud disks.
-
This feature is available only for ApsaraDB RDS for SQL Server instances in the following regions: China (Hangzhou), China (Shanghai), China (Qingdao), China (Beijing), China (Zhangjiakou), China (Hohhot), China (Ulanqab), China (Shenzhen), China (Heyuan), China (Guangzhou), China (Chengdu), China (Hong Kong), Singapore, or UAE (Dubai).
Procedure
Log on to the ApsaraDB RDS console and go to the Instances page. In the top navigation bar, select the region in which the RDS instance resides. Then, find the RDS instance and click the instance ID.
-
In the navigation pane on the left, choose .
-
Click the Index Usage tab.
UI reference
-
Index overview
Table 1. Index overview parameters
Parameter
Description
Total indexes
The total number of indexes on the instance.
Total index space
The total storage space used by all indexes on the instance.
Index fragmentation > 30%
The total number of indexes on the instance with a fragmentation rate greater than 30%.
Index seeks < 100
The total number of indexes on the instance with fewer than 100 user index seeks.
Data updated at
The time when the data on the Index Usage page was generated.
Recollect
If the data under Data Updated At is outdated, click Recollect and confirm to start a background task to recollect the data.
NoteData collection is asynchronous. Wait a few minutes and then refresh the page to view the latest results.
Save as PDF
Click Save as PDF to download the current page as a PDF file.
Each statistics card also displays a secondary metric. The Total Indexes card shows the number of indexes created in the last week. The Total Index Space card shows the total number of pages. The Index Fragmentation > 30% card shows the number of indexes whose statistics have not been updated for seven days. The Index Seeks < 100 card shows the number of indexes with a seek percentage of less than 10%.
-
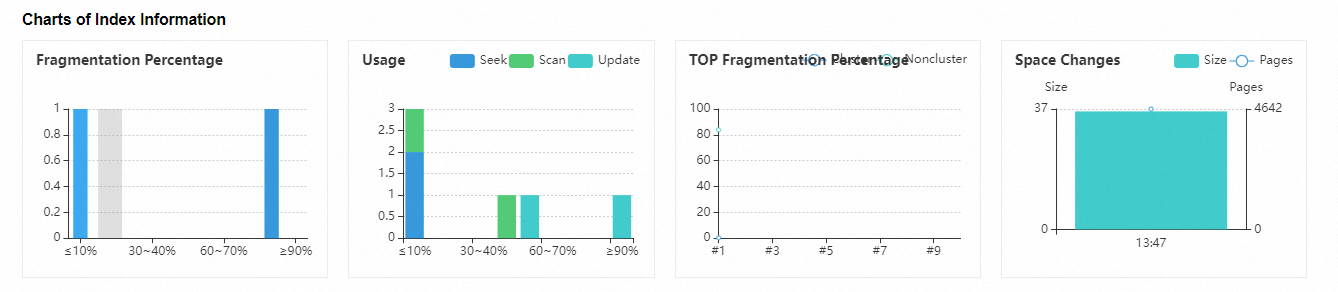
Index usage charts
This section provides charts that visualize the index usage on the instance. The following table describes the parameters.
Table 2. Index usage chart parameters
Parameter
Description
Fragmentation rate
The statistical distribution of the fragmentation rates of all indexes on the instance.
Usage
The statistical distribution of the usage rates of all indexes on the instance.
Space trend
The storage space trend for all indexes on the instance.
Top fragmentation rate
The top 10 clustered and nonclustered indexes with the highest fragmentation rates.
-
Index details
Table 3. Index details parameters
Parameter
Description
Table Name
The name of the table, which consists of the database name, schema name, and object name.
Index name
The name of the index.
Fragmentation rate
The fragmentation rate of the index.
Size (MB)
The storage space the index occupies, in megabytes (MB).
Maintenance operation
The recommended maintenance operation.
Reason
The reason for the recommended maintenance operation.
Priority
The priority of the recommended maintenance operation.
Pages
The number of pages that the index occupies.
Seeks
The number and percentage of index seek operations.
Scans
The number and percentage of index scan operations.
Key lookups
The number and percentage of key lookup operations.
Update
The number and percentage of update operations.
Primary key
Indicates whether the index is a primary key.
Disable
Indicates whether the index is disabled.
List
The columns included in the index.
Fill factor
The fill factor of the index.
Created At
The time when the index was created.
Statistics update time
The time the index statistics were last updated.
Export script
Exports the creation script for the index.
Export File
Exports the index usage data as an Excel, CSV, or TXT file.