The DeadLock tab in ApsaraDB RDS for SQL Server shows deadlock events for your instance, including the transaction start time, session IDs, locked resources, and deadlock types. Use this information to identify and fix the SQL statements and transactions that cause deadlocks.
How it works
When a transaction modifies a resource, SQL Server locks that resource to block concurrent modifications and preserve data consistency.
A deadlock occurs when two transactions each hold a lock the other needs. For example, Transaction A locks Resource A and waits for Resource B, while Transaction B locks Resource B and waits for Resource A. Neither transaction can proceed, so SQL Server terminates one of them.
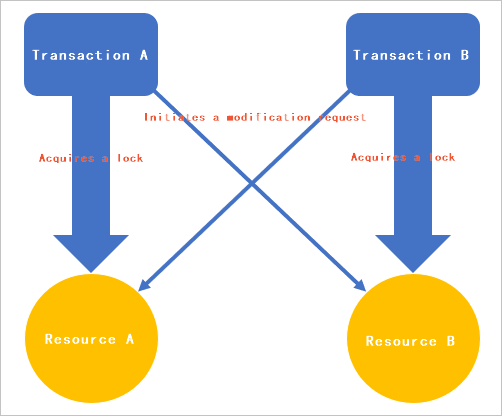
SQL Server selects the session to terminate based on rollback cost: it terminates the session whose transaction can be rolled back at the lowest cost, called the deadlock victim. For example, if a deadlock occurs between a SELECT session and an UPDATE session, SQL Server terminates the SELECT session because it is cheaper to roll back.
Key concepts
Deadlock types
ApsaraDB RDS for SQL Server detects the following deadlock types:
KeyDeadlock
ObjectDeadLock
RIDDeadlock
PageDeadlock
ComplieDeadlock
For details on each type, see Lock granularity and hierarchies.
Lock modes
The lock mode applied to a resource depends on the type of access:
Shared (S): The resource can be read but not modified until the transaction releases the shared lock.
Update (U): Another transaction cannot modify the resource until it acquires an exclusive lock on the resource.
Exclusive (X): No other transaction can access the resource until the locking transaction releases the exclusive lock.
Prerequisites
Before you begin, ensure that:
Your RDS instance does not run SQL Server 2008 R2 with cloud disks
Your RDS instance resides in one of the following regions: China (Hangzhou), China (Shanghai), China (Qingdao), China (Beijing), China (Zhangjiakou), China (Hohhot), China (Ulanqab), China (Shenzhen), China (Heyuan), China (Guangzhou), China (Chengdu), China (Hong Kong), Singapore, or UAE (Dubai)
View deadlock details
Go to the Instances page. In the top navigation bar, select the region where your RDS instance resides, then click the instance ID.
In the left-side navigation pane, choose Autonomy Services > Lock Optimization.
DeadLock tab reference
Numbers of deadlocks
Displays the number of deadlocks over recent time ranges. Specify a time range to filter the results.

Deadlock trend
Displays the distribution of deadlock types over a time range.
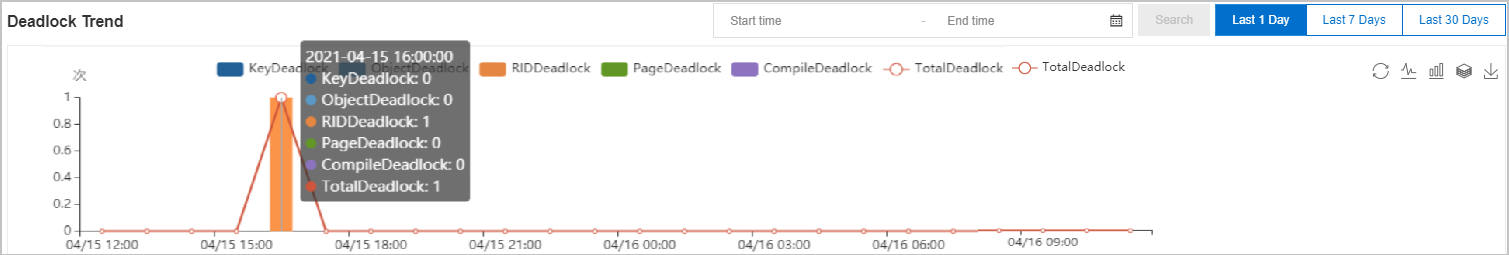
Set a start time and end time, then click Search. The time range cannot exceed 30 days.
Click Last 24 Hours, Last 7 Days, or Last Month to use a preset range.
Hover over a data point to see the deadlock types and counts at that time.
Use the icons
 in the upper-right corner of the chart to change the display style or download the chart as an image.
Deadlock details
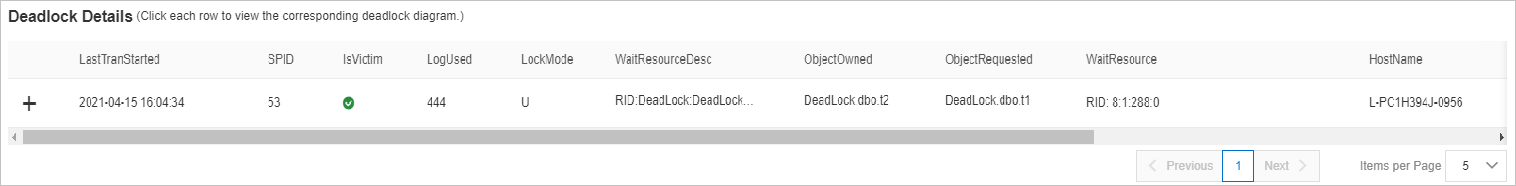
Click the ![]() icon next to a deadlock record to expand the blocking and blocked session details.
icon next to a deadlock record to expand the blocking and blocked session details.
| Field | Description |
|---|---|
| LastTranStarted | Time when the transaction started in the session |
| SPID | Session ID |
| IsVictim | Whether the session was terminated as the deadlock victim |
| LogUsed | Size of transaction log generated in the session, in bytes |
| LockMode | Lock mode held by the session |
| WaitResourceDesc | Details of the resource the transaction is waiting for |
| ObjectOwned | Object locked by the session |
| ObjectRequested | Object the transaction is attempting to lock |
| WaitResource | Name of the resource the transaction is waiting for |
| HostName | Host where the transaction is running |
| LoginName | Account used to run the transaction |
| Status | Status of the transaction in the session |
| ClientApp | Client that initiated the transaction |
| SQLText | SQL statement executed in the session. Click the statement to copy it for further analysis. |
Click a deadlock record to open the Deadlock Diagram section.
Deadlock diagram
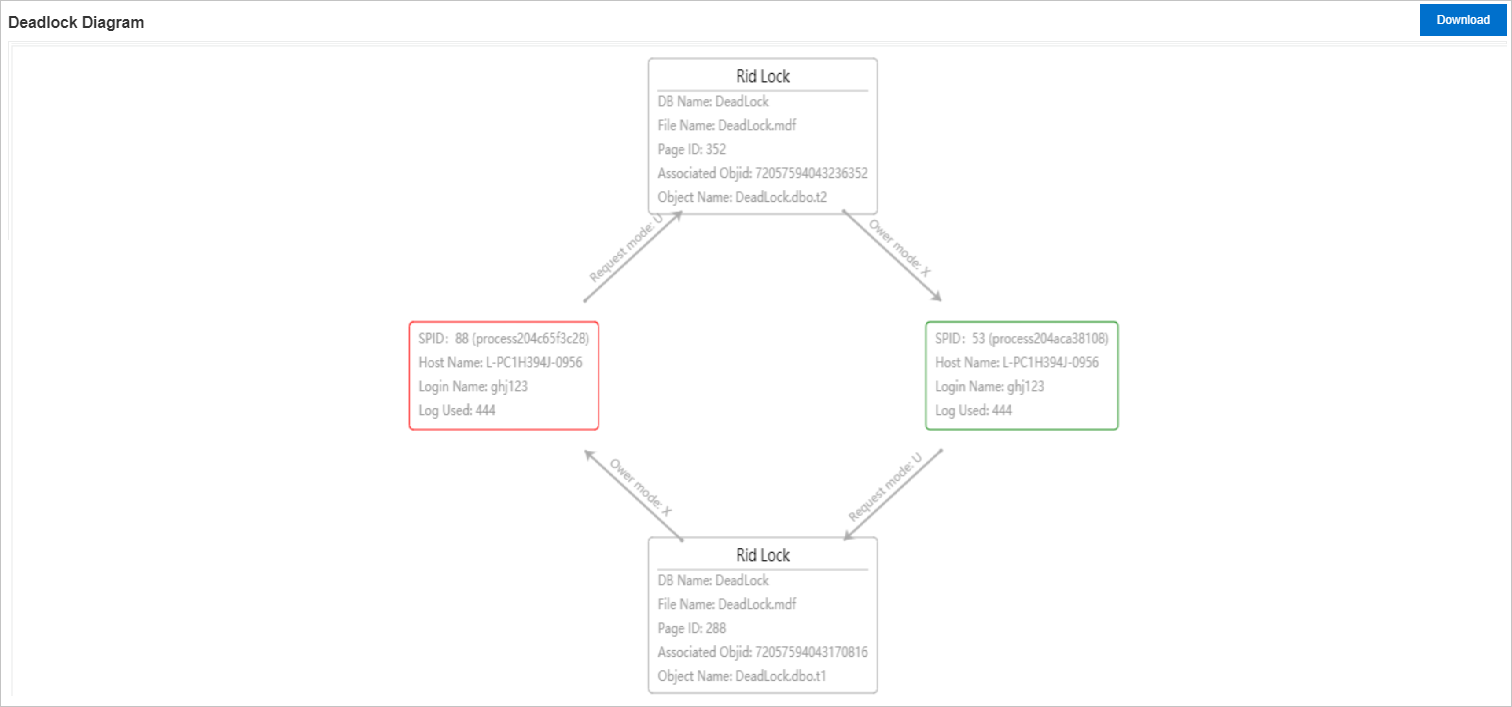
Displays the relationships between the blocking and blocked sessions, along with details about the locked resources. Click Download to download the XDL file, then open it in SQL Server Management Studio (SSMS) to view the full deadlock graph.
What's next
What do I do if a deadlock occurs on an ApsaraDB RDS for SQL Server instance?