The Performance Events tab tracks issues across their full lifecycle — from detection, through active remediation, to resolution. Each event falls into one of three states: planned, in progress, or complete. Use this page to check instance health, identify active problems, and review past events with their suggested fixes.
Events are grouped into three categories:
Exceptions
Optimization events
Auto scaling events
Prerequisites
Before you begin, ensure that you have:
An ApsaraDB RDS for SQL Server instance
Access to the RDS console
View events and suggestions
This view shows historical event statistics for exceptions and optimization events, along with system recommendations.
Go to the Instances page. In the top navigation bar, select the region where your instance resides, then click the instance ID.
In the left-side navigation pane, click Monitoring and Alerts.
On the Performance Events tab, click Events and Suggestions.
Set a time range, then review the event statistics.
The end time must be later than the start time, and the time range cannot exceed seven days.
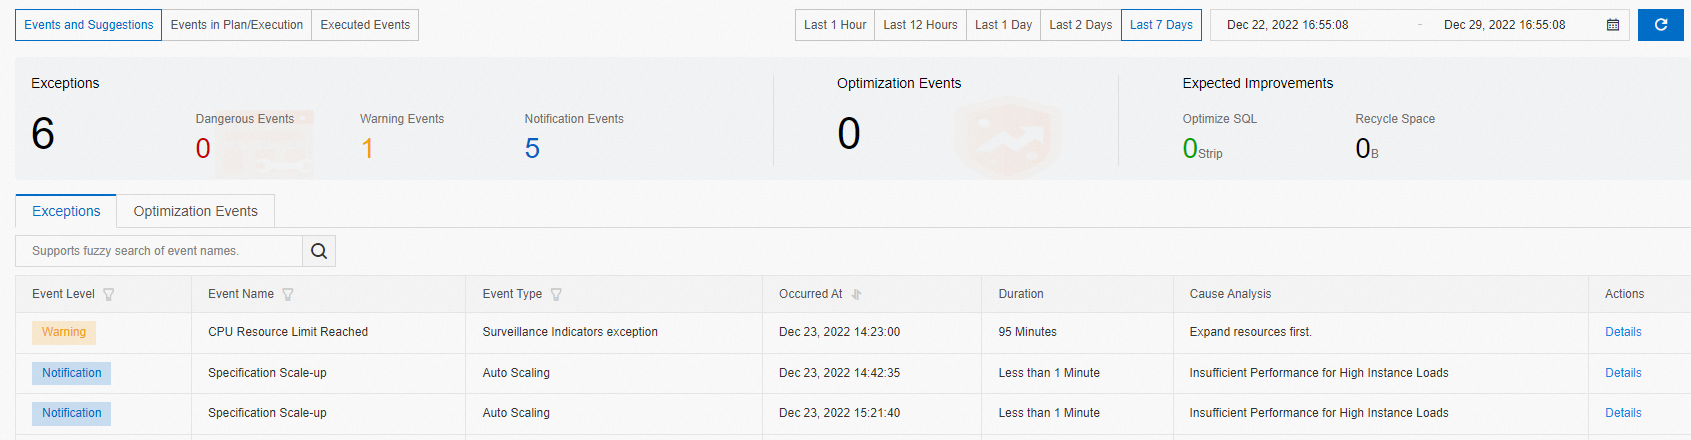
Click the Exceptions tab or the Optimization Events tab to switch between categories.
Filter events by Event Level, Event Name, or Event Type as needed.
To see full event details, click Details in the Actions column.
View events in progress or scheduled
This view shows events that are currently running or queued for execution.
Go to the Instances page. In the top navigation bar, select the region where your instance resides, then click the instance ID.
In the left-side navigation pane, click Monitoring and Alerts.
On the Performance Events tab, click Events in Plan/Execution.
Filter events by Event Level as needed.
To see full event details, click Details in the Actions column.
View completed events
This view shows events that have finished executing, along with their outcomes.
Go to the Instances page. In the top navigation bar, select the region where your instance resides, then click the instance ID.
In the left-side navigation pane, click Monitoring and Alerts.
On the Performance Events tab, click Executed Events.
Set a time range, then review the execution results.
The end time must be later than the start time, and the time range cannot exceed seven days.
Filter events by Event Level as needed.
To see full event details, click Details in the Actions column.