High I/O throughput on an instance can degrade query performance. This topic describes how to view I/O throughput and troubleshoot high I/O issues.
Background
I/O performance is primarily measured by IOPS and I/O throughput. IOPS rarely becomes a performance bottleneck. However, I/O throughput can cause a bottleneck when it reaches its upper limit.
I/O throughput limits
-
Instances that use Premium Local SSDs
Instances that use Premium Local SSDs share the local SSDs of the same physical host. Only the maximum IOPS of a single instance is limited, while the I/O throughput is not. As a result, the I/O throughput of a single instance can exceed 1 GB/s. However, this shared architecture can lead to I/O resource contention. For dedicated I/O resources, select dedicated host instance types.
-
Instances that use cloud disks
Instances that use cloud disks have dedicated and isolated I/O resources because each instance has its own attached cloud disk. The upper limit of I/O throughput for a single instance depends on the following two factors:
-
Instance specifications: The computing specifications for ApsaraDB RDS for SQL Server instances that use cloud disks are primarily based on ECS g6-generation instance families, and their I/O throughput is subject to the limits of the corresponding specifications.
-
Storage type and capacity: ApsaraDB RDS for SQL Server instances that use cloud disks support storage types including standard SSDs, ESSD. Their I/O throughput is limited by the corresponding storage type and capacity.
-
View I/O throughput
This feature is not available for ApsaraDB RDS for SQL Server 2008 R2 instances that use cloud disks.
Go to the Instances page. In the top navigation bar, select the region in which the RDS instance resides. Then, find the RDS instance and click the ID of the instance.
-
In the left-side navigation pane, choose Autonomy Services > Performance Optimization, and then click the Performance Insight tab.
-
In the upper-right corner, click Custom metric, select the performance metrics related to I/O Throughput, and then click OK.
NoteThe I/O Throughput category includes the following performance metrics:
-
IO_Throughput_Read_Kb: The read I/O throughput of the disk, in KB/s.
-
IO_Throughput_Write_kb: The write I/O throughput of the disk, in KB/s.
-
IO_Throughput_Total_Kb: The sum of read and write I/O throughput of the disk, in KB/s.
-
I/O throughput analysis and optimization
The I/O load on an ApsaraDB RDS for SQL Server instance mainly consists of read requests for data files and read/write requests for transaction log files. Read requests for data files primarily come from data page reads during queries and database backups. Transaction log files experience a high read I/O load during backups and primarily a write I/O load in other situations.
If you observe high I/O throughput on your instance, you can add the following performance metrics in the Custom metric panel to analyze which type of load is causing the increase.
|
Metric |
Type |
Description |
|
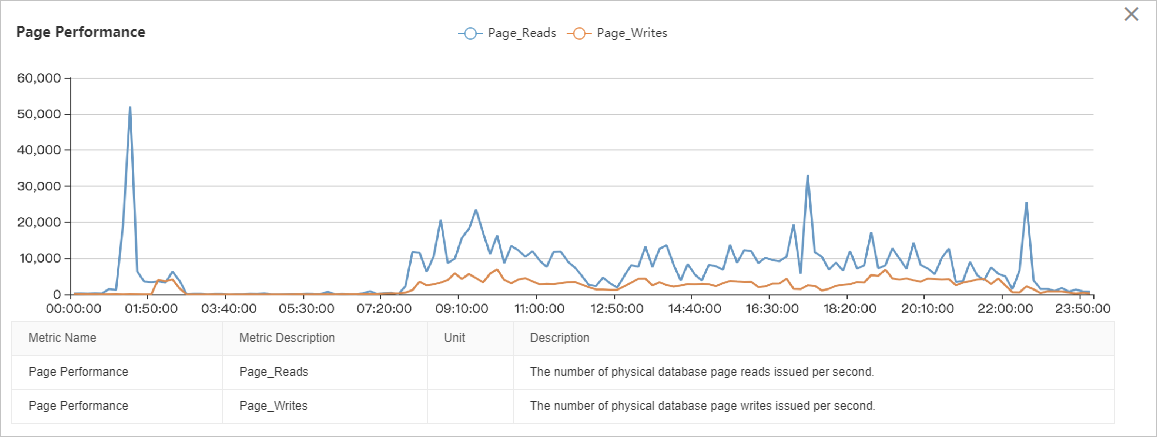
Page_Reads |
Read |
The number of data pages read from data files per second due to a cache miss. |
|
Page_Write |
Write |
The number of data pages written to data files per second. |
|
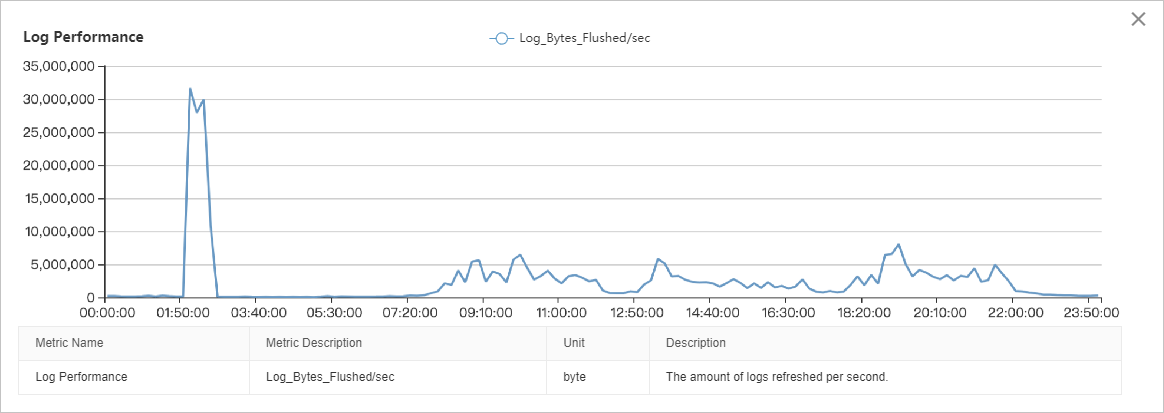
Log_Bytes_Flushed/sec |
Write |
The number of bytes written to log files per second. |
|
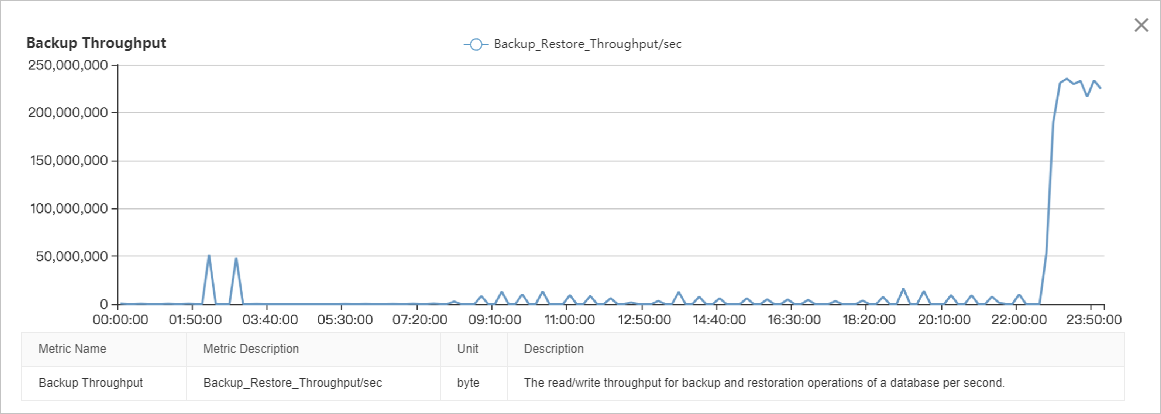
Backup_Restore_Throughput/sec |
Read |
The number of bytes read from and written to data and log files per second during backup or restore operations. |
Each data page is 8 KB in size.
Case study
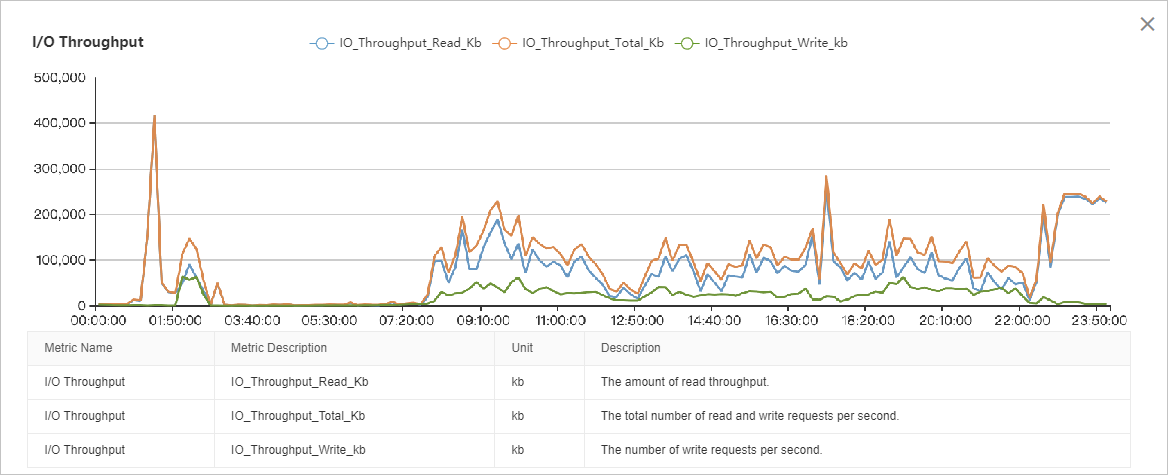
The I/O throughput chart shows that read I/O is significantly higher than write I/O. The I/O load is relatively stable from 08:00 to 22:00, with two distinct peaks: one from 01:00 to 03:00 and another from 22:00 to 00:00. A detailed analysis requires correlating this data with other performance metrics.
-
The page performance metrics show that the I/O throughput spike around 01:00 is caused by data page reads, peaking at approximately 50,000 pages per second, which is equivalent to 400 MB/s.
-
Page, log, and backup throughput metrics show that the I/O peak between 02:00 and 03:00 is a combination of data page reads (peak at ~40 MB/s), data page writes (peak at ~40 MB/s), log file writes (peak at ~30 MB/s), and log backups (peak at ~50 MB/s). The cumulative I/O throughput peaks at approximately 150 MB/s.
-
Page and log performance metrics show that the I/O throughput between 08:00 and 22:00 is mostly composed of data page reads (~80-100 MB/s), followed by data page writes (~30 MB/s), and log file writes (~5 MB/s).
-
The backup throughput metric shows that the I/O peak between 22:00 and 00:00 is entirely caused by backups, consistently exceeding 220 MB/s.
High I/O throughput from data page reads
High I/O throughput from data page reads (Page Reads) is one of the most common causes of high I/O on an ApsaraDB RDS for SQL Server instance. This is primarily caused by insufficient memory for the buffer pool. When queries cannot find the required data in the cache (a cache miss), the system must read a large number of data pages from the disk.
A key metric for diagnosing cache performance is Page Life Expectancy (PLE). It represents the average time, in seconds, a data page stays in the buffer pool. A lower PLE value indicates greater memory pressure on the instance.
As a general rule, maintain a PLE value of at least 300 seconds. For instances with more memory, a higher threshold is recommended. You can use the following formula:
Recommended threshold = (Buffer pool size in GB / 4) × 300
For example, for an instance with 16 GB of memory, the memory available to the buffer pool does not exceed 12 GB. The recommended threshold is: (12 / 4) * 300 = 900 (seconds)
For more information, see Page Life Expectancy (PLE) in SQL Server.
If high I/O throughput is caused by data page reads, we recommend upgrading the memory specifications of the instance rather than upgrading the performance level (PL) of the disk.
At the database level, you can also reduce the data page read load by decreasing the total number of data pages. For example, you can archive or clean up historical data, enable table data compression, delete low-value indexes, or defragment indexes.
High I/O throughput from data page and log file writes
If you experience high I/O throughput from data page and log file writes, use Autonomy Services to check for frequent Data Manipulation Language (DML) operations (such as INSERT, DELETE, UPDATE, and MERGE) or Data Definition Language (DDL) operations (such as CREATE INDEX and ALTER INDEX) during the high-throughput period. Consider the following solutions:
-
DML write operations
First, determine if these are routine business operations. If they are not, such as for temporary data processing or archiving, run these operations during off-peak hours. If they are routine, we recommend upgrading the disk performance level (PL), for example, from ESSD PL1 to PL2.
We also recommend optimizing your index structure and deleting unnecessary nonclustered indexes.
-
DDL write operations
These are typically maintenance or temporary operations. Run these operations during off-peak hours.
Additionally, when you create or rebuild indexes, use the MAXDOP option in your SQL statements to limit the degree of parallelism. This reduces the peak I/O throughput during the operation, but it increases the total execution time of the DDL operation.
High I/O throughput from backups
Currently, ApsaraDB RDS for SQL Server supports data backups only on the primary instance. This increases the disk I/O throughput on the primary instance. Full backups have the most significant impact, while log backups have a smaller impact.
Because backups are essential for data security and reliability, we recommend that you configure a suitable backup schedule to minimize the impact on your business.
You can view the duration of data backups on the Restoration page of your instance. Use this information to choose an appropriate backup time that avoids business peak hours.
Click the Data Backup tab and calculate the backup duration by using the Backup Start Time and Backup End Time columns in the table.
-
If a full backup takes about 6 hours, your business peak hours are from 09:00 to 21:00, and background data processing tasks run from 22:00 to 01:00, you can set the backup start time to between 01:00 and 02:00. This ensures the full backup completes before 08:00. You can also set the backup cycle to daily, which improves the efficiency of restore operations.
-
If a full backup takes about 15 hours and running it at any time on a weekday affects your business, consider setting the backup cycle to weekends (Saturday and Sunday). However, this approach might increase the time required for point-in-time recovery.
If adjusting the backup time cannot prevent conflicts between full backups and business operations, consider upgrading the disk performance level (PL) or splitting your data across multiple instances to reduce the data volume on a single instance. This shortens the time required for a full backup.