The Deadlock page in ApsaraDB RDS for SQL Server displays details such as transaction start times, session IDs, locked resources, and deadlock types to help you quickly locate and resolve the problematic SQL statements that cause deadlocks. This topic describes how to view deadlocks and their details for an ApsaraDB RDS for SQL Server instance in the ApsaraDB RDS console.
Background information
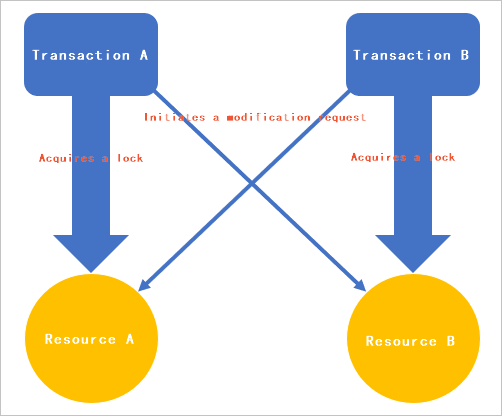
When a transaction modifies a resource, it applies a lock to prevent other transactions from changing it, which ensures data consistency.
A deadlock typically occurs when multiple transactions compete for resources. For example, Transaction A locks Resource A and tries to modify Resource B, while Transaction B locks Resource B and tries to modify Resource A. This circular dependency causes a deadlock, as each transaction waits for the other to release its lock. The system then automatically terminates the session with the lowest rollback cost (the victim session), causing its task to fail. The following figure illustrates this scenario.
Deadlock types
The Deadlock page displays statistics for the following five deadlock types:
-
KeyDeadlock
-
ObjectDeadlock
-
RIDDeadlock
-
PageDeadlock
-
CompileDeadlock
Lock modes
When a transaction accesses a resource, it uses different lock modes (LockMode) based on the access type. These include:
-
Shared lock (S): Allows a resource to be read but not modified while the lock is active.
-
Update lock (U): Prevents other transactions from acquiring an exclusive lock on a resource, signaling an intent to modify it. This lock is typically used to avoid deadlocks that can occur when multiple sessions try to read, lock, and then update a resource.
-
Exclusive lock (X): Prevents other transactions from accessing the resource.
Prerequisites
-
This feature is not available for ApsaraDB RDS for SQL Server 2008 R2 instances that use cloud disks.
-
This feature is available only for ApsaraDB RDS for SQL Server instances in the following regions: China (Hangzhou), China (Shanghai), China (Qingdao), China (Beijing), China (Zhangjiakou), China (Hohhot), China (Ulanqab), China (Shenzhen), China (Heyuan), China (Guangzhou), China (Chengdu), China (Hong Kong), Singapore, or UAE (Dubai).
Deadlock details
Go to the Instances page. In the top navigation bar, select the region in which the RDS instance resides. Then, find the RDS instance and click the ID of the instance.
-
In the left-side navigation pane, choose .
Deadlock page
-
Deadlock count
This section shows the number of recent deadlocks, offering statistics for four time ranges: deadlocks in the last 24 hours, deadlocks in the last 7 days, deadlocks in the last two weeks, and deadlocks in the last month.
-
Deadlock trend
This section charts the trend of deadlocks over a specified time range. You can perform the following operations:
-
Select a Start Date and an End Date, and then click Search to view deadlock information for the specified time range. The time range cannot exceed 30 days.
-
Click Previous Day, Last 7 Days, or Last Month to quickly view deadlock information for that time range.
-
Hover over a specific point in time to view the types and number of deadlocks that occurred at that time.
-
Click the
 icon in the upper-right corner of the trend chart to change the chart's display style or download the chart.
-
-
Deadlock Details
Click the
 icon next to a deadlock record to view the details of the deadlocked sessions. The details include:
-
LastTranStarted: The time when the transaction started.
-
SPID: The ID of the session that started the transaction.
-
IsVictim: Specifies whether the session was terminated (killed) to resolve the deadlock.
NoteSQL Server resolves deadlocks by using an internal thread that periodically checks for them. When a deadlock is detected, SQL Server terminates the session that has the lower rollback cost among the involved sessions. For example, because a
SELECTstatement typically has a lower cost than anUPDATEstatement, the system prioritizes terminating the session that runs theSELECTstatement. -
LogUsed: The size of the log generated by the session. Unit: bytes.
-
LockMode: The lock mode.
-
WaitResourceDesc: A description of the resource for which the current transaction is waiting.
-
ObjectOwned: The object that is already locked.
-
ObjectRequested: The object that the current transaction is requesting to lock.
-
WaitResource: The resource for which the current transaction is waiting.
-
HostName: The hostname of the current transaction.
-
LoginName: The account name for the current transaction.
-
Status: The status of the current transaction.
-
ClientApp: The name of the client application used by the current transaction.
-
SQLText: The details of the SQL statement.
NoteClick Click to Copy to copy the SQL statement for easier troubleshooting and analysis.
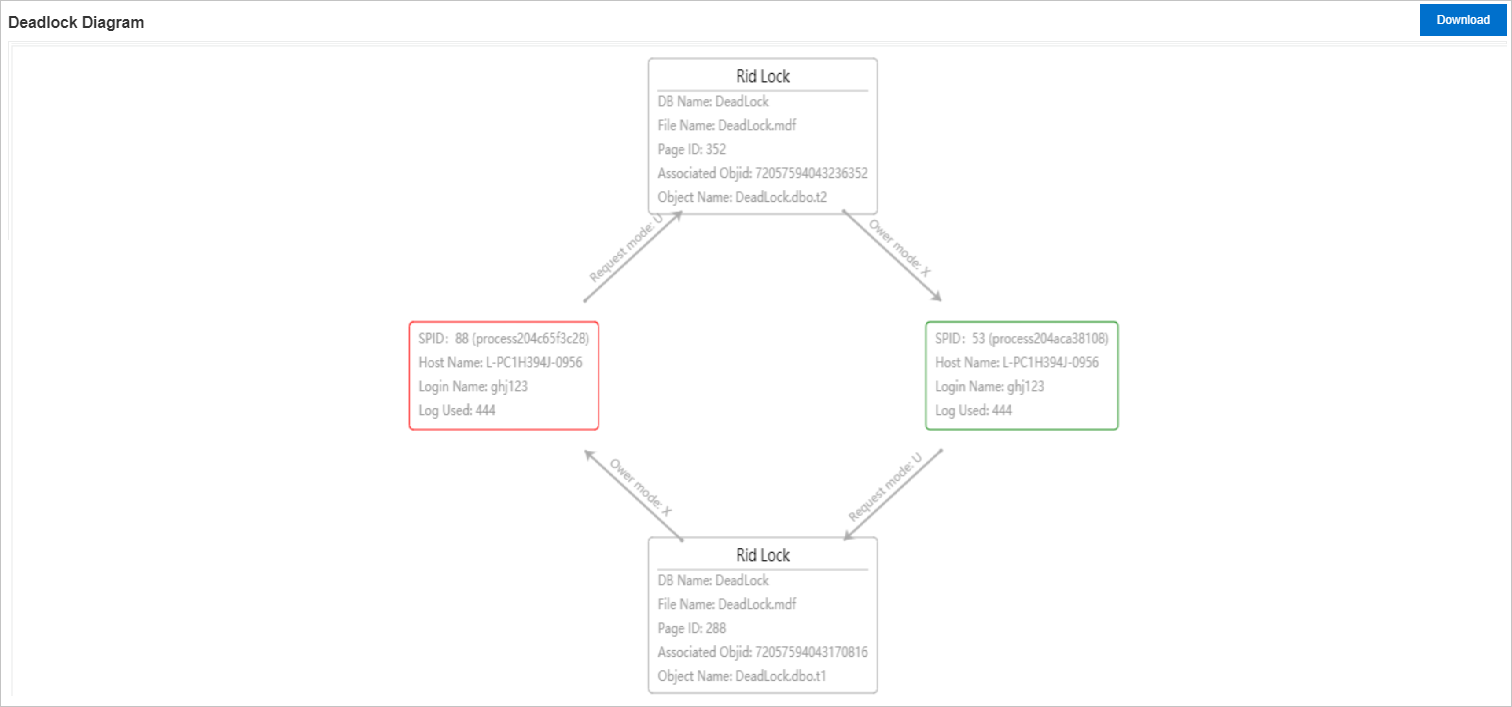
Click any row in the details list to display the corresponding deadlock diagram below.
-
-
Deadlock diagram
This section displays the relationships between the deadlocked sessions and provides details about the locked resources. You can click the Download button to download an XDL file containing the details of the current deadlock. You can open and view this file with SQL Server Management Studio (SSMS).
Deadlock solutions and optimization
How to resolve deadlocks on an ApsaraDB RDS for SQL Server instance