The Performance Events feature gives you visibility into the health and O&M activity of your ApsaraDB RDS for MySQL instance. You can review event statistics and details across three states: events planned for execution, events in progress, and completed events. Event types include exceptions, optimization events, and auto scaling events.
Prerequisites
Before you begin, make sure that you have:
An ApsaraDB RDS instance
Access to the RDS console
View events and suggestions
Go to the Instances page. In the top navigation bar, select the region where the instance resides. Find the instance and click its ID.
In the left-side navigation pane, click Monitoring and Alerts.
On the Performance Events tab, click Events and Suggestions. Specify a time range, then view the event statistics.
The end time must be later than the start time, and the interval must not exceed seven days.
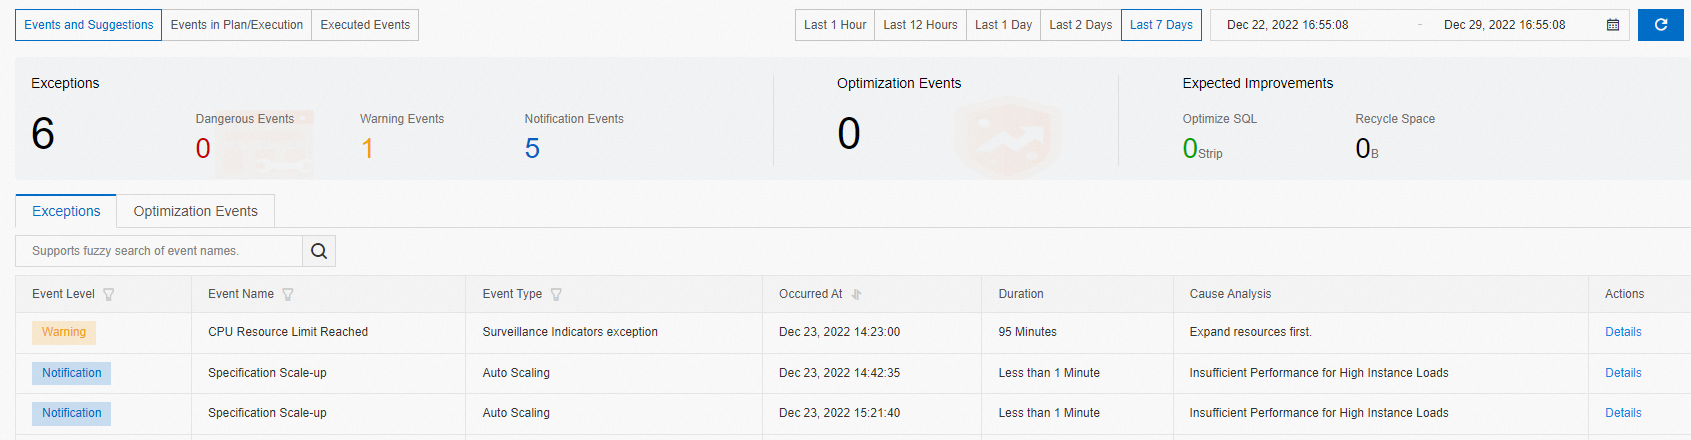
To narrow down results, filter events by Event Level, Event Name, or Event Type.
Click Exceptions to view exception statistics.
Click Optimization Events to view optimization event statistics.
To view the details of an event, click Details in the Actions column.
View events in plan or execution
Go to the Instances page. In the top navigation bar, select the region where the instance resides. Find the instance and click its ID.
In the left-side navigation pane, click Monitoring and Alerts.
On the Performance Events tab, click Events in Plan/Execution.
Filter events by Event Level as needed.
To view the details of an event, click Details in the Actions column.
View completed events
Go to the Instances page. In the top navigation bar, select the region where the instance resides. Find the instance and click its ID.
In the left-side navigation pane, click Monitoring and Alerts.
On the Performance Events tab, click Executed Events. Specify a time range, then view the execution results.
The end time must be later than the start time, and the interval must not exceed seven days.
Filter events by Event Level as needed.
To view the details of an event, click Details in the Actions column.
What's next
Enable event subscription so the system notifies you when performance events are detected on your instance, based on the notification method that you specify. For more information, see Use the event alerting feature.