Performance Insight is a load monitoring and diagnostics tool for ApsaraDB RDS for PostgreSQL. It visualizes database load through average active sessions (AAS), surfaces the SQL statements and wait events driving that load, and lets you drill down across multiple dimensions to resolve performance issues quickly.
Prerequisites
Before you begin, ensure that you have:
An RDS instance running PostgreSQL 13 or later
An instance in the High-availability Edition or Cluster Edition
A minor engine version of 20240530 or later
Enable Performance Insight
Log on to the ApsaraDB RDS console. On the Instances page, select the region where your instance resides, and click the instance ID.
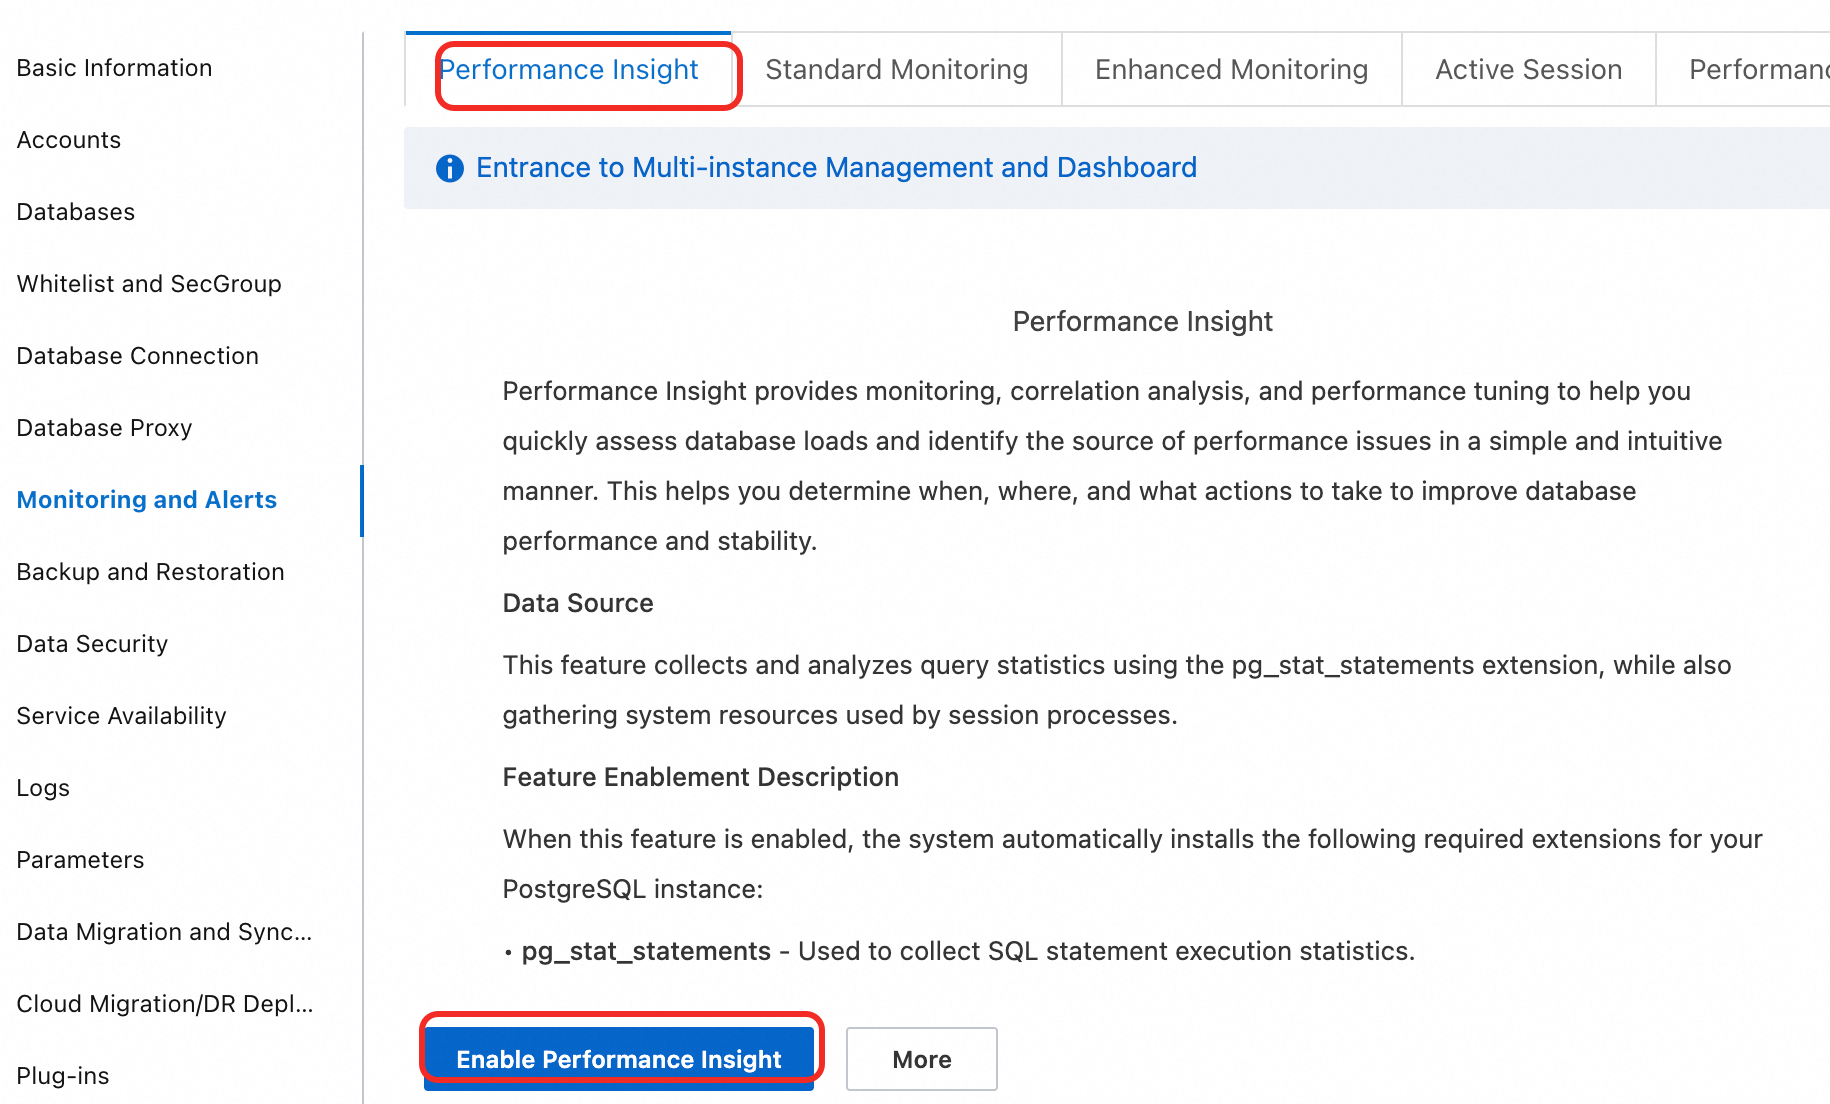
In the left navigation pane, choose Monitoring And Alerts, then click the Performance Insight tab.
Click Enable Performance Insight. In the dialog box, click OK.
To disable the feature, click Disable Performance Insight on the Performance Insight tab.
Wait a few moments for data to appear on the Performance Insight page.
Performance Insight is in public preview and is free of charge. Data is retained for 7 days. The official release will let you extend the retention period as needed. You will be notified in advance of any charges.
Analyze performance with Performance Insight
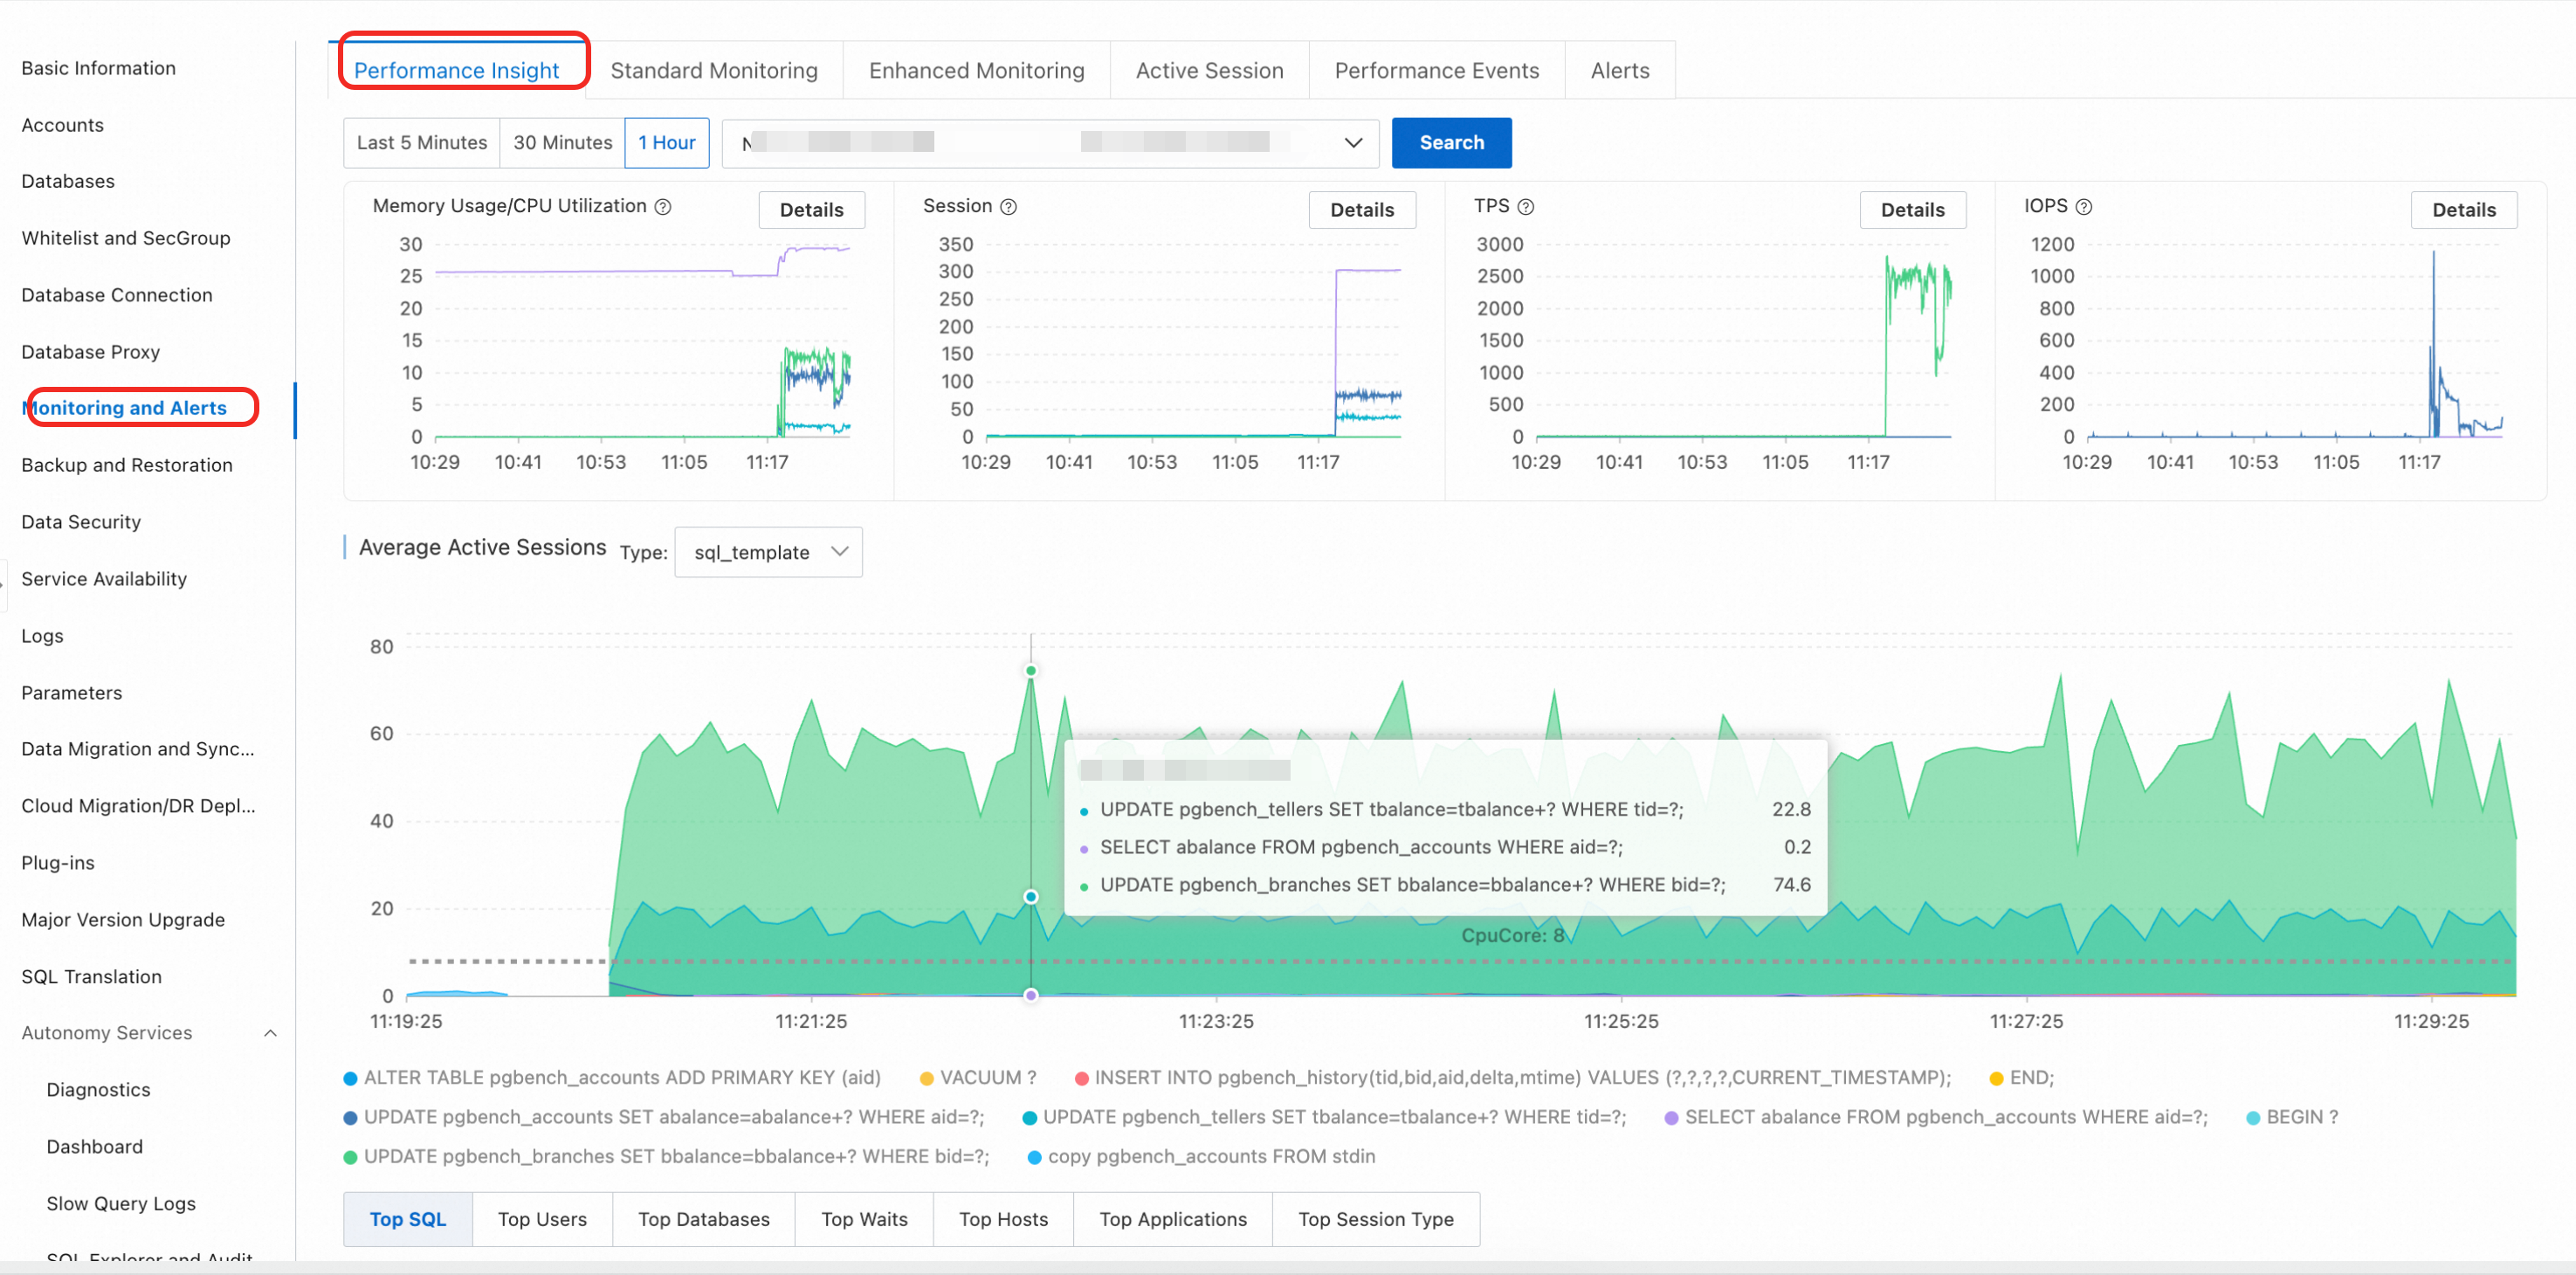
After enabling the feature, select a time range and click View to analyze performance. Follow this workflow to diagnose performance issues:
Check the AAS chart for load spikes. The average active sessions (AAS) chart shows total instance load in real time. Peaks correspond to performance bottlenecks.
Identify the dominant wait events. The AAS chart breaks down load by wait event type. The dimension with the highest AAS contribution points to the bottleneck category — for example, lock waits or I/O waits.
Find the top SQL statements. Switch to the SQL tab in the multi-dimensional load table. The top entries show which queries consume the most resources or wait longest.
Trace the source. Use the Hosts and Databases tabs to identify the client IP address and database generating the load.
Key performance metric charts
At the top of the page, trend charts track the following metrics over the selected time range:
| Metric | Description |
|---|---|
| CPU/memory utilization | Percentage of CPU and memory resources in use |
| Session connections | Number of active connections to the instance |
| Transactions Per Second (TPS) | Rate of committed transactions |
| Input/output operations per second (IOPS) | Disk I/O throughput |
Multi-dimensional load breakdown
Below the AAS chart, switch between dimension tabs to identify the source of high load:
| Tab | What it shows |
|---|---|
| SQL | SQL statements consuming the most resources |
| User | Database users generating the highest load |
| Databases | Databases with the most active sessions |
| Waits | Wait event types contributing most to load |
| Hosts | Client host names or IP addresses |
| Applications | Application names connected to the database |
| Session Type | Types of current sessions |
Troubleshoot lock contention from a slow SQL spike
Symptom
Monitoring data shows a sudden spike in slow SQL statements and a significant increase in application response time.
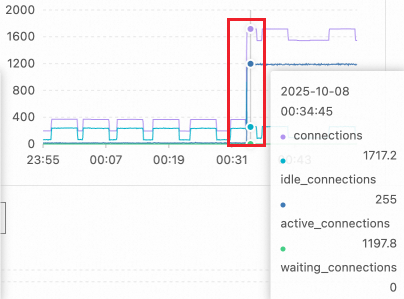
Step 1: Check performance metric trends
On the key performance metric charts, look for a sharp rise in active sessions. In this example, the session count jumped from a normal level of about a dozen to over 1,100 at 00:34 — well beyond the concurrent processing capacity of the 16-core PostgreSQL instance.
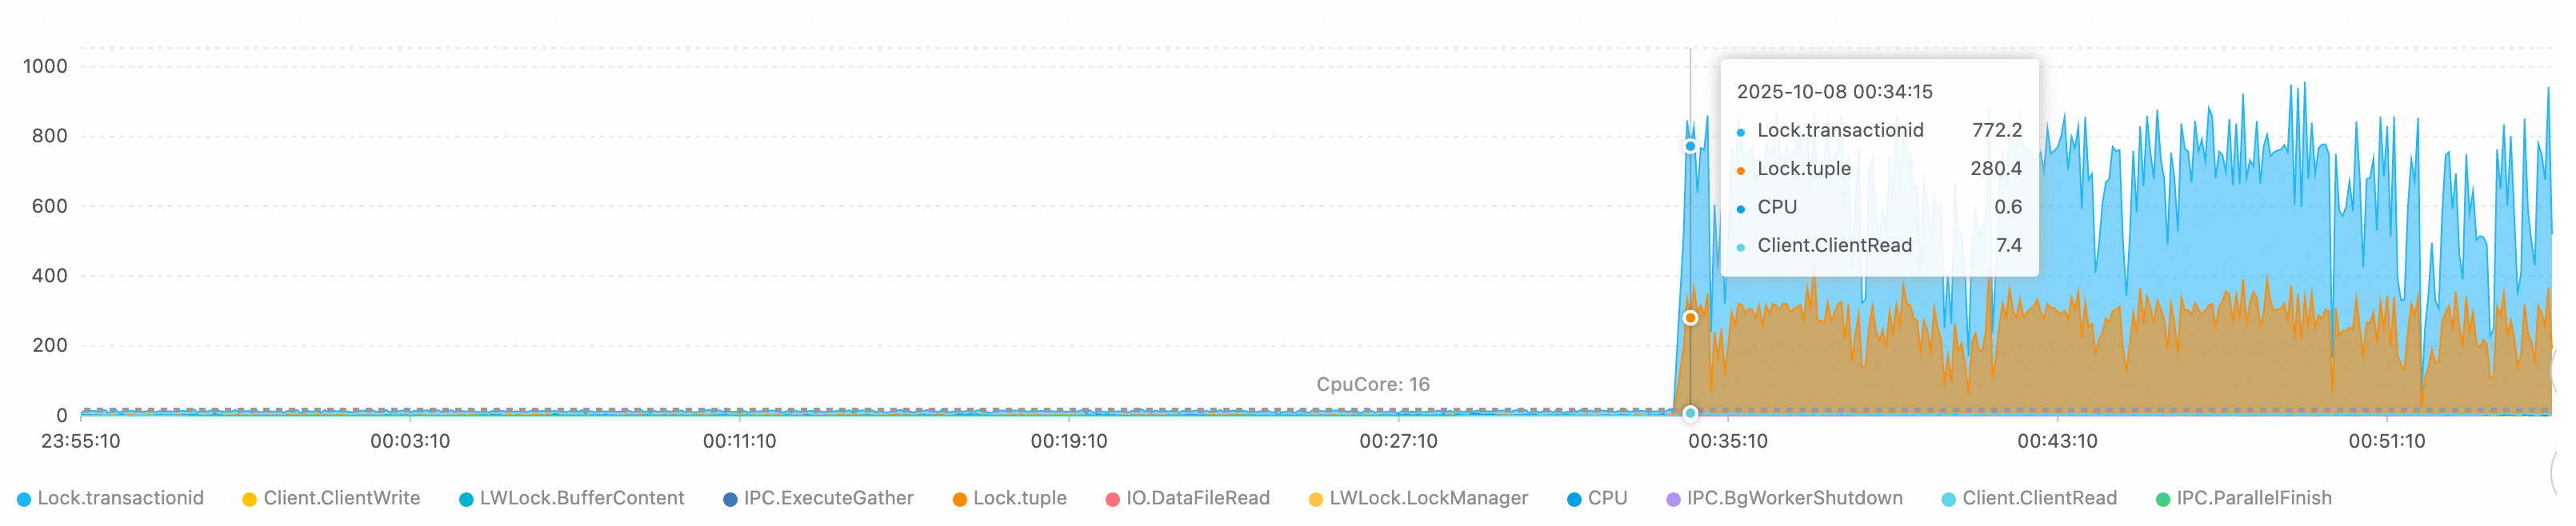
Step 2: Identify the wait events
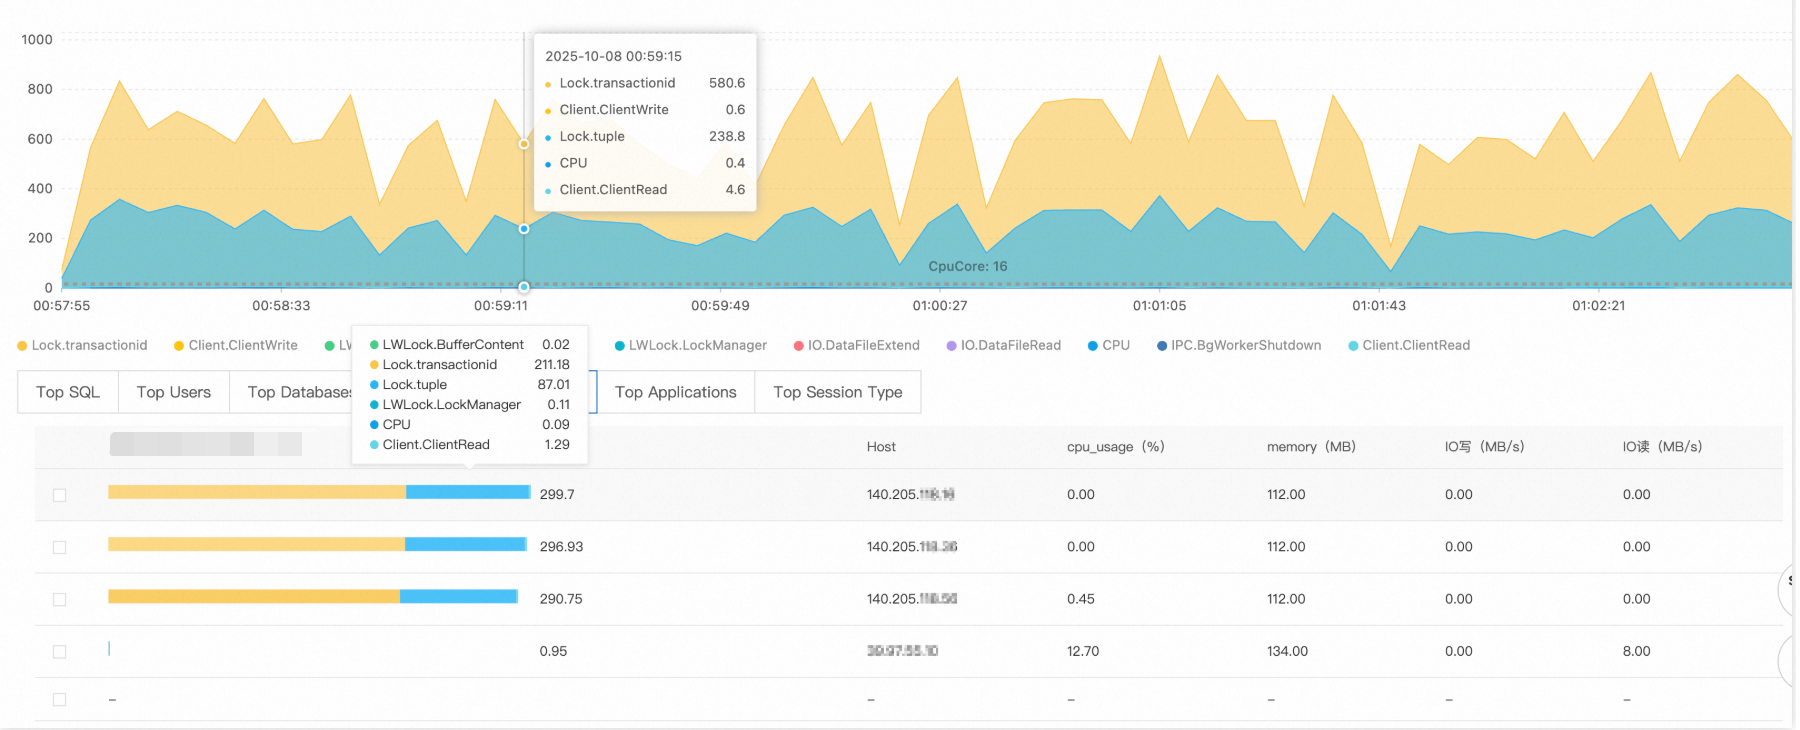
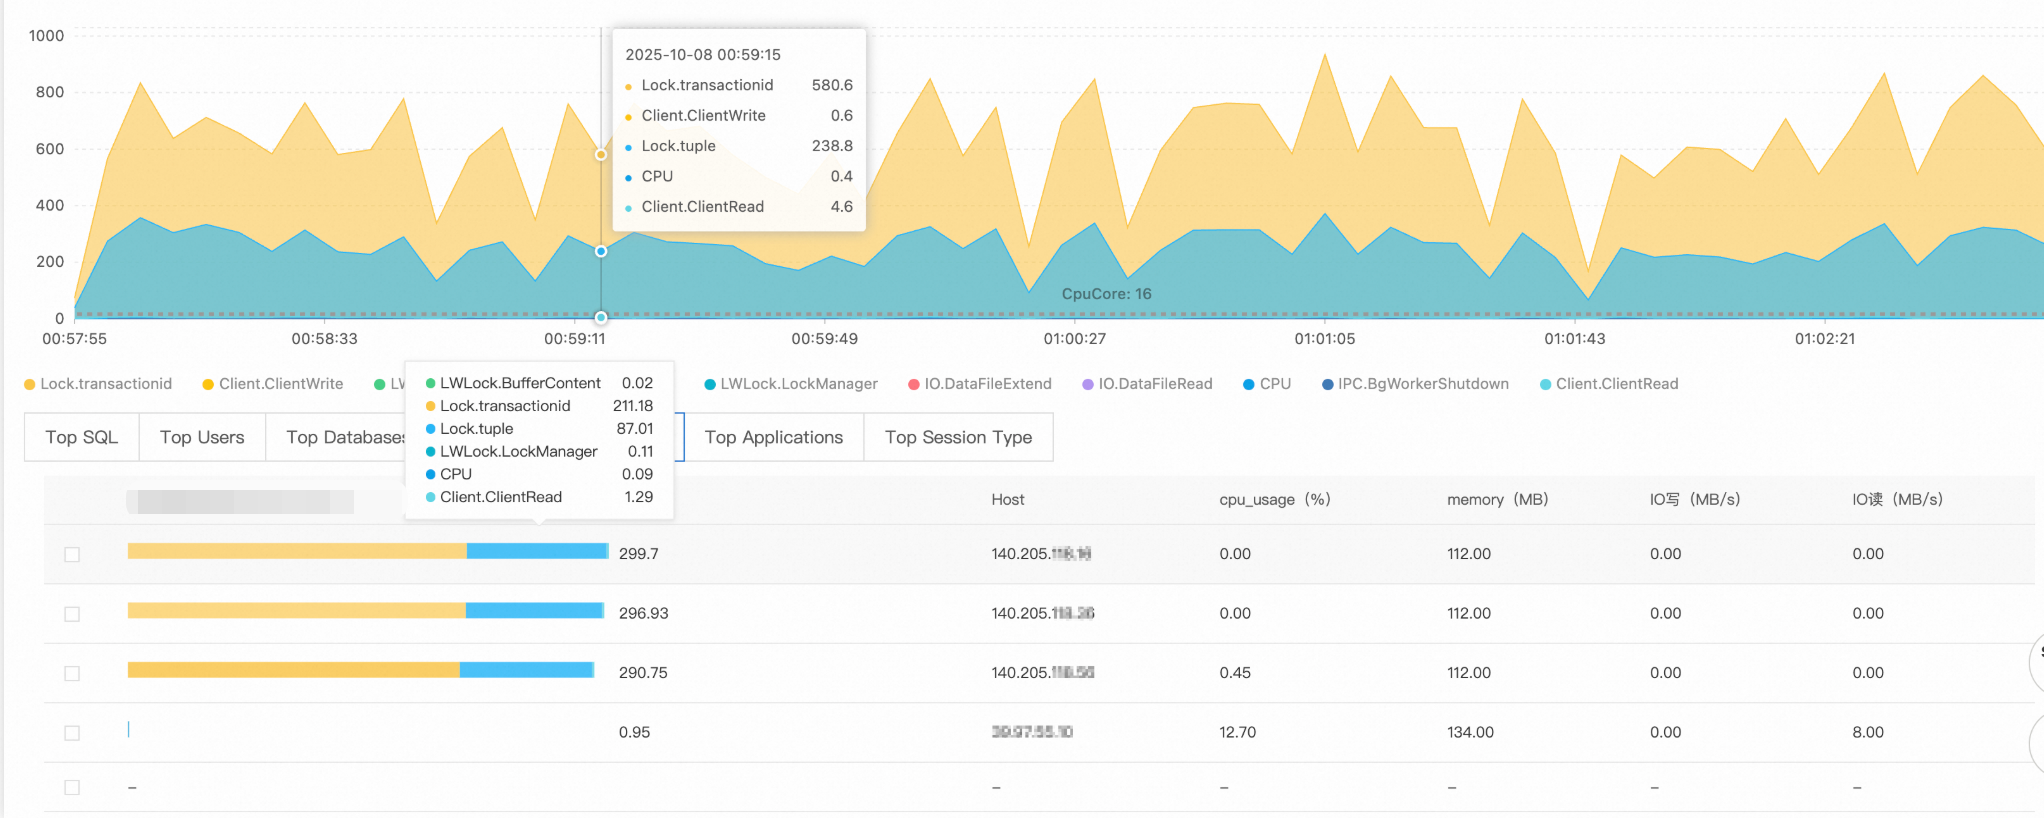
The AAS chart shows the wait event distribution. In this case, two events dominate:
Lock/transactionid: A transaction ID lock wait, typically caused by a long-running transaction or a deadlock.Lock/tuple: A row-level lock wait, indicating severe concurrent write conflicts.
The number of active sessions exceeds the theoretical processing limit of the 16-core CPU, confirming severe lock contention.
Step 3: Find the responsible SQL statements
Switch to the SQL tab. The top two queries show 220 and 119 sessions waiting for lock resources — these statements are the root of the lock wait chain.
Step 4: Trace the source
Check the Hosts and Databases tabs to identify where the load originates:
Source client:
140.205.XXX.XXXTarget database:
perf_test
Root cause
Fault type: Lock contention avalanche
The client at 140.205.XXX.XXX initiated high-concurrency Data Manipulation Language (DML) operations on the perf_test database — likely involving hot spot data updates or large-scale transaction processing. Without connection limits or lock wait timeout controls, new connections flooded in as each one entered the lock wait queue, creating a runaway lock contention cycle.
Solutions
Immediate measures:
Limit connections from the problematic client:
ALTER ROLE target_user CONNECTION LIMIT 10; -- target_user: the database usernameTerminate long-waiting sessions:
-- Review the sessions before terminating them
SELECT
    pid,                                    -- Process ID (session identifier)
    usename,                                -- Database username
    state,                                  -- Session state (active or idle)
    wait_event,                             -- Specific wait event type
    now() - query_start AS query_duration,  -- Duration of the current query
    left(query, 50) AS query_preview        -- Preview of the SQL statement (first 50 characters)
FROM pg_stat_activity
WHERE datname = 'perf_test'                 -- Target database
  AND client_addr = '140.205.XXX.XXX'       -- Source client IP address
  AND state = 'active'
  AND wait_event_type = 'Lock'
  AND pid <> pg_backend_pid()               -- Exclude the current session
  AND now() - query_start > interval '5 minutes';

-- After confirming the list, terminate the sessions
SELECT pg_terminate_backend(pid)
FROM pg_stat_activity
WHERE datname = 'perf_test'
  AND client_addr = '140.205.XXX.XXX'
  AND state = 'active'
  AND wait_event_type = 'Lock'
  AND pid <> pg_backend_pid()
  AND now() - query_start > interval '5 minutes';

-- Verify that the target sessions are terminated
SELECT pid, usename, state, query
FROM pg_stat_activity
WHERE datname = 'perf_test'
  AND client_addr = '140.205.XXX.XXX';
Long-term optimizations:
Deploy a connection pool: Use a connection pooler such as PgBouncer to cap the maximum number of concurrent connections.
Configure timeout parameters:
-- Set the lock wait timeout
ALTER DATABASE perf_test SET lock_timeout = '30s';
-- Set the statement execution timeout
ALTER DATABASE perf_test SET statement_timeout = '60s';
Optimize application logic:
Reduce transaction granularity to avoid long-running transactions.
Use optimistic locking or distributed lock mechanisms for hot spot data.
Implement read/write splitting to route read-only queries to read-only instances.
Set monitoring thresholds: Configure alerts for active connection counts and lock wait times to catch problems before they escalate.