Symptoms
An ApsaraDB RDS for MySQL instance can experience high IOPS usage. This topic explains the main causes and provides solutions.
Causes
-
The instance has insufficient memory for data caching or sorting, resulting in excessive physical I/O.
-
Inefficient queries scan an excessive number of rows.
Solutions
You can use one or both of the following methods to resolve high IOPS usage:
-
Generate a diagnosis report for the instance (recommended).
-
Terminate problematic queries.
View the current diagnosis report for the instance
-
In the DMS console, log in to the database.
-
Choose Performance > One-click diagnosis.
-
In the DAS console, you can view the instance's real-time sessions, deadlocks, and slow queries.
The One-click diagnosis overview page displays the database health status in a hierarchical topology. In addition to real-time sessions, deadlocks, and slow queries, the page provides several other diagnostic panels. These include: active sessions (connection count, maximum allowed connections, and connection usage); resource diagnosis (CPU utilization, memory utilization, and IOPS usage); QPS (average and peak values, and month-over-month/year-over-year growth rates); all SQL; and space usage (disk usage, remaining available space, and average daily growth). The deadlocks and slow queries panels are highlighted to help you quickly identify issues.
-
Click a module's details link to view and apply optimizations.
Terminate problematic queries
You can find and terminate problematic queries by using the instance session feature in the DMS console or by running commands. We recommend that you terminate queries with high physical reads (Physical_sync_read and Physical_async_read).
-
If an RDS instance reaches its maximum number of connections, you cannot log in to the instance by using the DMS console or a MySQL command-line tool.
-
If you cannot connect by using the DMS console or a MySQL command-line tool, set the
wait_timeoutparameter (in seconds) to a small value, such as 60, in the RDS console. This action closes connections that have been idle for more than 60 seconds, freeing up resources and allowing you to log in to the instance.
Terminate problematic queries by using the instance session feature
If a diagnosis report is unavailable or you cannot immediately apply its suggestions, first terminate problematic queries by using the instance session feature in the DMS console.
Ensure the application stops submitting the problematic queries first. Otherwise, the queries will reappear after being terminated.
-
In the DMS console, log in to the database.
-
Choose Performance > Instance session.
-
Select the session to end and click Kill Selected.
Terminate problematic queries by using commands
-
Connect to the instance by using a MySQL command-line tool.
-
Run the following commands to view session details and identify the problematic session:
-
Run the
show processlist;command.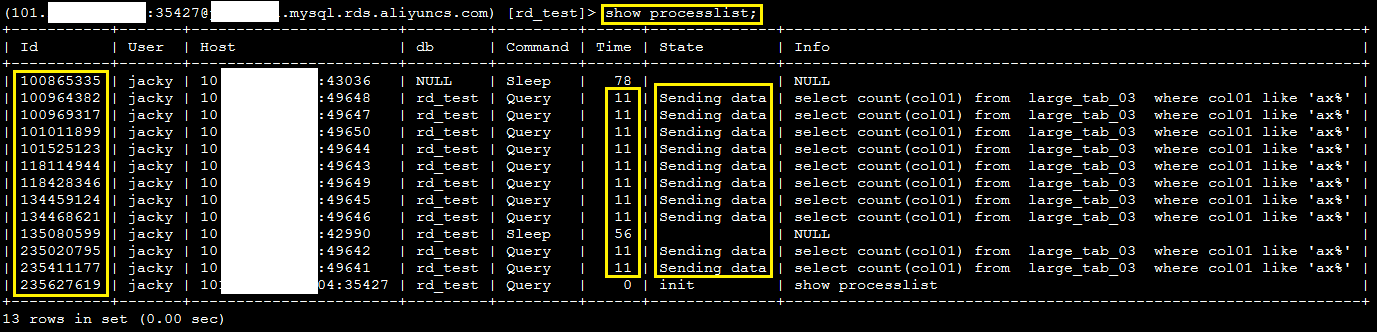
-
If a large number of sessions are running, run the
show full processlist;command to view the complete query text.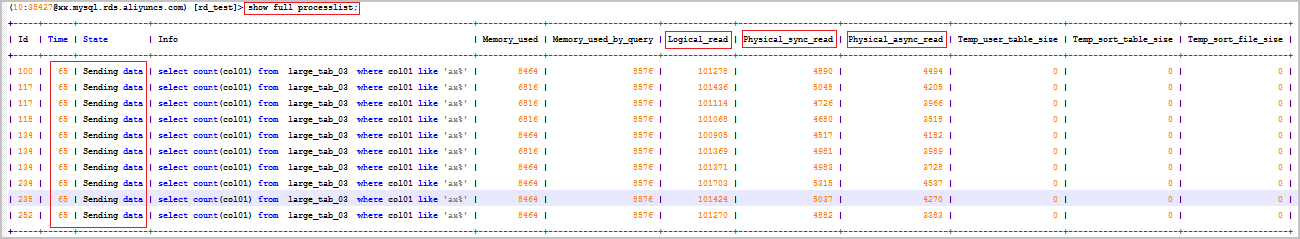
-
-
Run the
kill [$ID]command to terminate the session. Replace [$ID] with the session ID from theIdcolumn in the command output.
Applies to
-
ApsaraDB RDS for MySQL