This topic describes the Performance Agent feature that is provided by AliSQL. This feature allows you to collect statistics about the performance of an ApsaraDB RDS for MySQL instance.
Background information
A memory table named PERF_STATISTICS is added for Performance Agent. This table is stored in the information_schema system database. This table stores the performance data that is generated over the most recent period of time. You can query performance data from this table.
Prerequisites
Your RDS instance runs one of the following MySQL versions and RDS editions:
MySQL 8.4
MySQL 8.0 with minor engine version 20200229 or later
MySQL 5.7 with minor engine version 20200229 or later
MySQL 5.6 with minor engine version 20200630 or later
To upgrade the minor engine version of your instance, see Upgrade the minor engine version.
Description
The following table describes the parameters that you must configure for the Performance Agent feature.
Parameter | Description |
performance_agent_enabled | Specifies whether to enable the Performance Agent feature. Valid values: ON and OFF. Default value: ON. |
performance_agent_file_size | The size of a single local performance data file. Unit: MB. |
performance_agent_interval | The data collection interval. Unit: seconds. Default value: 1. |
performance_agent_network_device | The name prefix of the physical network interface controller (NIC) for the host. |
performance_agent_perfstat_volume_size | The maximum number of data records in the |
These parameters are not visible in the console. You can run the SHOW VARIABLES LIKE '<parameter_name>'; command to check their values.
Schema
The PERF_STATISTICS memory table uses the following schema:
CREATE TEMPORARY TABLE `PERF_STATISTICS` (
  `TIME` datetime NOT NULL DEFAULT '0000-00-00 00:00:00',
  `PROCS_MEM_USAGE` double NOT NULL DEFAULT '0',
  `PROCS_MEM_RATIO` double NOT NULL DEFAULT '0',
  `PROCS_CPU_RATIO` double NOT NULL DEFAULT '0',
  `PROCS_IOPS` double NOT NULL DEFAULT '0',
  `PROCS_IOPS_READ` double NOT NULL DEFAULT '0',
  `PROCS_IOPS_WRITE` double NOT NULL DEFAULT '0',
  `PROCS_IO_READ_BYTES` bigint NOT NULL DEFAULT '0',
  `PROCS_IO_WRITE_BYTES` bigint NOT NULL DEFAULT '0',
  `MYSQL_CONN_ABORT` int NOT NULL DEFAULT '0',
  `MYSQL_CONN_CREATED` int NOT NULL DEFAULT '0',
  `MYSQL_USER_CONN_COUNT` int NOT NULL DEFAULT '0',
  `MYSQL_CONN_COUNT` int NOT NULL DEFAULT '0',
  `MYSQL_CONN_RUNNING` int NOT NULL DEFAULT '0',
  `MYSQL_CONNECTIONS` int NOT NULL DEFAULT '0',
  `MYSQL_CONN_CACHED` int NOT NULL DEFAULT '0',
  `MYSQL_LOCK_IMMEDIATE` int NOT NULL DEFAULT '0',
  `MYSQL_LOCK_WAITED` int NOT NULL DEFAULT '0',
  `MYSQL_QUESTIONS` int NOT NULL DEFAULT '0',
  `MYSQL_COM_INSERT` int NOT NULL DEFAULT '0',
  `MYSQL_COM_INSERT_SELECT` int NOT NULL DEFAULT '0',
  `MYSQL_COM_REPLACE` int NOT NULL DEFAULT '0',
  `MYSQL_COM_REPLACE_SELECT` int NOT NULL DEFAULT '0',
  `MYSQL_COM_UPDATE` int NOT NULL DEFAULT '0',
  `MYSQL_COM_UPDATE_MULTI` int NOT NULL DEFAULT '0',
  `MYSQL_COM_DELETE` int NOT NULL DEFAULT '0',
  `MYSQL_COM_DELETE_MULTI` int NOT NULL DEFAULT '0',
  `MYSQL_COM_SELECT` int NOT NULL DEFAULT '0',
  `MYSQL_COM_COMMIT` int NOT NULL DEFAULT '0',
  `MYSQL_COM_ROLLBACK` int NOT NULL DEFAULT '0',
  `MYSQL_COM_PREPARE` int NOT NULL DEFAULT '0',
  `MYSQL_HANDLER_COMMIT` int NOT NULL DEFAULT '0',
  `MYSQL_HANDELR_ROLLBACK` int NOT NULL DEFAULT '0',
  `MYSQL_LONG_QUERY` int NOT NULL DEFAULT '0',
  `MYSQL_TCACHE_GET` bigint NOT NULL DEFAULT '0',
  `MYSQL_TCACHE_MISS` bigint NOT NULL DEFAULT '0',
  `MYSQL_TMPFILE_CREATED` int NOT NULL DEFAULT '0',
  `MYSQL_TMP_TABLES` int NOT NULL DEFAULT '0',
  `MYSQL_TMP_DISKTABLES` int NOT NULL DEFAULT '0',
  `MYSQL_SORT_MERGE` int NOT NULL DEFAULT '0',
  `MYSQL_SORT_ROWS` int NOT NULL DEFAULT '0',
  `MYSQL_BYTES_RECEIVED` bigint NOT NULL DEFAULT '0',
  `MYSQL_BYTES_SENT` bigint NOT NULL DEFAULT '0',
  `MYSQL_BINLOG_OFFSET` int NOT NULL DEFAULT '0',
  `MYSQL_IOLOG_OFFSET` int NOT NULL DEFAULT '0',
  `MYSQL_RELAYLOG_OFFSET` int NOT NULL DEFAULT '0',
  `EXTRA` json NOT NULL DEFAULT 'null'
) ENGINE=InnoDB DEFAULT CHARSET=utf8;
Column | Description |
TIME | The timestamp of data collection. The format is |
PROCS_MEM_USAGE | The physical memory used by the process. Unit: bytes. |
PROCS_MEM_RATIO | The memory usage ratio of the process. |
PROCS_CPU_RATIO | The CPU utilization of the process. |
PROCS_IOPS | The number of system I/O calls. |
PROCS_IOPS_READ | The read I/O operations per second (IOPS) for the process. |
PROCS_IOPS_WRITE | The write IOPS for the process. |
PROCS_IO_READ_BYTES | The amount of data read by I/O operations. Unit: bytes. |
PROCS_IO_WRITE_BYTES | The amount of data written by I/O operations. Unit: bytes. |
MYSQL_CONN_ABORT | The number of aborted connections. |
MYSQL_CONN_CREATED | The number of created connections. |
MYSQL_USER_CONN_COUNT | The total number of current user connections. |
MYSQL_CONN_COUNT | The total number of connections. |
MYSQL_CONN_RUNNING | The number of currently active connections. |
MYSQL_CONNECTIONS | The number of connection attempts to the MySQL server. |
MYSQL_CONN_CACHED | The number of threads in the thread cache. |
MYSQL_LOCK_IMMEDIATE | The number of table locks that were acquired immediately. |
MYSQL_LOCK_WAITED | The number of table locks that required a wait. |
MYSQL_QUESTIONS | The number of statements executed by the server. |
MYSQL_COM_INSERT | The number of |
MYSQL_COM_INSERT_SELECT | The number of |
MYSQL_COM_REPLACE | The number of |
MYSQL_COM_REPLACE_SELECT | The number of |
MYSQL_COM_UPDATE | The number of |
MYSQL_COM_UPDATE_MULTI | The number of multi-table |
MYSQL_COM_DELETE | The number of |
MYSQL_COM_DELETE_MULTI | The number of multi-table |
MYSQL_COM_SELECT | The number of |
MYSQL_COM_COMMIT | The number of |
MYSQL_COM_ROLLBACK | The number of |
MYSQL_COM_PREPARE | The number of prepared statements. |
MYSQL_HANDLER_COMMIT | The number of internal |
MYSQL_HANDELR_ROLLBACK | The number of requests to perform a rollback operation inside a storage engine. |
MYSQL_LONG_QUERY | The number of slow queries. |
MYSQL_TCACHE_GET | The number of table open cache hits. |
MYSQL_TCACHE_MISS | The number of table open cache misses. |
MYSQL_TMPFILE_CREATED | The number of temporary files created. |
MYSQL_TMP_TABLES | The number of internal in-memory temporary tables created. |
MYSQL_TMP_DISKTABLES | The number of internal on-disk temporary tables created. |
MYSQL_SORT_MERGE | The number of merge passes for sorting. |
MYSQL_SORT_ROWS | The number of sorted rows. |
MYSQL_BYTES_RECEIVED | The number of bytes received from all clients. Unit: bytes. |
MYSQL_BYTES_SENT | The number of bytes sent to all clients. Unit: bytes. |
MYSQL_BINLOG_OFFSET | The size of the generated binary log files. Unit: bytes. |
MYSQL_IOLOG_OFFSET | The size of the binary log files sent by the source instance. Unit: bytes. |
MYSQL_RELAYLOG_OFFSET | The size of the relay log files applied by the replica instance. Unit: bytes. |
EXTRA | InnoDB statistics in JSON format. For details on these fields, see the EXTRA field descriptions table below. Note The metrics for InnoDB statistics are identical to the values returned by the |
Table 1. EXTRA field descriptions
Field | Description |
INNODB_TRX_CNT | The number of transactions. |
INNODB_DATA_READ | The amount of data read. Unit: bytes. |
INNODB_IBUF_SIZE | The size of the insert buffer, in pages. |
INNODB_LOG_WAITS | The number of waits for log writes. |
INNODB_MAX_PURGE | The number of purged transactions. |
INNODB_N_WAITING | The number of lock waits. |
INNODB_ROWS_READ | The number of rows read. |
INNODB_LOG_WRITES | The number of log writes. |
INNODB_IBUF_MERGES | The number of merges from the insert buffer. |
INNODB_DATA_WRITTEN | The amount of data written. Unit: bytes. |
INNODB_DBLWR_WRITES | The number of doublewrite operations. |
INNODB_IBUF_SEGSIZE | The current size of the insert buffer. |
INNODB_ROWS_DELETED | The number of rows deleted. |
INNODB_ROWS_UPDATED | The number of rows updated. |
INNODB_COMMIT_TRXCNT | The number of committed transactions. |
INNODB_IBUF_FREELIST | The length of the free list. |
INNODB_MYSQL_TRX_CNT | The number of MySQL transactions. |
INNODB_ROWS_INSERTED | The number of rows inserted. |
INNODB_ACTIVE_TRX_CNT | The number of active transactions. |
INNODB_OS_LOG_WRITTEN | The amount of data written to the log files. Unit: bytes. |
INNODB_ACTIVE_VIEW_CNT | The number of active views. |
INNODB_RSEG_HISTORY_LEN | The length of the history list in the rollback segment. |
INNODB_AVG_COMMIT_TRXTIME | The average transaction commit time. |
INNODB_MAX_COMMIT_TRXTIME | The maximum transaction commit time. |
INNODB_DBLWR_PAGES_WRITTEN | The number of pages written by doublewrite operations. |
Use Performance Agent
Query the system table directly to obtain performance data. For example:
To query the CPU utilization and memory usage for the last 30 seconds:
MySQL> select TIME, PROCS_MEM_USAGE, PROCS_CPU_RATIO from information_schema.PERF_STATISTICS order by time DESC limit 30;
+---------------------+-----------------+-----------------+
| TIME                | PROCS_MEM_USAGE | PROCS_CPU_RATIO |
+---------------------+-----------------+-----------------+
| 2020-02-27 11:15:36 |       857812992 |           18.55 |
| 2020-02-27 11:15:35 |       857808896 |           18.54 |
| 2020-02-27 11:15:34 |       857268224 |           19.64 |
| 2020-02-27 11:15:33 |       857268224 |           21.06 |
| 2020-02-27 11:15:32 |       857264128 |           20.39 |
| 2020-02-27 11:15:31 |       857272320 |           20.32 |
| 2020-02-27 11:15:30 |       857272320 |           21.35 |
| 2020-02-27 11:15:29 |       857272320 |            28.8 |
| 2020-02-27 11:15:28 |       857268224 |           29.08 |
| 2020-02-27 11:15:27 |       857268224 |           26.92 |
| 2020-02-27 11:15:26 |       857268224 |           23.84 |
| 2020-02-27 11:15:25 |       857264128 |           13.76 |
| 2020-02-27 11:15:24 |       857264128 |           15.12 |
| 2020-02-27 11:15:23 |       857264128 |           14.76 |
| 2020-02-27 11:15:22 |       857264128 |           15.38 |
| 2020-02-27 11:15:21 |       857260032 |           13.23 |
| 2020-02-27 11:15:20 |       857260032 |           12.75 |
| 2020-02-27 11:15:19 |       857260032 |           12.17 |
| 2020-02-27 11:15:18 |       857255936 |           13.22 |
| 2020-02-27 11:15:17 |       857255936 |           20.51 |
| 2020-02-27 11:15:16 |       857255936 |           28.74 |
| 2020-02-27 11:15:15 |       857251840 |           29.85 |
| 2020-02-27 11:15:14 |       857251840 |           29.31 |
| 2020-02-27 11:15:13 |       856981504 |           28.85 |
| 2020-02-27 11:15:12 |       856981504 |           29.19 |
| 2020-02-27 11:15:11 |       856977408 |           29.12 |
| 2020-02-27 11:15:10 |       856977408 |           29.32 |
| 2020-02-27 11:15:09 |       856977408 |            29.2 |
| 2020-02-27 11:15:08 |       856973312 |           29.36 |
| 2020-02-27 11:15:07 |       856973312 |           28.79 |
+---------------------+-----------------+-----------------+
30 rows in set (0.08 sec)
To query the number of rows read from and inserted into InnoDB in the last 30 seconds:
MySQL> select TIME, EXTRA->'$.INNODB_ROWS_READ', EXTRA->'$.INNODB_ROWS_INSERTED' from information_schema.PERF_STATISTICS order by time DESC limit 30;
+---------------------+-----------------------------+---------------------------------+
| TIME                | EXTRA->'$.INNODB_ROWS_READ' | EXTRA->'$.INNODB_ROWS_INSERTED' |
+---------------------+-----------------------------+---------------------------------+
| 2020-02-27 11:22:17 | 39209                       | 0                               |
| 2020-02-27 11:22:16 | 36098                       | 0                               |
| 2020-02-27 11:22:15 | 38035                       | 0                               |
| 2020-02-27 11:22:14 | 37384                       | 0                               |
| 2020-02-27 11:22:13 | 38336                       | 0                               |
| 2020-02-27 11:22:12 | 33946                       | 0                               |
| 2020-02-27 11:22:11 | 36301                       | 0                               |
| 2020-02-27 11:22:10 | 36835                       | 0                               |
| 2020-02-27 11:22:09 | 36900                       | 0                               |
| 2020-02-27 11:22:08 | 36402                       | 0                               |
| 2020-02-27 11:22:07 | 39672                       | 0                               |
| 2020-02-27 11:22:06 | 39316                       | 0                               |
| 2020-02-27 11:22:05 | 37830                       | 0                               |
| 2020-02-27 11:22:04 | 36396                       | 0                               |
| 2020-02-27 11:22:03 | 34820                       | 0                               |
| 2020-02-27 11:22:02 | 37350                       | 0                               |
| 2020-02-27 11:22:01 | 39463                       | 0                               |
| 2020-02-27 11:22:00 | 38419                       | 0                               |
| 2020-02-27 11:21:59 | 37673                       | 0                               |
| 2020-02-27 11:21:58 | 35117                       | 0                               |
| 2020-02-27 11:21:57 | 36140                       | 0                               |
| 2020-02-27 11:21:56 | 37592                       | 0                               |
| 2020-02-27 11:21:55 | 39765                       | 0                               |
| 2020-02-27 11:21:54 | 35553                       | 0                               |
| 2020-02-27 11:21:53 | 35882                       | 0                               |
| 2020-02-27 11:21:52 | 37061                       | 0                               |
| 2020-02-27 11:21:51 | 40699                       | 0                               |
| 2020-02-27 11:21:50 | 39608                       | 0                               |
| 2020-02-27 11:21:49 | 39317                       | 0                               |
| 2020-02-27 11:21:48 | 37413                       | 0                               |
+---------------------+-----------------------------+---------------------------------+
30 rows in set (0.08 sec)
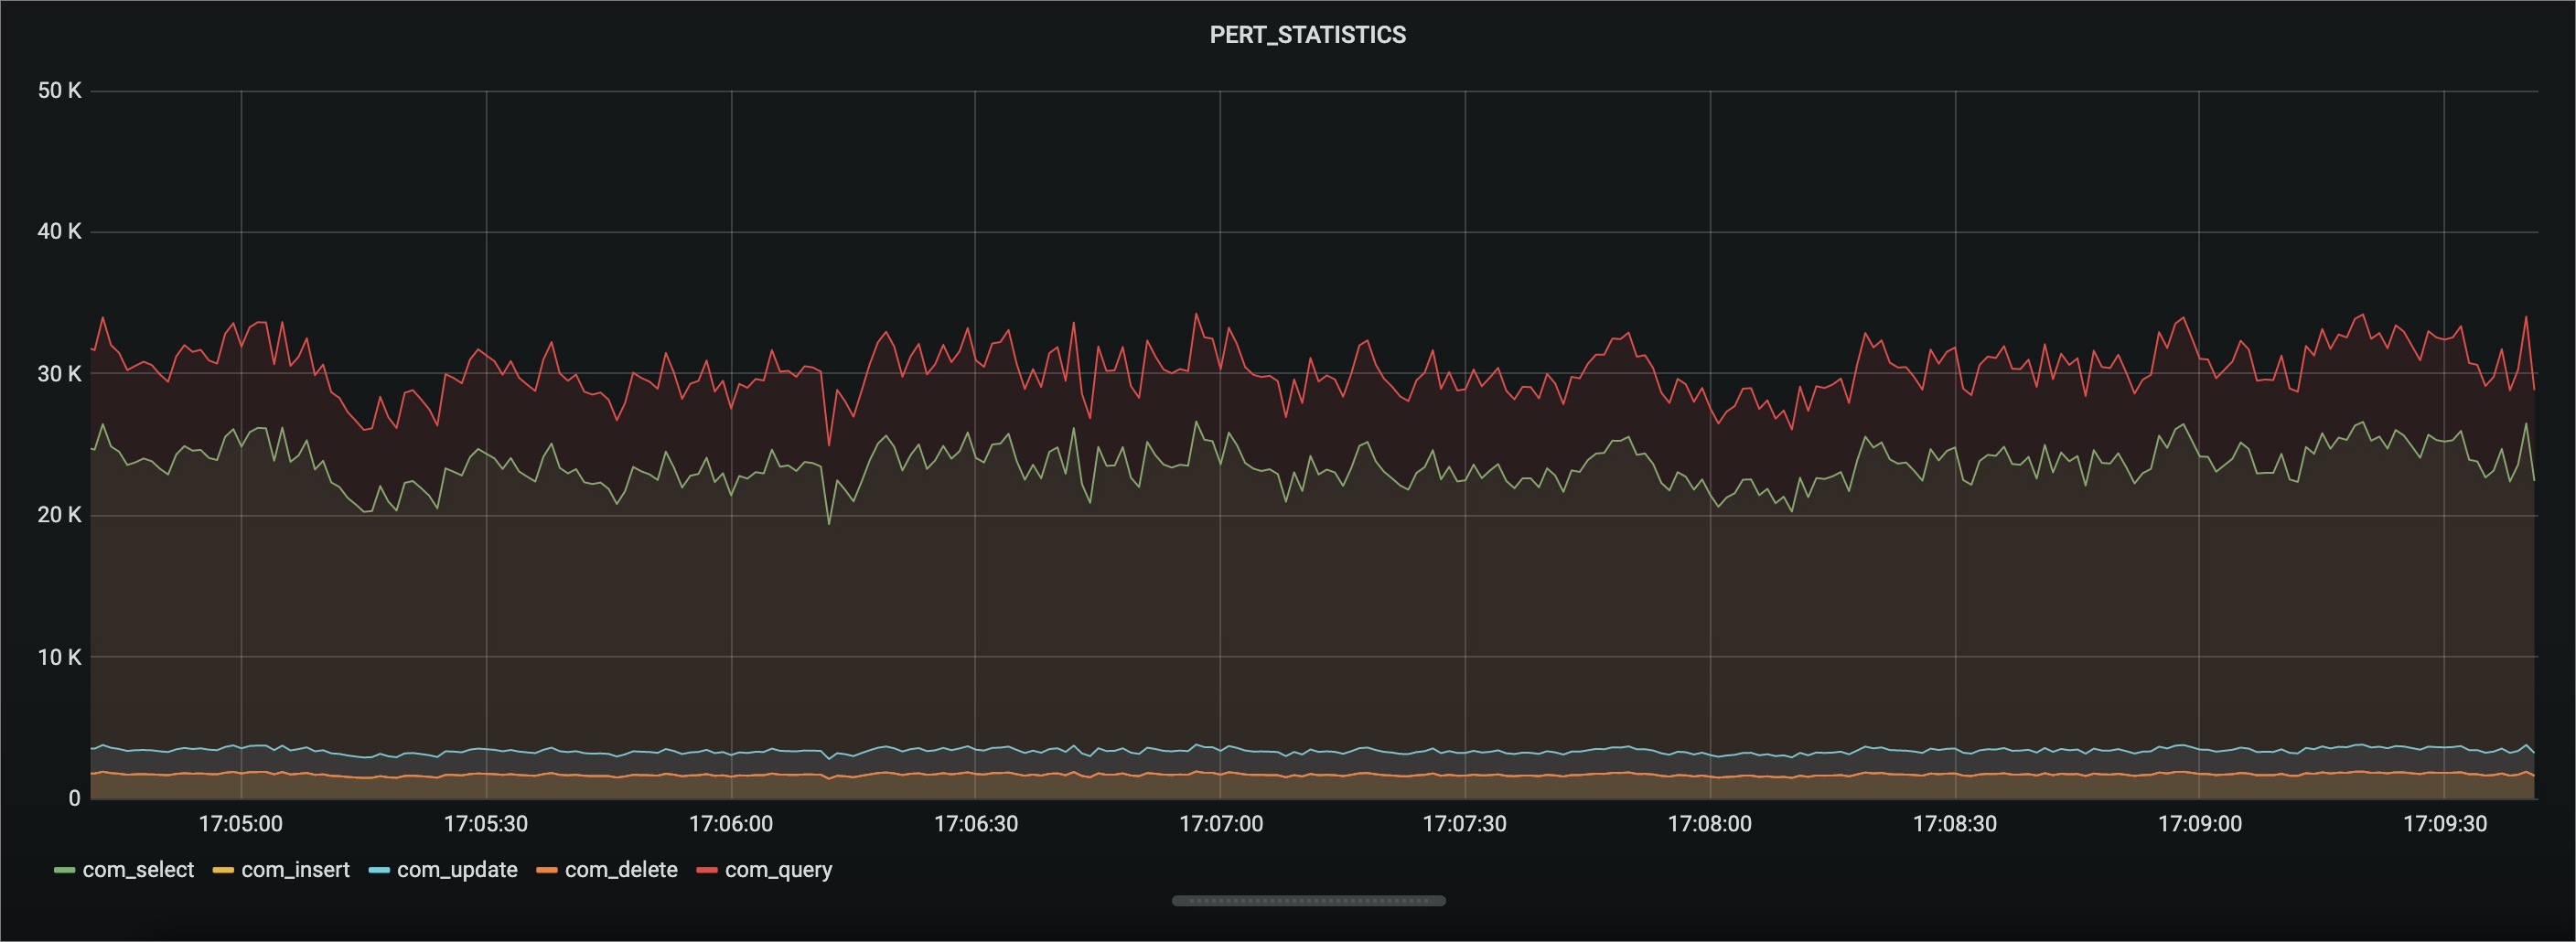
Connect to a monitoring platform, such as Grafana, to monitor performance in real time.