Configure monitoring rules for metrics and receive alert notifications when anomalies are detected.
This document is an introduction to Quick Tracking and technical integration and is not used as a sales basis. For specific products and technical services purchased by an enterprise, the commercial purchase contract shall prevail.
Overview
Monitoring Management consists of two modules: monitoring configuration and monitoring list. In monitoring configuration, you can view, modify, and delete monitoring rules. The monitoring list displays all alert messages triggered by monitoring rules, helping you stay informed of anomalous metric changes through configured notification channels.
Function introduction
Supported metrics:
1. Application type: application, view, and small stations
2. Analysis Model: event Analysis
3. Custom metrics and common metrics. Multiple metrics and multiple groups are supported.
To view metric monitoring settings and alert details, complete the following operations:
Touch channel settings
To enable monitoring alerts, you must first configure a touch channel. Go to 「Management Console」--「Organization List」--「Touch Channel」 to configure the channel. For more information, see Reach Channel.
Metric monitoring path
-
Event analysis chart in a visualization dashboard
-
Event analysis after saving the report
You can configure metric monitoring in dashboards and reports by navigating to 「Behavior Analysis」-「Statistics/analysis」.
In 「Statistics」, click the dashboard function key and choose 「Indicator Monitoring」 to open the monitoring configuration page. 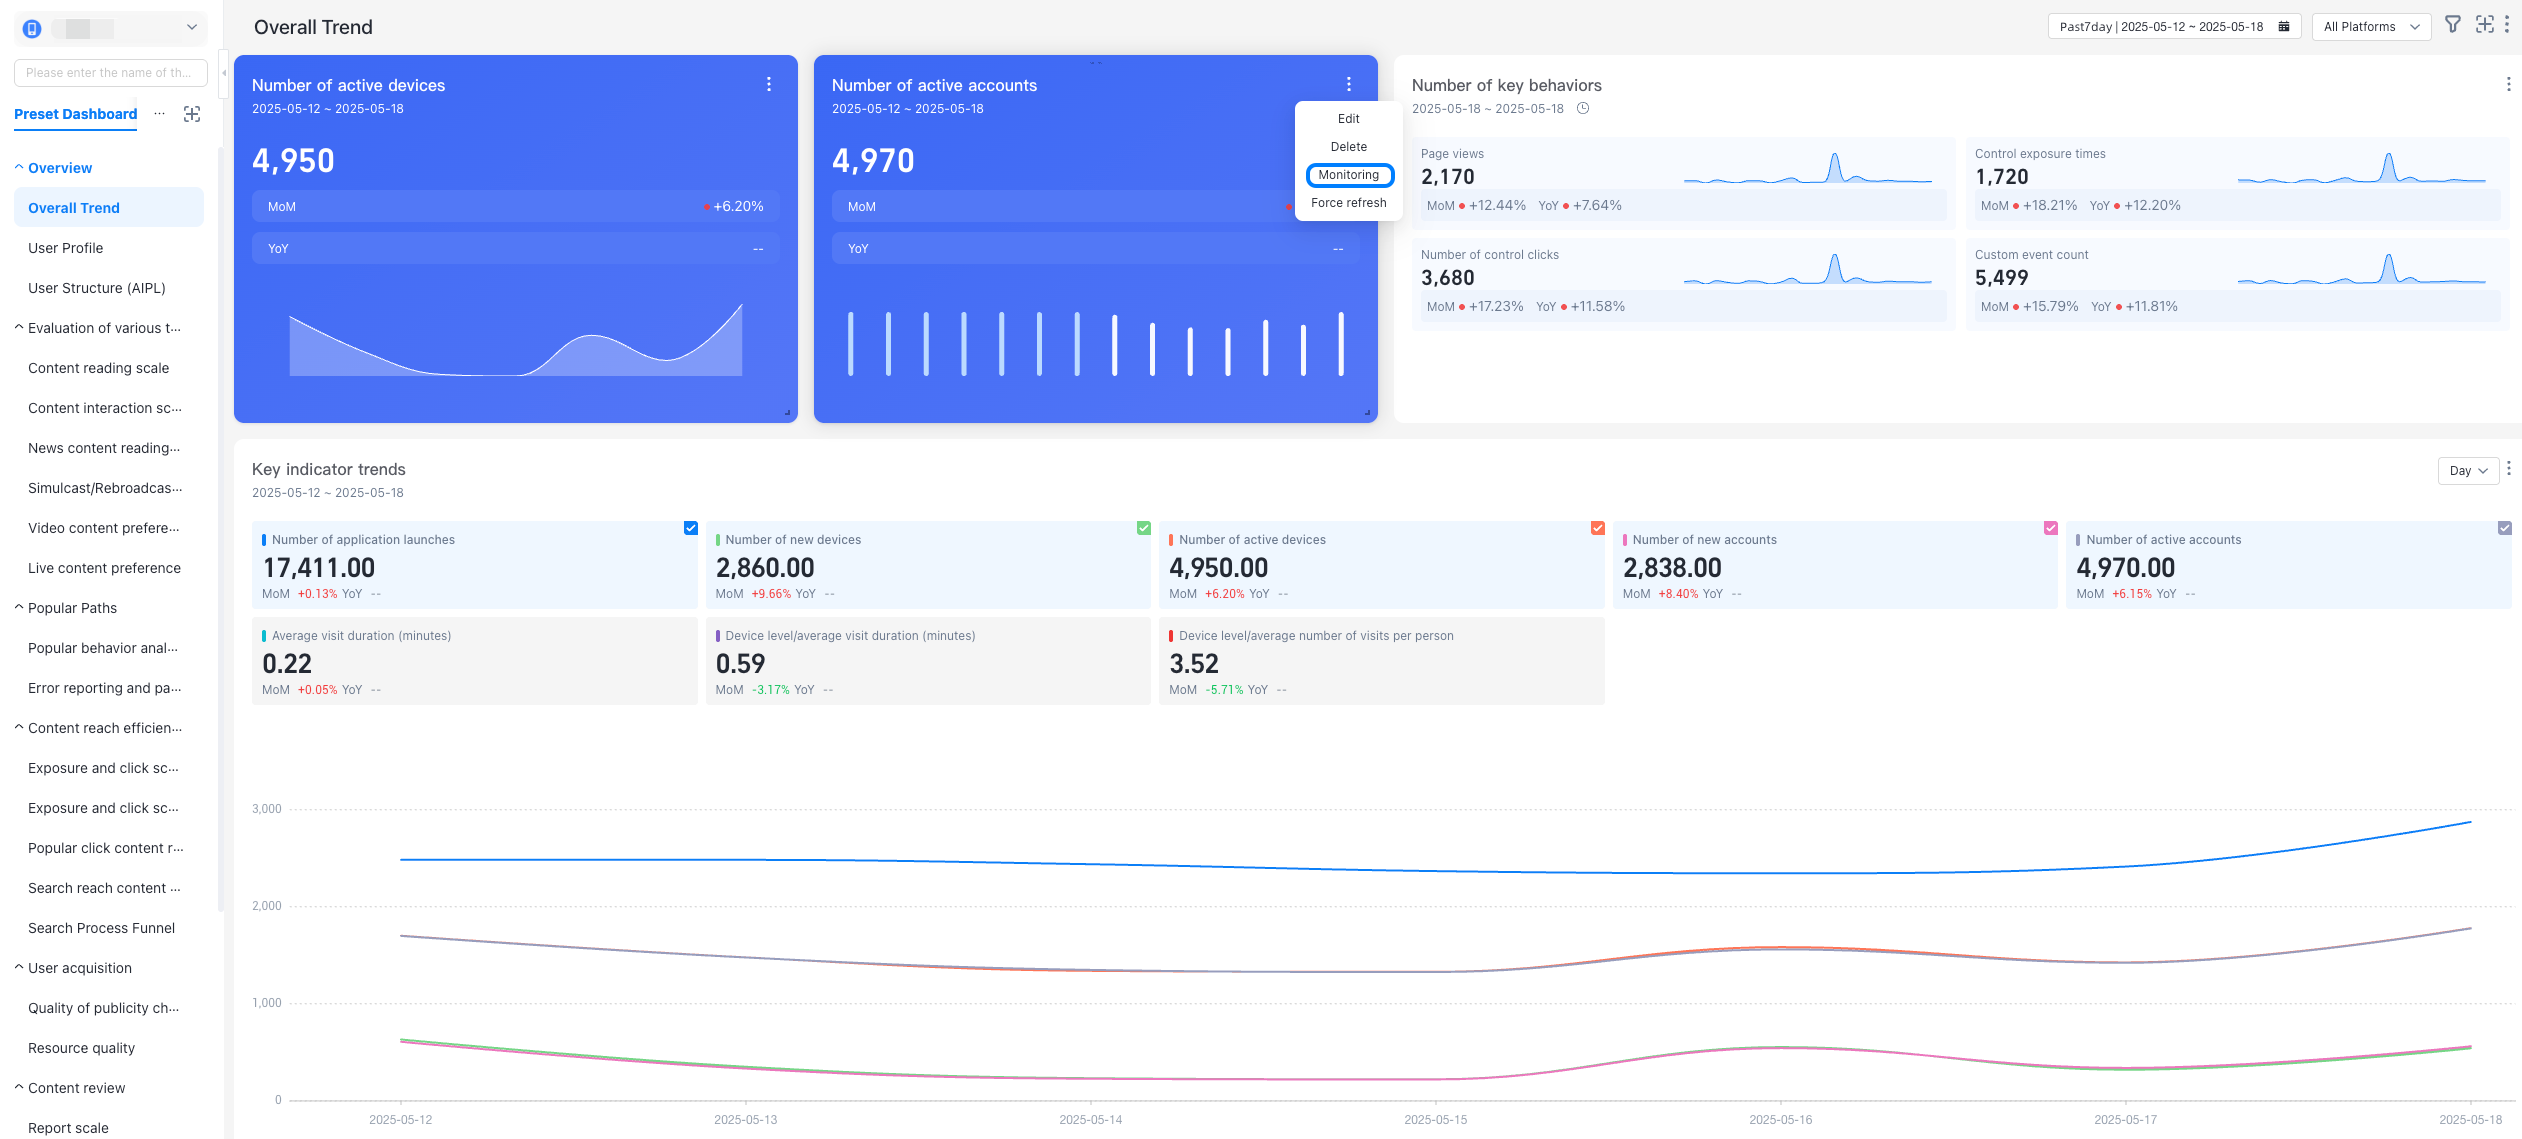
In 「Analysis」, click More in the upper-right corner of the behavioral insight ribbon and choose 「Metric Monitoring」 to create a monitoring configuration for the current analysis metric. 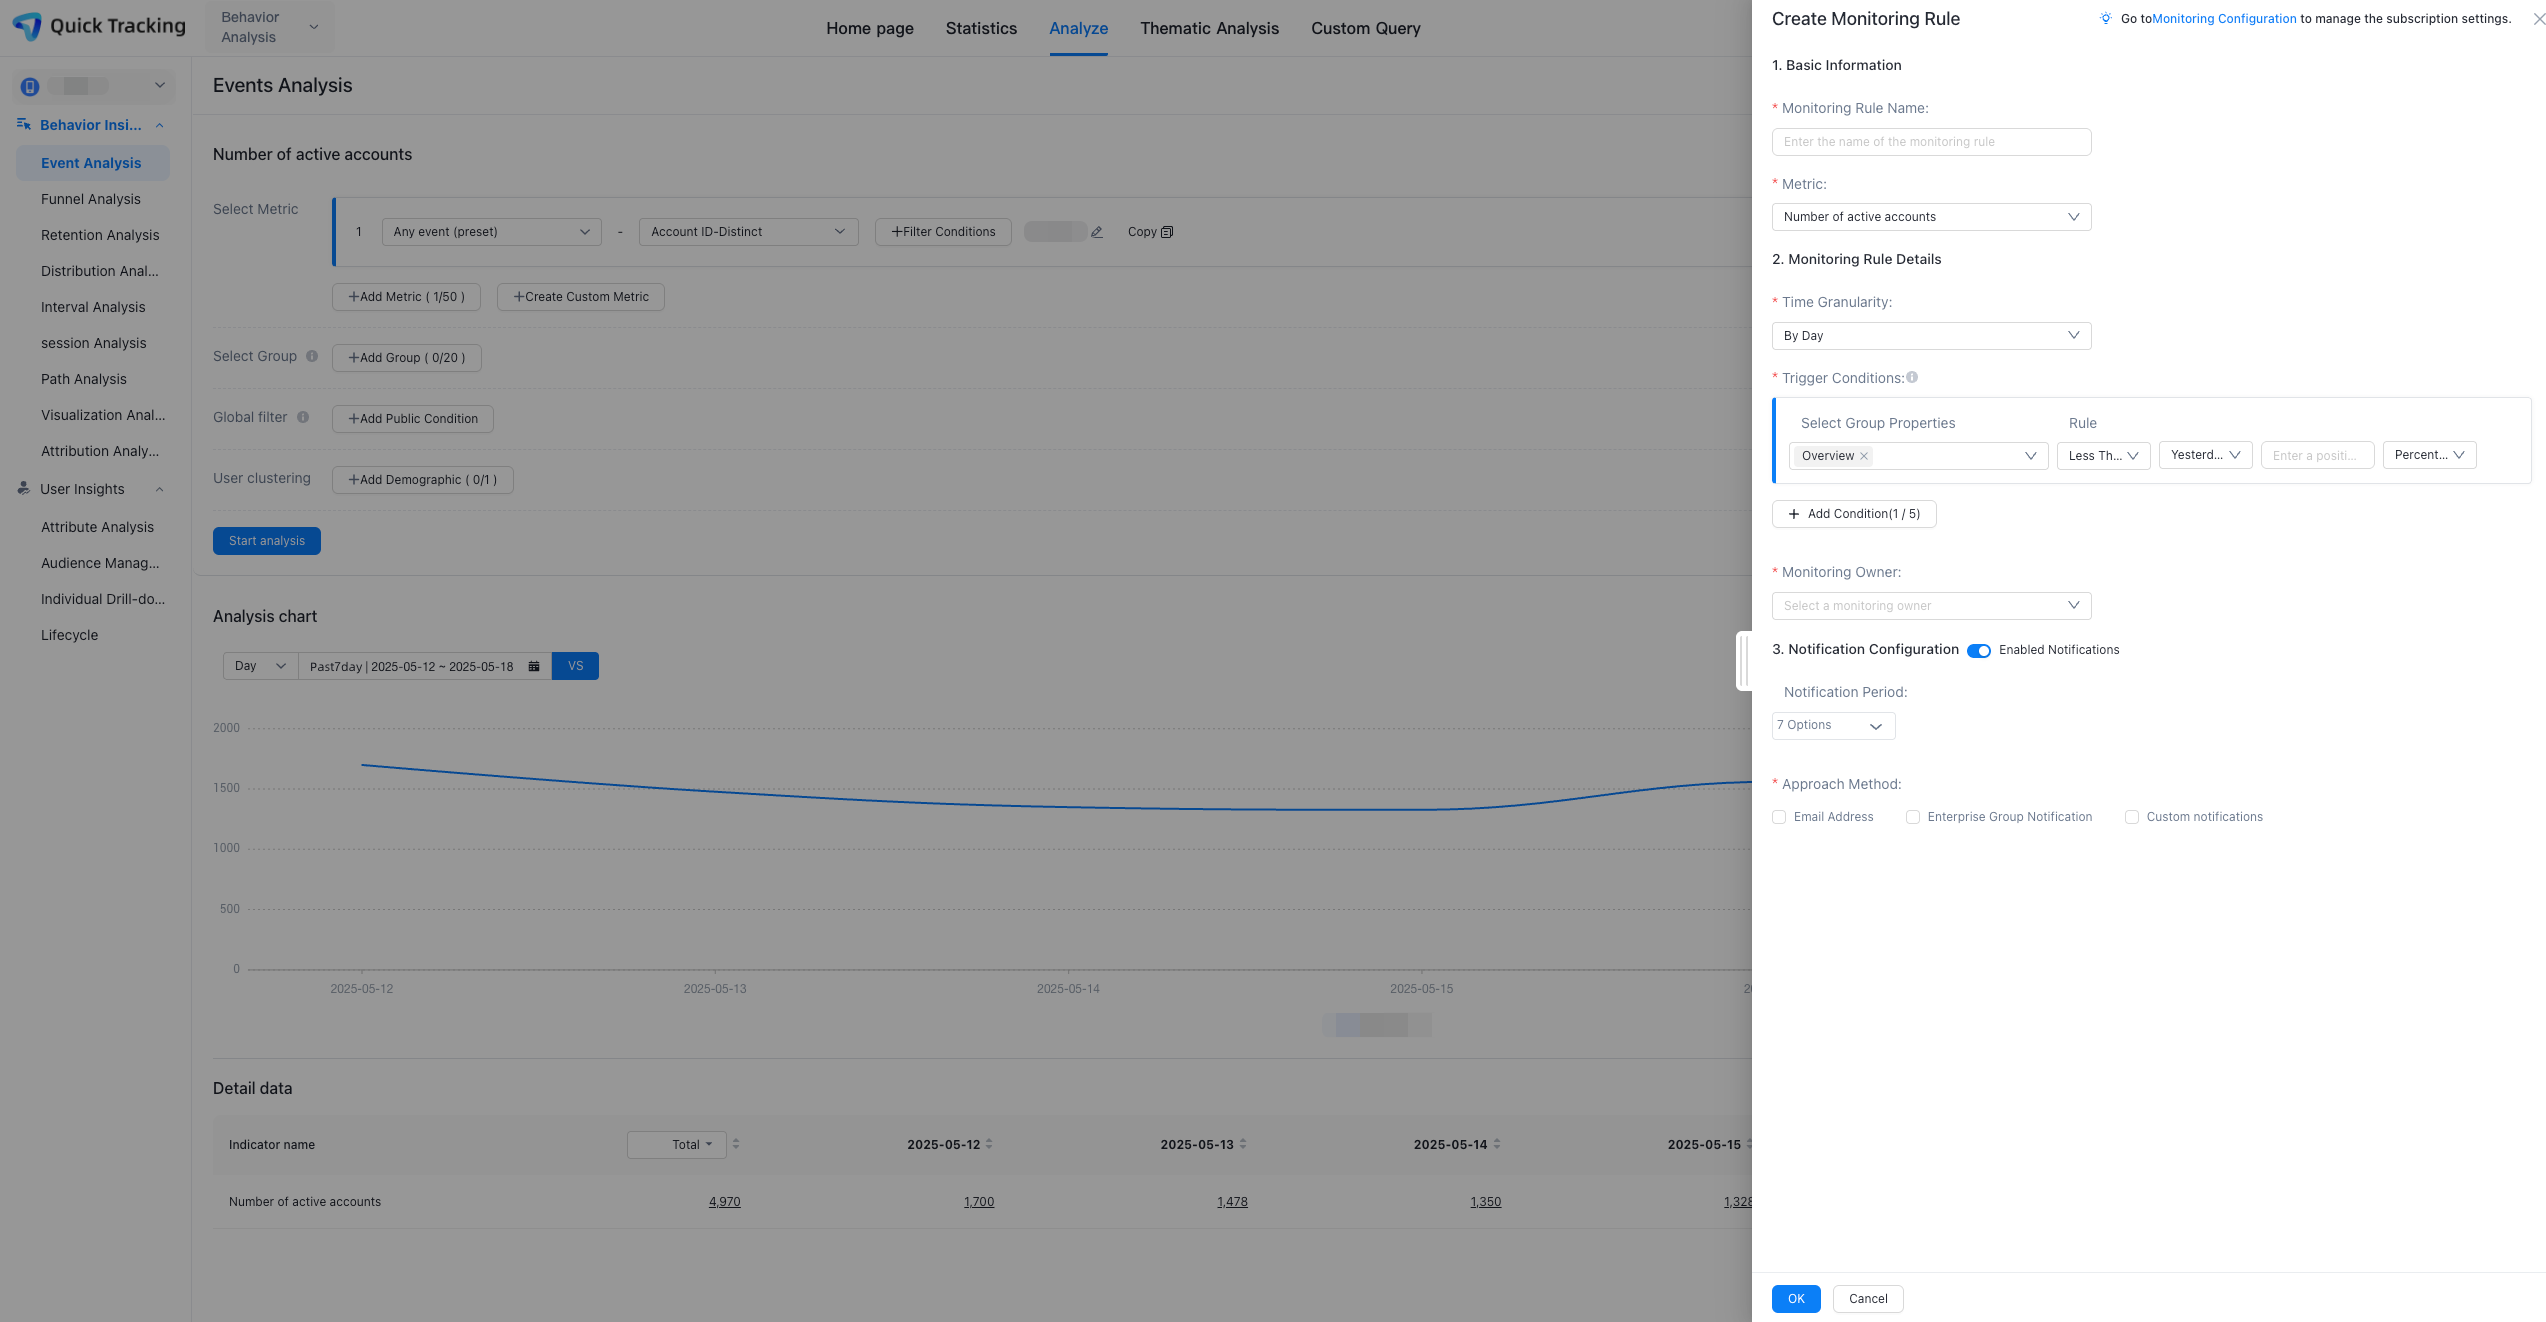
Create a monitoring configuration and touch mode 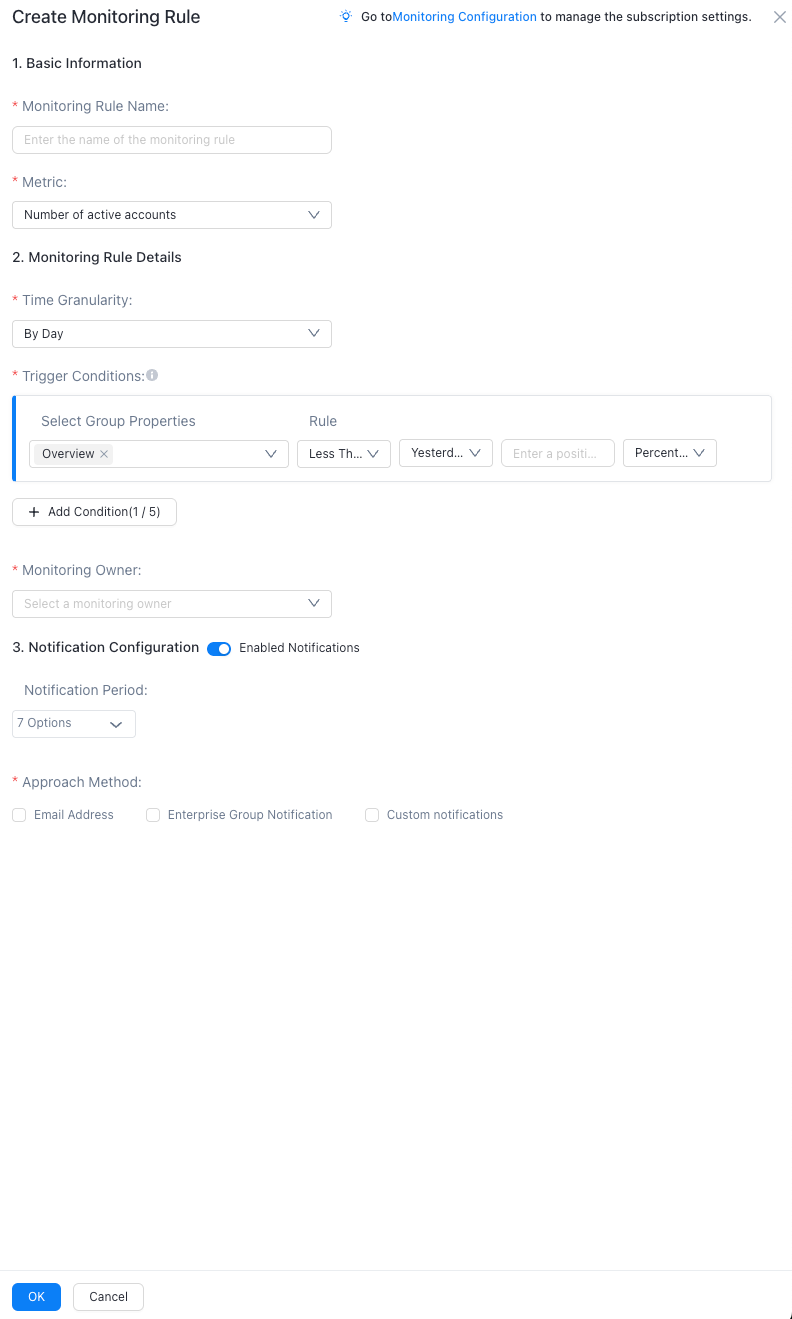
To create a monitoring project, provide the following information:
「Basic Information」
-
Monitoring name: The name can be customized and can contain up to 20 characters, digits, English,_()
-
Monitoring metric: the name of the metric in the event analysis. You can select it from the drop-down list.
「Monitoring Rules」
-
Time granularity: the granularity at which the monitoring is triggered.
By Hour: once per hour.
By Day: the value is calculated at 00:00 every day.
-
Trigger condition: After all conditions are triggered at the same time, the monitoring alert takes effect.
1. You can create five conditions, each of which is an "and" logic.
2. When you select a group attribute, the logical logic is 「Or」 between groups. If one group is met, the alert is triggered. The drop-down list is a second-level menu.
The first item of a level is fixed as 「Overall」, and the other items are the grouping attributes of this time. You can select only one item.
-
Monitoring owner: Specify an account as the owner of the monitoring configuration by selecting it from the drop-down list.
「Notification configuration」
-
Notification period: Alerts are evaluated every hour or at the end of each day. If the monitoring conditions are met within the notification period, the alert is sent. You can select one or more days from Monday to Sunday.
-
Touch method: Select Email Touch, Enterprise Group Notification, or both. After selecting an option, click the Send URL or Set Webhook link to complete the configuration.
「Monitoring Management Permissions」
-
You have the 「Behavior Analysition_Monitoring Management」 function and you are the person in charge of the monitoring. You can edit or delete the monitoring.
-
If you have 「Behavior Analysition_Subscription Management」and are the owner of a subscription, you can edit or delete the subscription.
Monitoring Management
You can view and manage monitoring metrics on the 「Behavior Analysis」 homepage under monitoring management. These metrics are created in 「Behavior Analysis」-「Statistics and Analysis」. 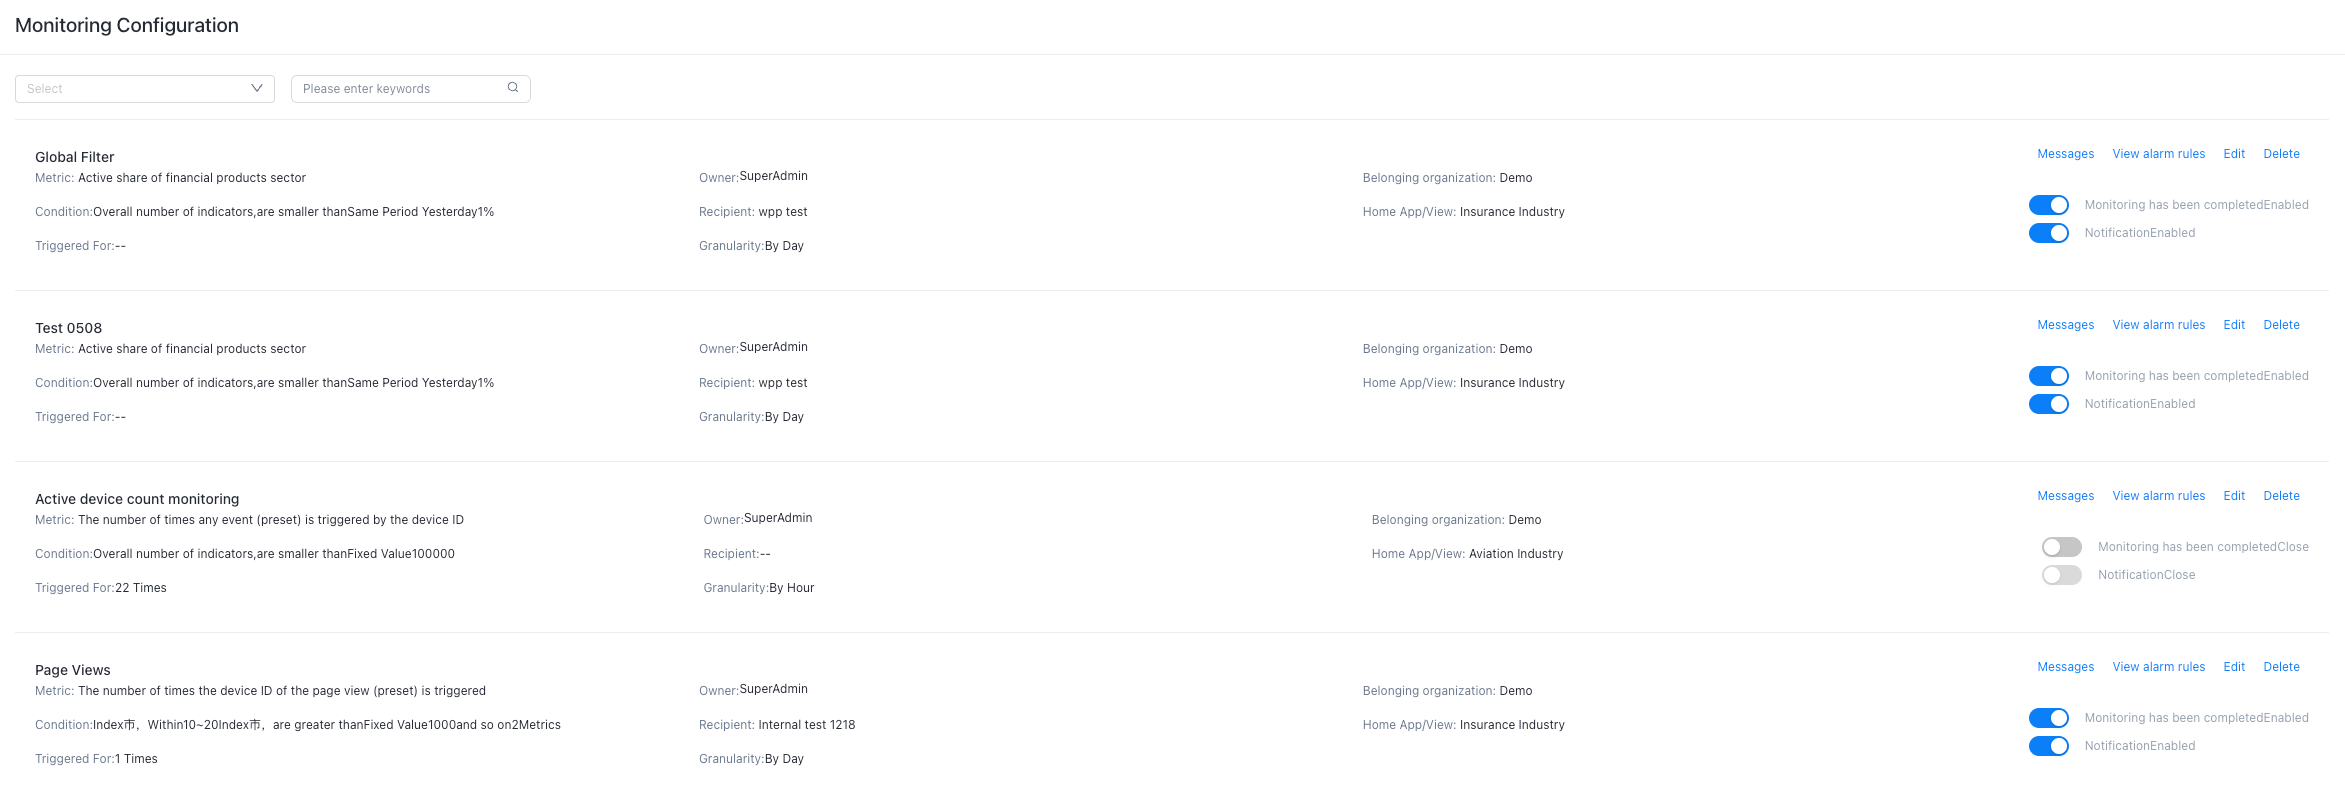
-
Monitoring configuration
This module displays all configured metric monitors. You can also edit and manage monitoring rules here.
The 「Monitor Configuration」 module consists of the following parts:
-
Organization filter: Filters monitoring data by organization. You can select all organizations or one or more specific organizations.
-
Application filter: Filters metrics by application or view. You can select all or one or more applications/views.
-
Monitoring configuration actions: Click 「Edit」 to modify the current monitoring configuration. Click 「Message List」 to go to the 「Monitoring List」 page and view alert messages for this metric. Click 「Delete」 to permanently remove the monitoring configuration. This action cannot be undone.
-
Notifications on: Enable or disable notifications for the current metric monitoring configuration.
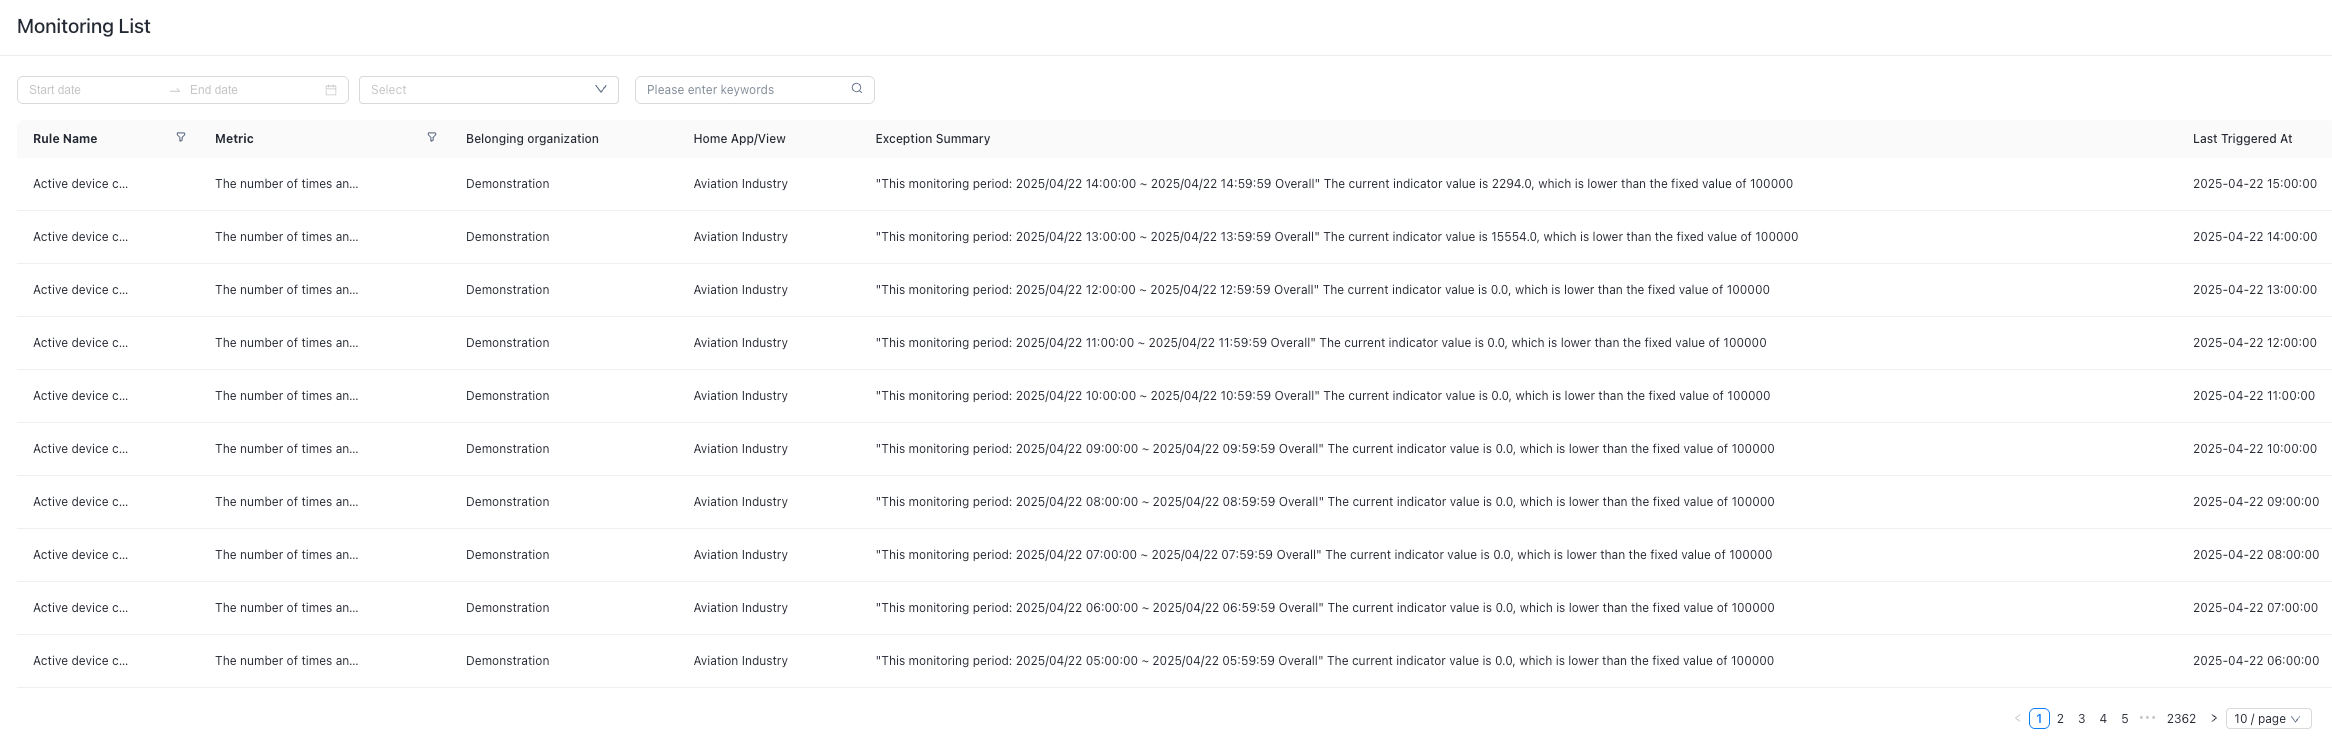
2. Monitoring list
The monitoring list displays alert details triggered when the specified monitoring conditions are met. You can filter by time, organization, application, and monitoring name.