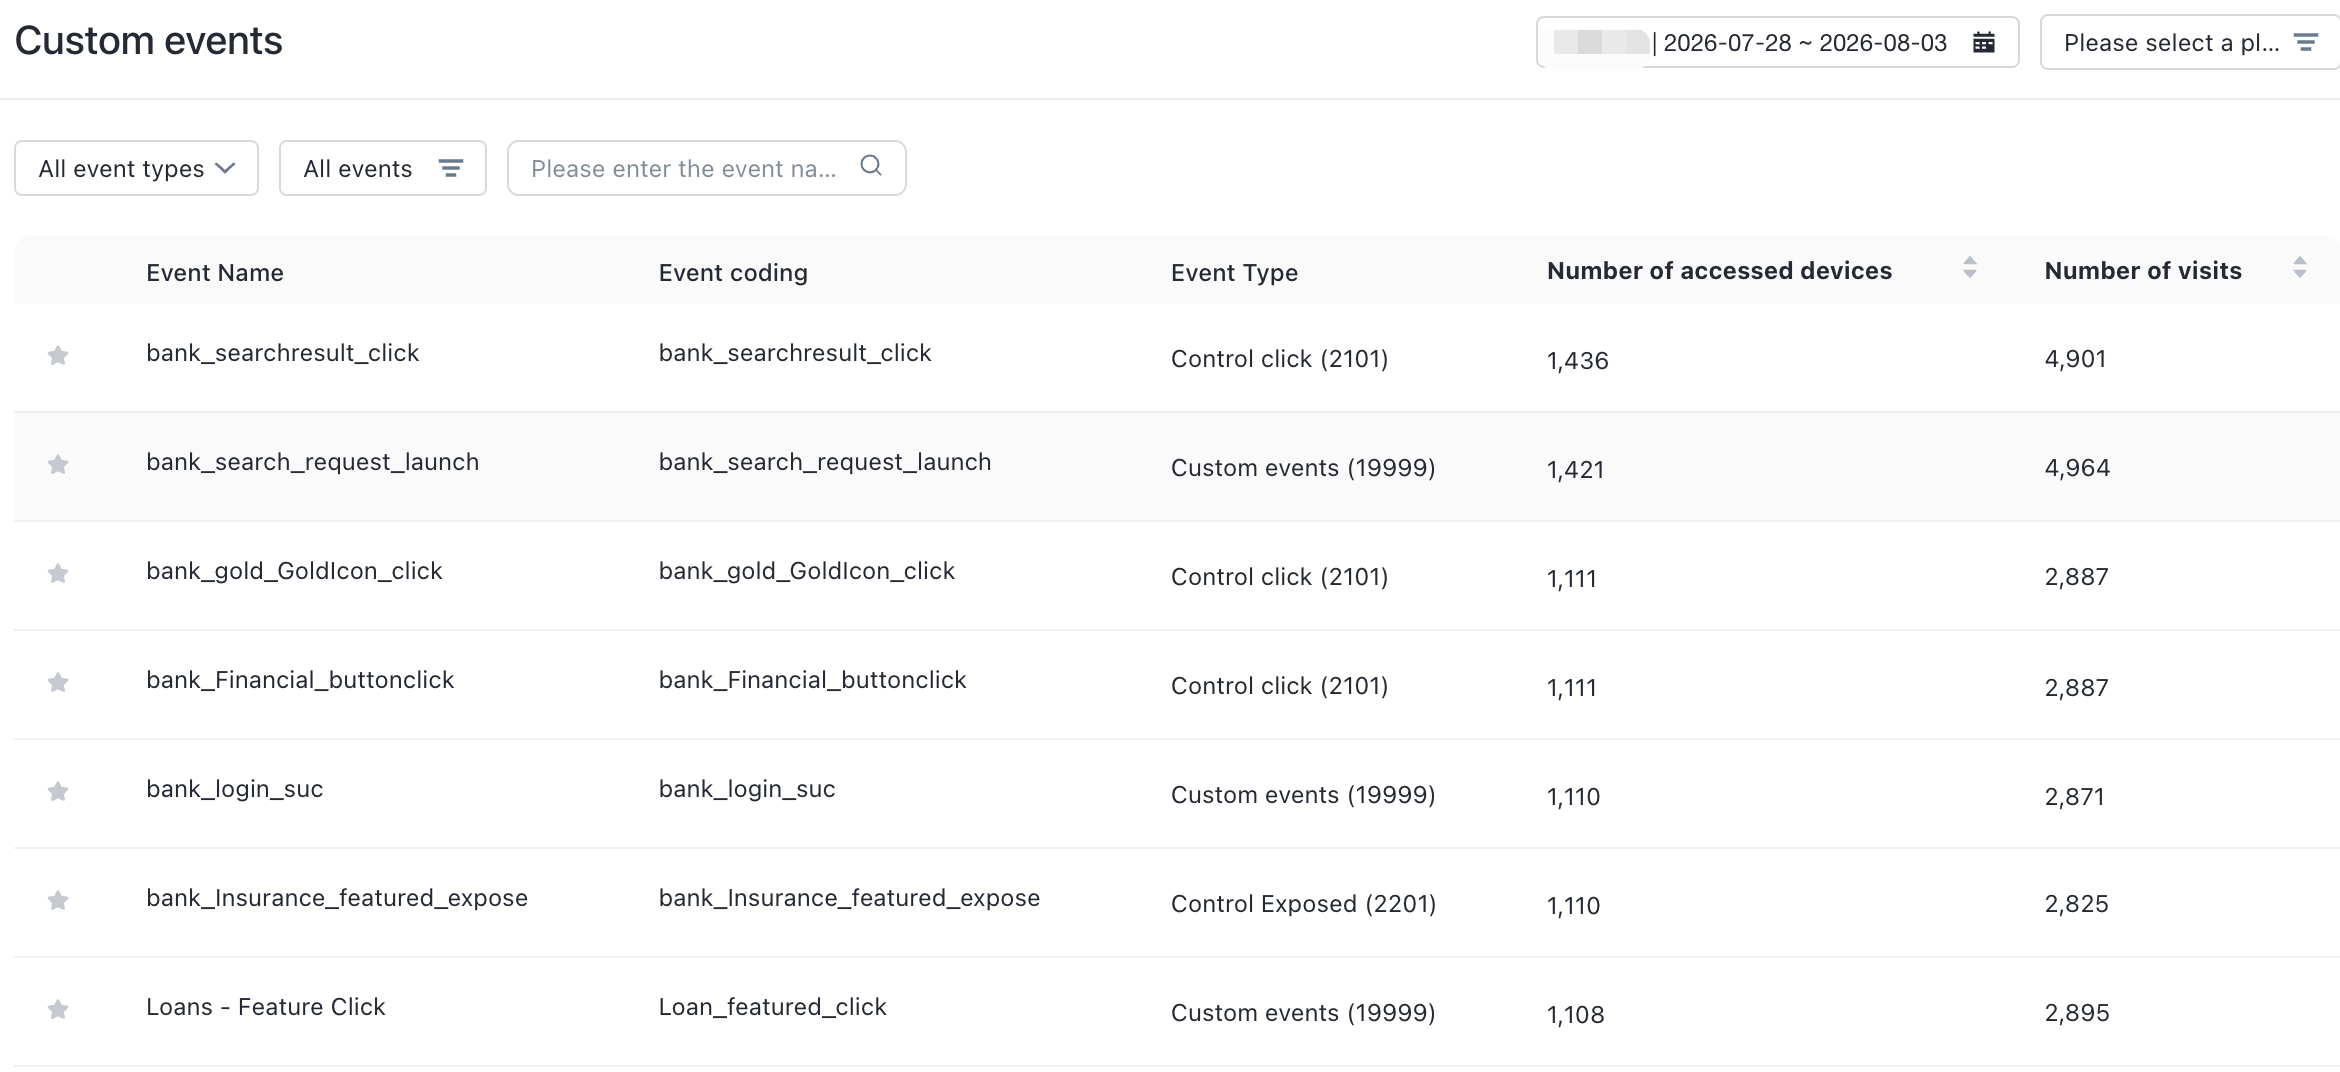
For web applications, Quick Tracking provides eight preset basic billboards: Overall Trends, Time-sharing Insight, New Users, Active Users, Retained Users, Device Terminals, Pages, and Custom Events. The following table describes the metrics and calculation criteria of each dashboard.
Note that all kanban boards preset by the system will be marked with the mark created by the system. 
Overall Trend
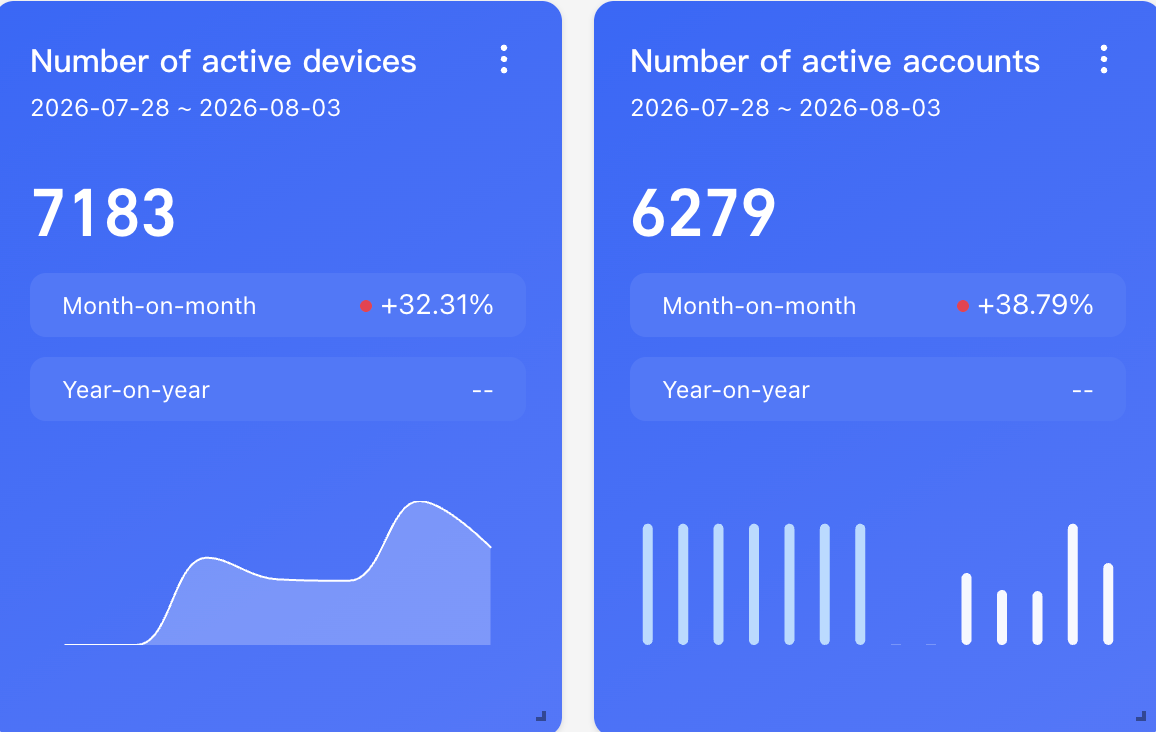
The overall overview dashboard includes 10 reports, namely, the number of active devices, the number of active accounts, the number of key behaviors, and the trend of key indicators. In the past 30 days, the trend of key indicators, event codes, the number of page browsing devices, event codes, the number of control clicking devices, event codes, the number of custom event devices, new devices, access retention, and active devices, access retention, you can quickly understand the overall data of the Web. The following is an interpretation of the calculation caliber of these four reports one by one.
Number of active devices and accounts
Number of devices and accounts with any behavior in the selected time
Calculate the same comparison rule
Ring period indicator value-previous period indicator /previous period indicator value
Year-over-year=(current period-same period) /same period
Current Time Granularity | Ring comparison | YoY |
By Hour | Compare with last hour | Compared to the same period yesterday. |
By Day | Compared to yesterday. | Compared to the same period last week |
By Week | Compared to last week. | Compared with the same period last month |
By Month | Compare with last month | Compared with the same period last year |
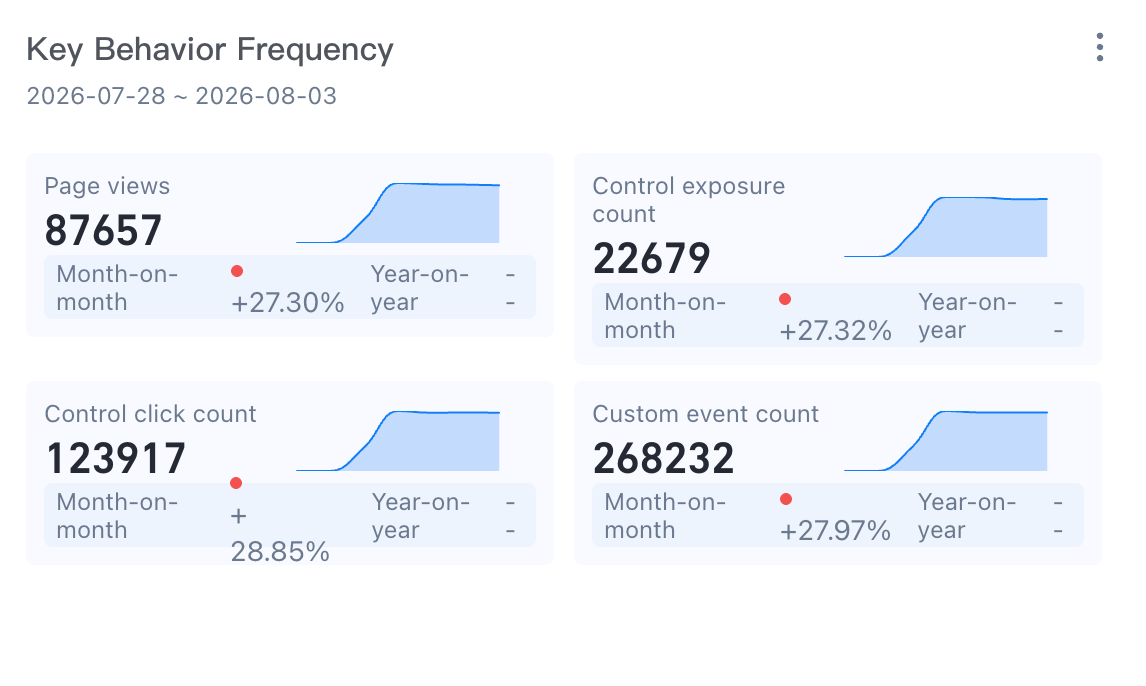
Number of key behaviors
Page Views: The number of device IDs that triggered page view events during the selected time.
Control Exposure Times: the number of device IDs that triggered the page control exposure event during the selected time.
Control Clicks: The number of device IDs that triggered the control click event during the selected time.
Custom Events: the number of device IDs that trigger any event and whose system property event type is equal to the custom event within the selected time.
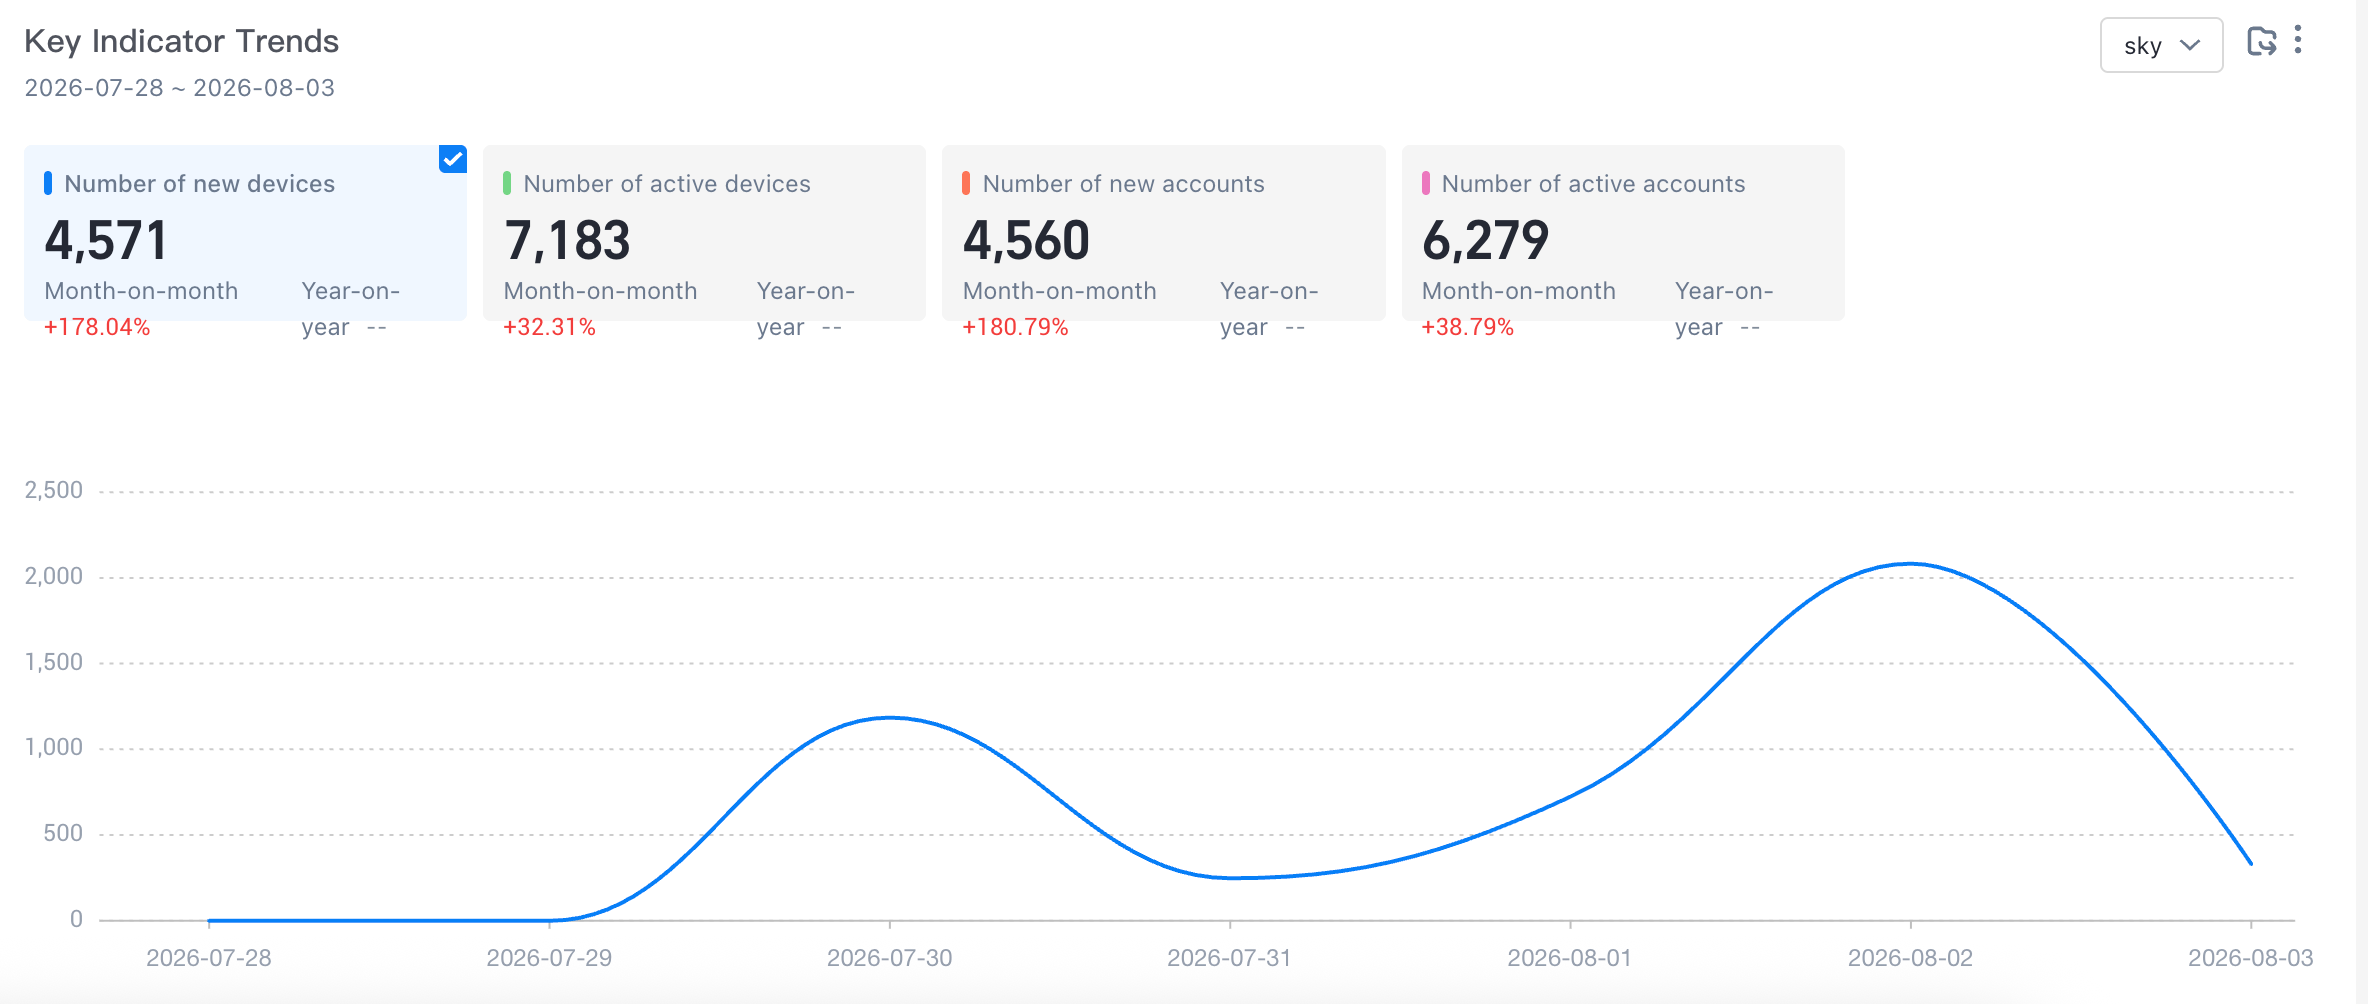
Key Metrics Trends
Number of new devices: the number of deduplication of device IDs that triggered any event within the selected time, and the system property device started on the first day.
Number of Active Devices: the number of deduplication of device IDs that triggered any event within the selected time.
Number of new accounts: the number of account IDs that trigger any event within the selected time, and the system attribute account is logged on on the first day.
Number of Active Accounts: the number of account IDs that trigger any event within the selected time.
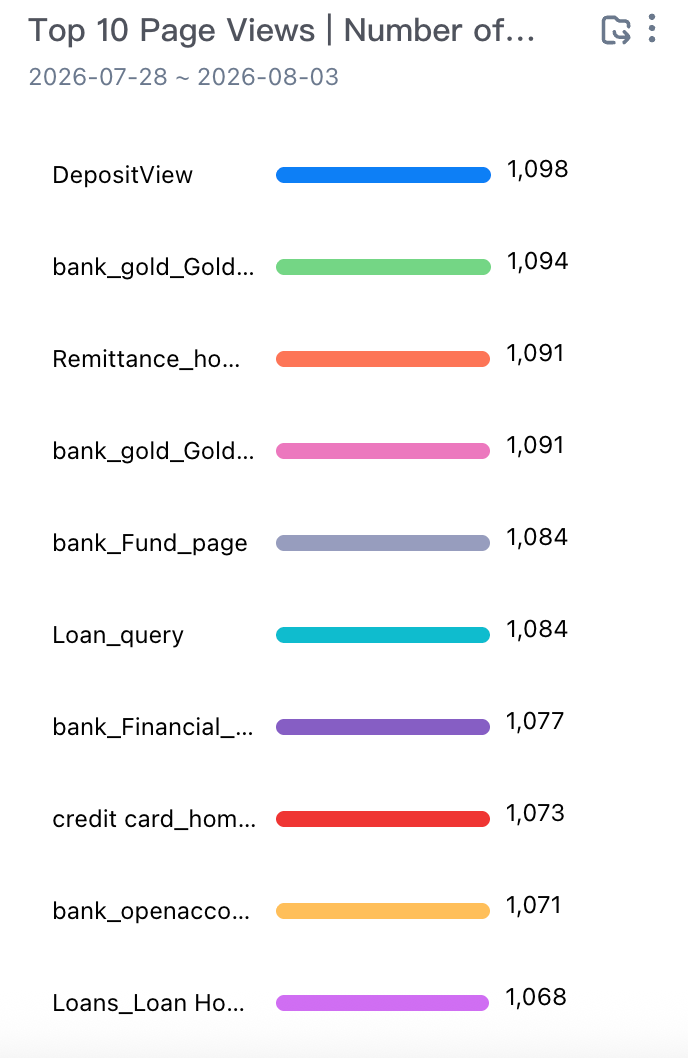
TOP10 Page Browsing, Number of Devices
Event Code: the page browsing event triggered by the user within the selected time. The display logic displays the event name as the event name entered, and displays the event code if the event name is not entered.
Devices: The number of devices that triggered the pageview event during the selected time
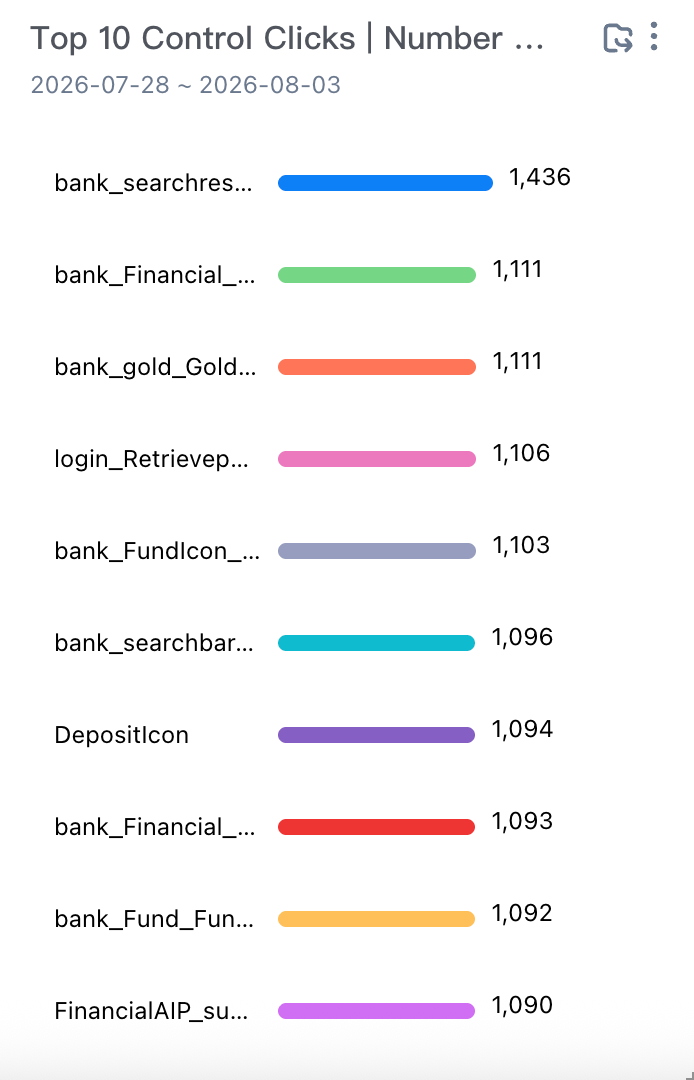
TOP 10 Control Click-Device Number
Control Name: the code of the event that triggers the click type of the control within the selected time. The display logic displays the event name as the input event name, and displays the event code if no event name is input.
Number of Devices: The number of devices that triggered the control click event during the selected time
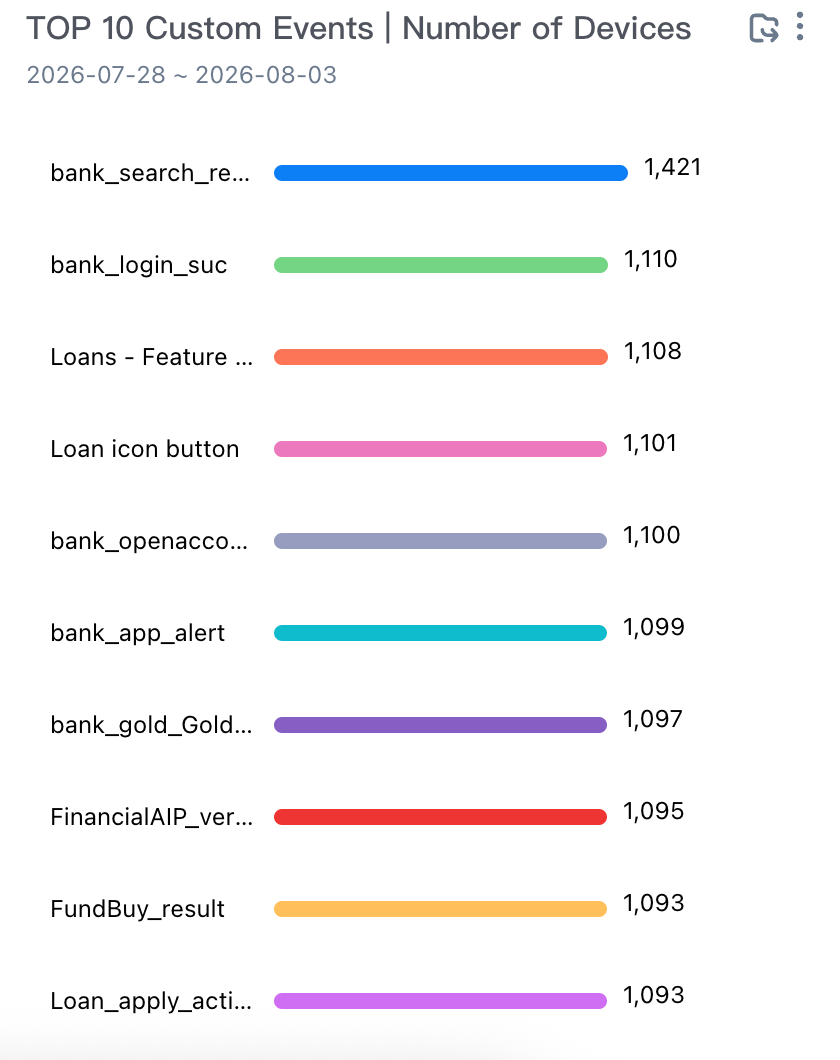
TOP 10 Custom Events and Number of Devices
Event Code: the event code of any event whose trigger event type is equal to the custom event within the selected time. The display logic displays the event name as the event name entered. If no event name is entered, the event code is displayed.
Devices: the number of devices that triggered the custom event during the selected time.
New /active devices, access retention
The retention analysis includes two reports of active user retention and new user retention. Through these two reports, you can quickly know the overall user stickiness of the application and the quality of new users. 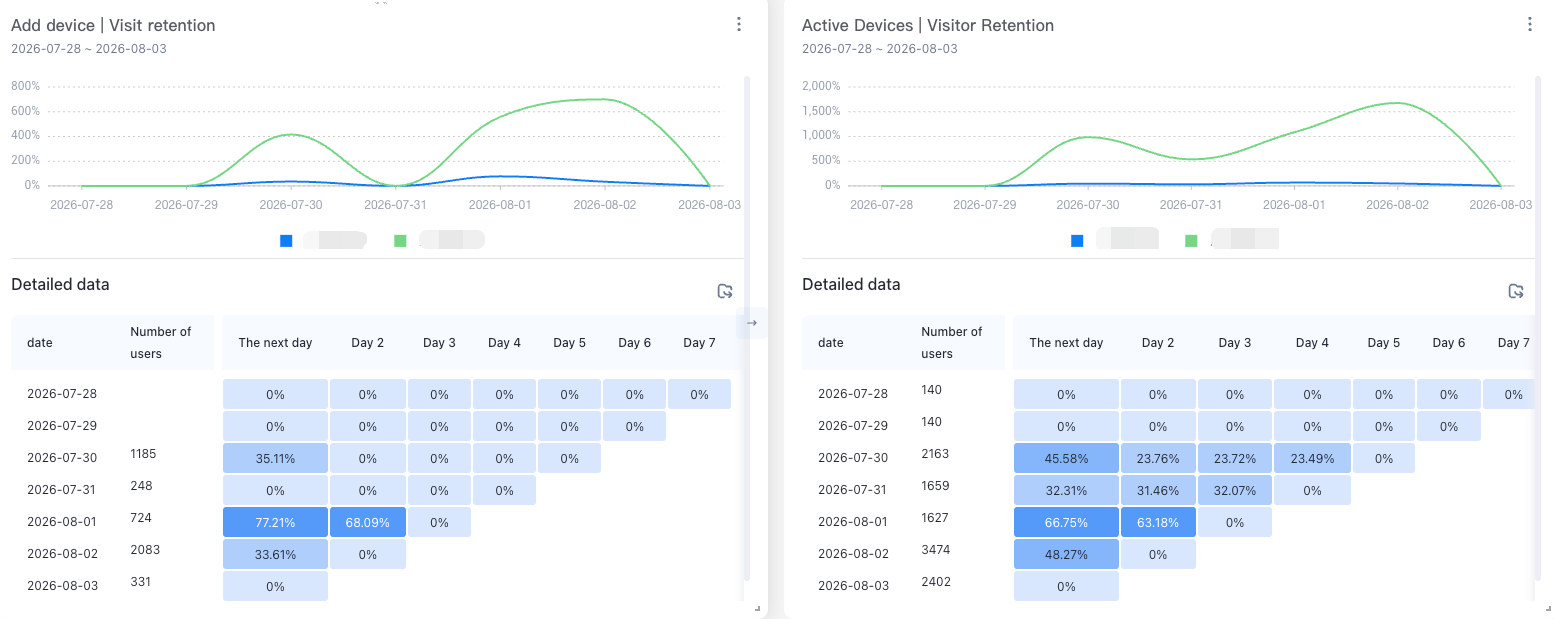
Active User Retention
Number of active users: the number of devices that triggered any event on the Tth day (week or month).
Retention rate: Number of active users on day T and active again on day T + N (week or month) /Number of active users on day T * 100%.
New User Retention
New users: The number of devices that triggered any event for the first time in history on day T (week or month).
Retention rate: new users on day t, number of active users on day t + n (week or month) /number of new users on day t (week or month) * 100%.
Time-sharing insights
The time-sharing insight board includes four reports: new and active trends, number of key behaviors, comparison of new and old devices and active trends, TOP 10 behavior events and number of devices. Through this board, you can gain insight into users and APP indicators.
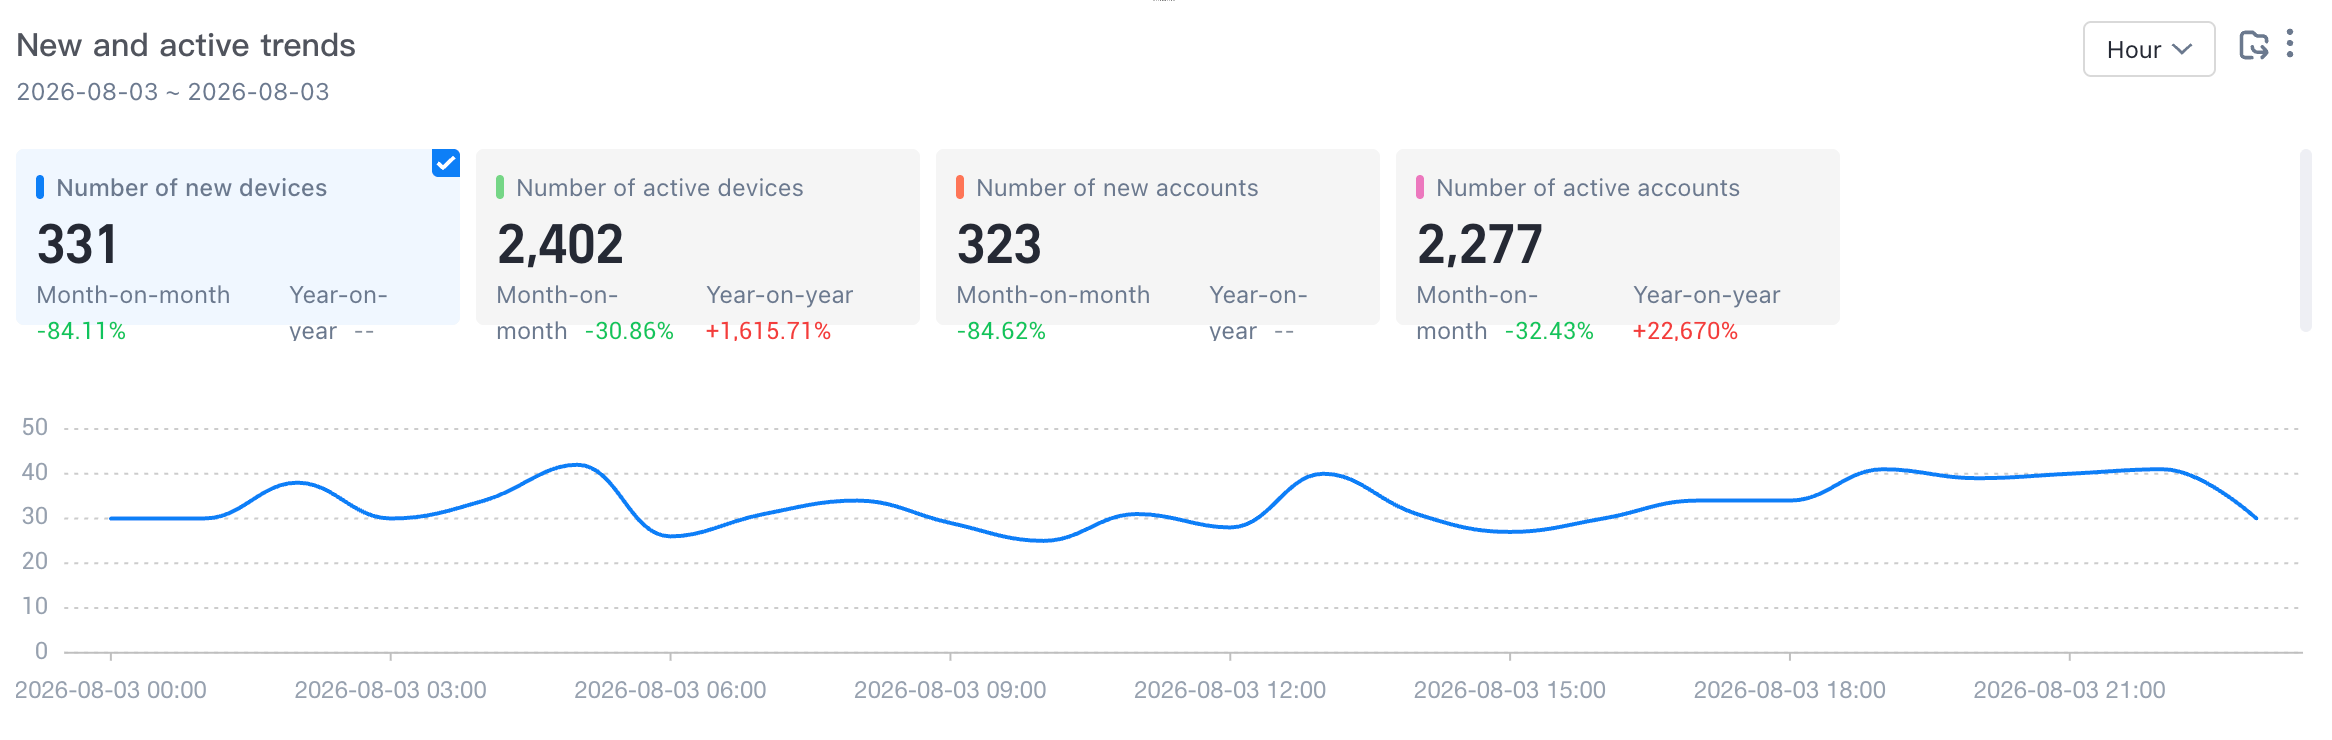
New and active trends
Number of new devices: the number of deduplication of device IDs that triggered any event within the selected time, and the system property device started on the first day.
Number of Active Devices: the number of deduplication of device IDs that triggered any event within the selected time.
Number of new accounts: the number of account IDs that trigger any event within the selected time, and the system attribute account is logged on on the first day.
Number of Active Accounts: the number of account IDs that trigger any event within the selected time.
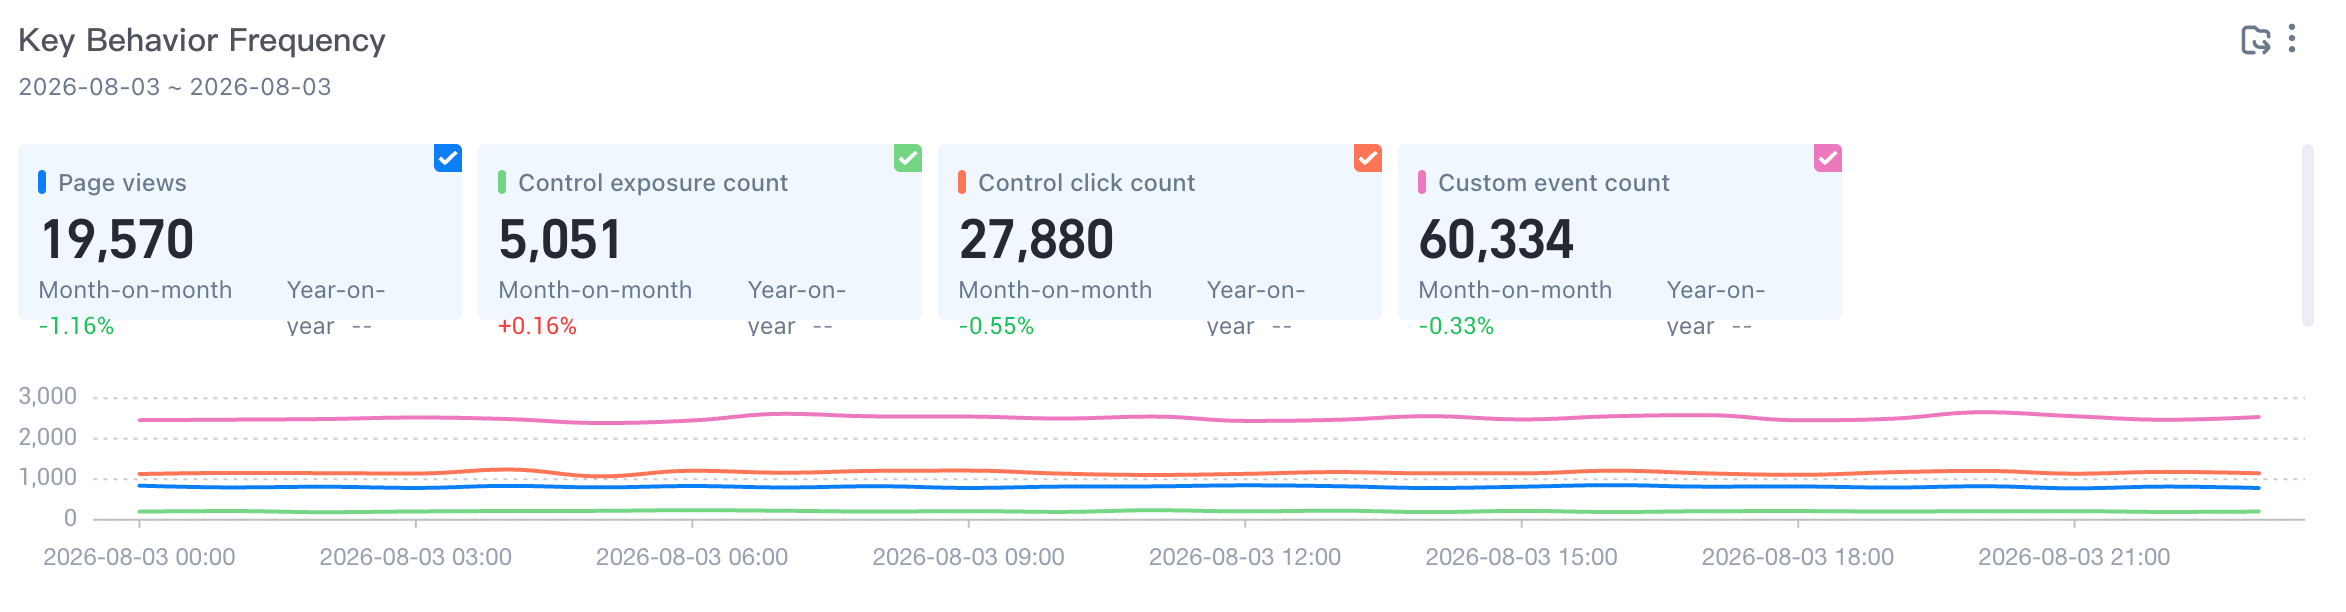
Number of key behaviors
Page Views: The number of device IDs that triggered page view events during the selected time.
Control Exposure Times: the number of device IDs that triggered the page control exposure event during the selected time.
Control Clicks: The number of device IDs that triggered the control click event during the selected time.
Custom Events: the number of device IDs that trigger any event and whose system property event type is equal to the custom event within the selected time.
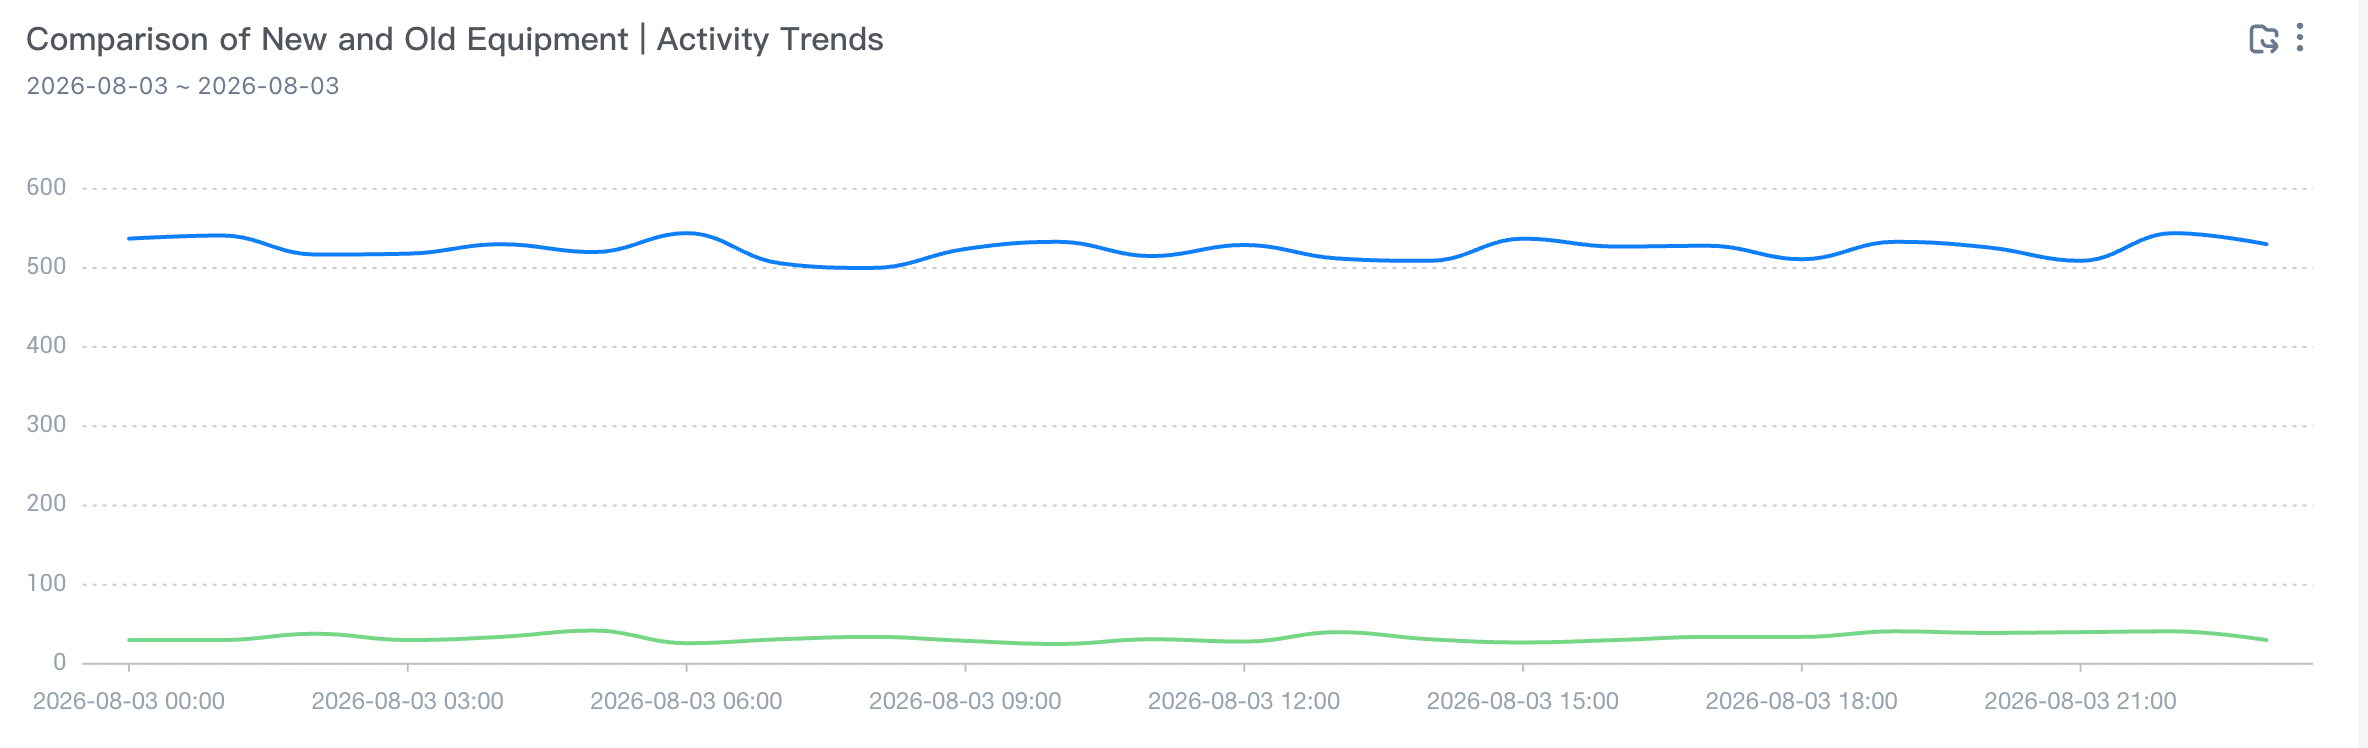
New and old equipment, active trend comparison
Active Devices: The number of device IDs that triggered any event during the selected time.
Number of new devices: During the selected time, the application startup event is triggered and the device starts on the first day.
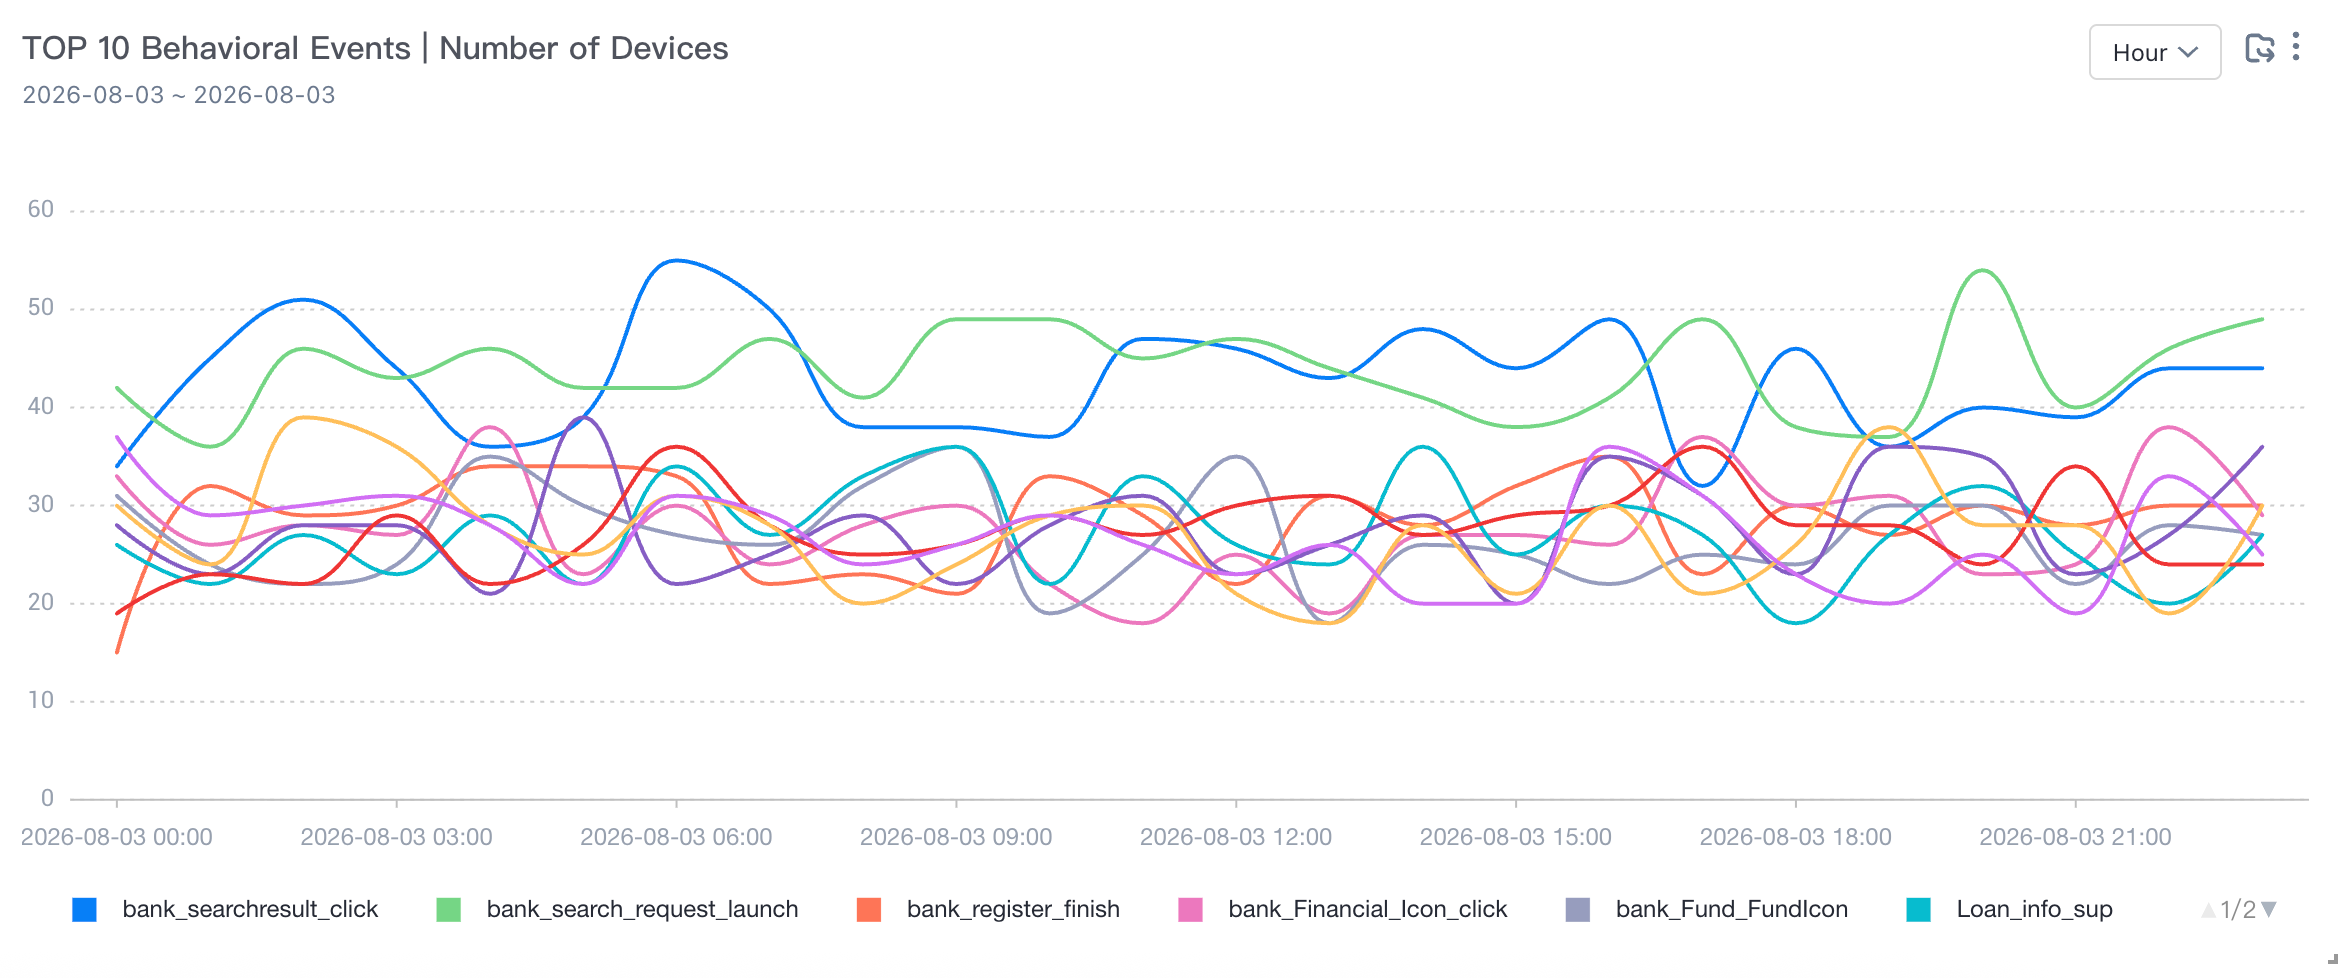
TOP 10 behavior events and devices
Event Code: any preset system event triggered by the user within the selected time. The display logic displays the event name as the entered event name, and displays the event code if the event name is not entered.
Devices: The number of devices that triggered the pageview event during the selected time
Add a user
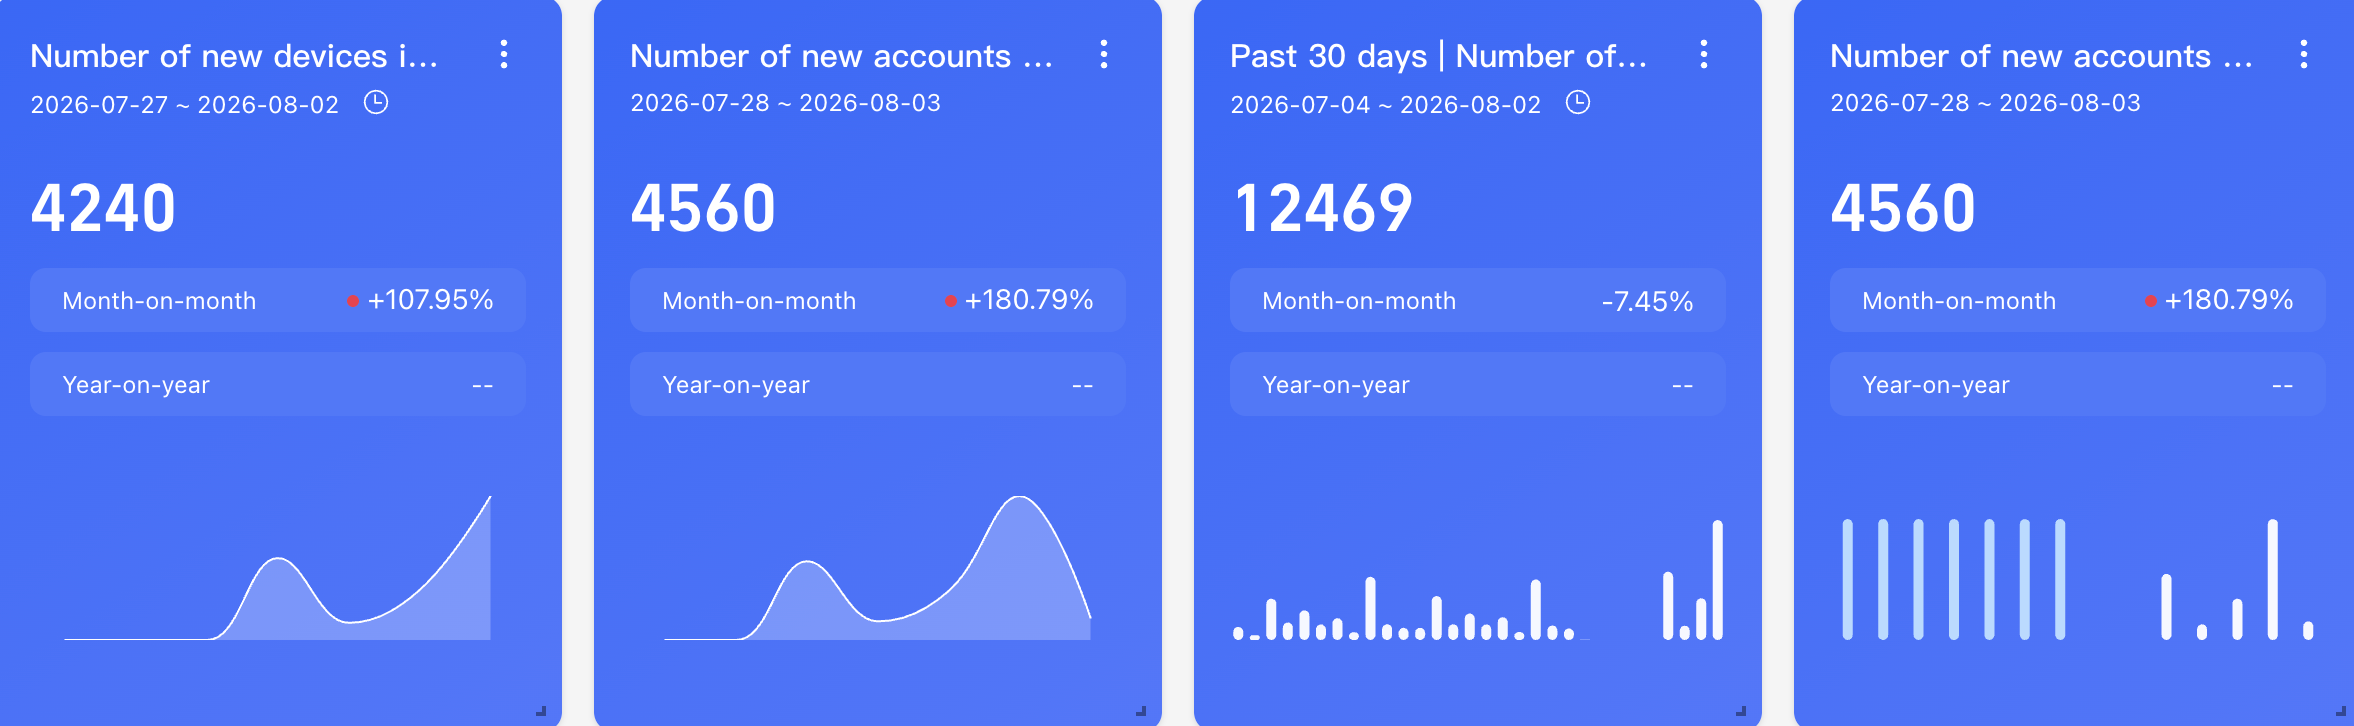
New user billboard, including nine reports: number of new devices in the past 7 days, number of new accounts in the past 7 days, number of new devices in the past 30 days, number of new accounts in the past 30 days, proportion of new user trends, TOP 10 page browsing, number of new devices, TOP 10 control click, number of new devices, TOP 10 custom events, number of new devices, add devices | Access retention, this dashboard allows you to quickly learn about new user trends and popular behavior data.
Number of new devices and accounts in the past 7/30 days
Number of devices and accounts added in the last 7 days or 30 days
Calculate the same comparison rule
Ring period indicator value-previous period indicator /previous period indicator value
Year-over-year=(current period-same period) /same period
Current Time Granularity | Period-over-period | interval-valued comparison |
By Hour | Compare with last hour | Compared to the same period yesterday. |
By Day | Compared to yesterday. | Compared to the same period last week |
By Week | Compared to last week. | Accumulation of the same period last month |
By Month | Compare with last month | Compared with the same period last year |
Number of new accounts: the number of account IDs that triggered any event in the past 7/30 days, and the system attribute account logged on on the first day
Number of new devices: the number of deduplication of device IDs that triggered any event in the past 7/30 days, and the system property device started on the first day.
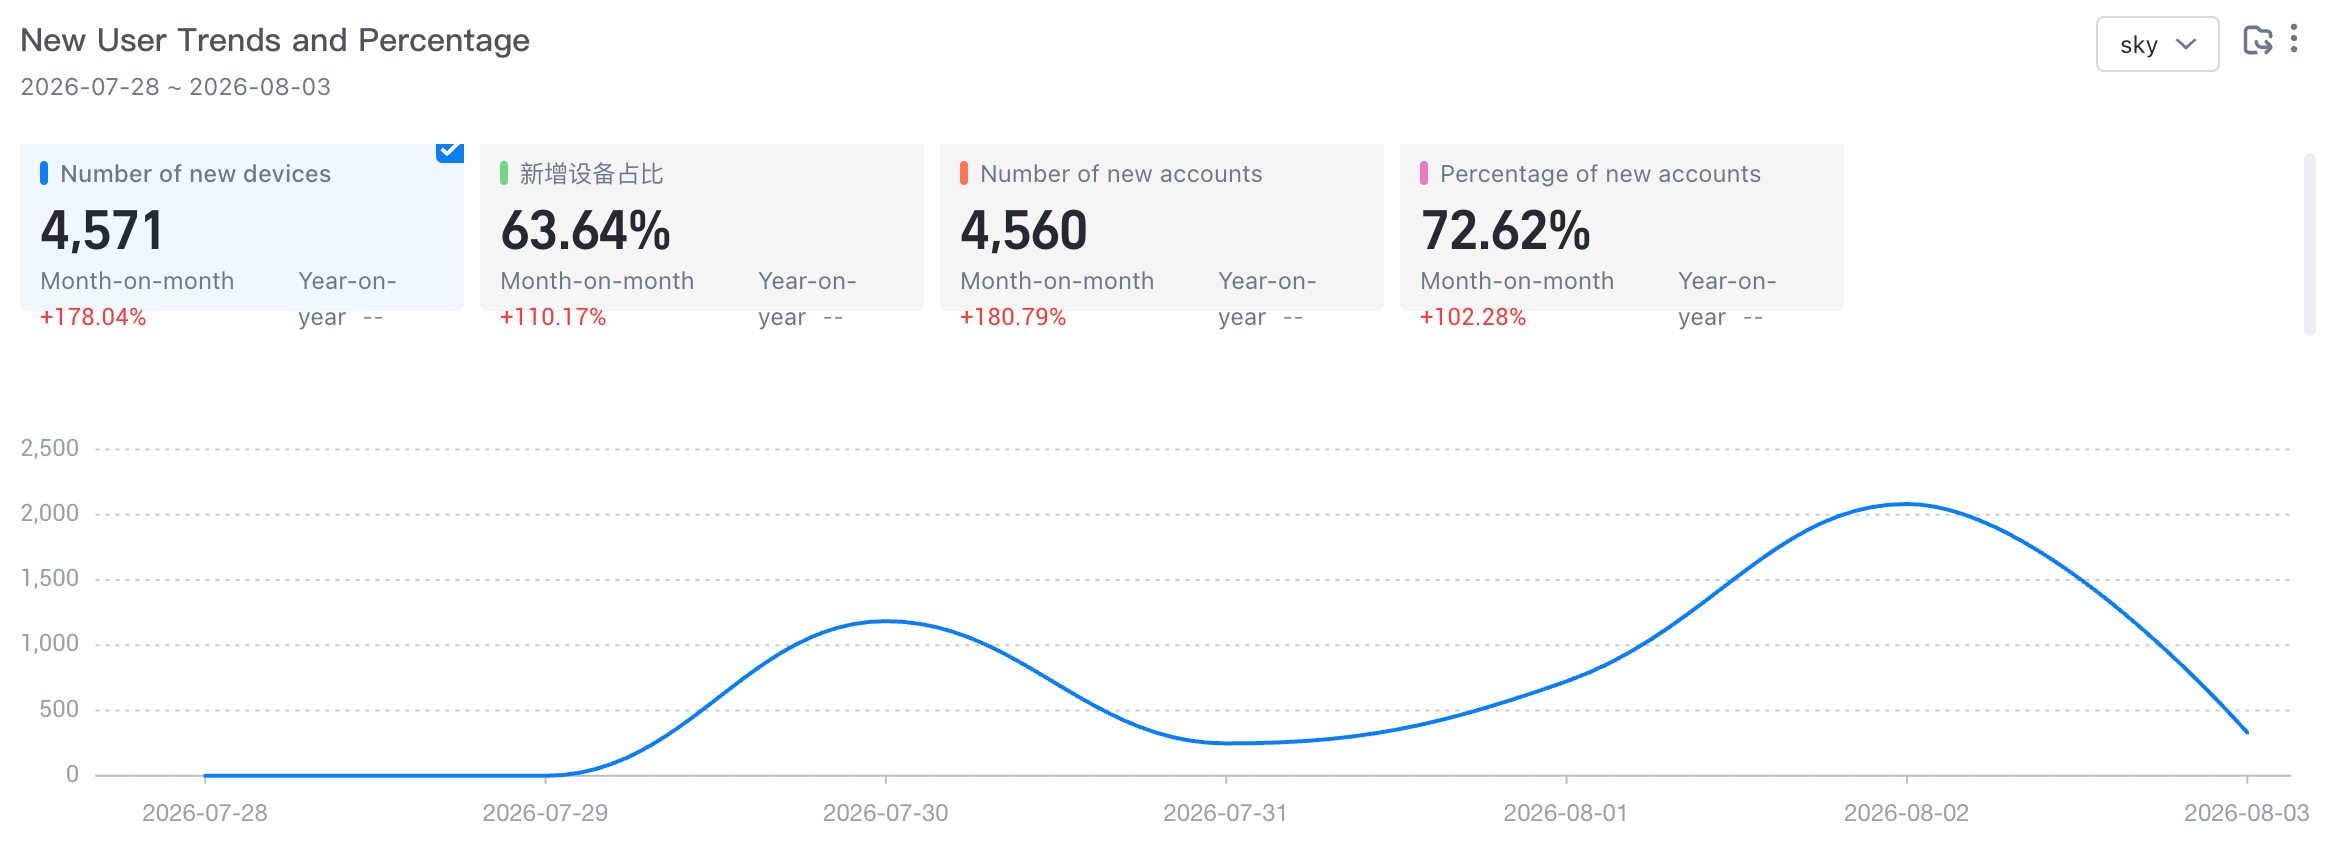
Trends and Proportion of New Users
Number of new devices: the number of deduplication of device IDs that triggered any event within the selected time, and the system property device started on the first day.
Proportion of new devices: the number of deduplication of device IDs that triggered any event during the selected time and the number of deduplication of device IDs that started or triggered any event on the first day.
Number of new accounts: At the selected time, the account ID of the account that triggers any event is deduplication, and the system attribute account is logged in on the first day.
Percentage of New Accounts: the number of account IDs that triggered any event during the selected period and the number of account IDs that logged on on the first day or triggered any event.
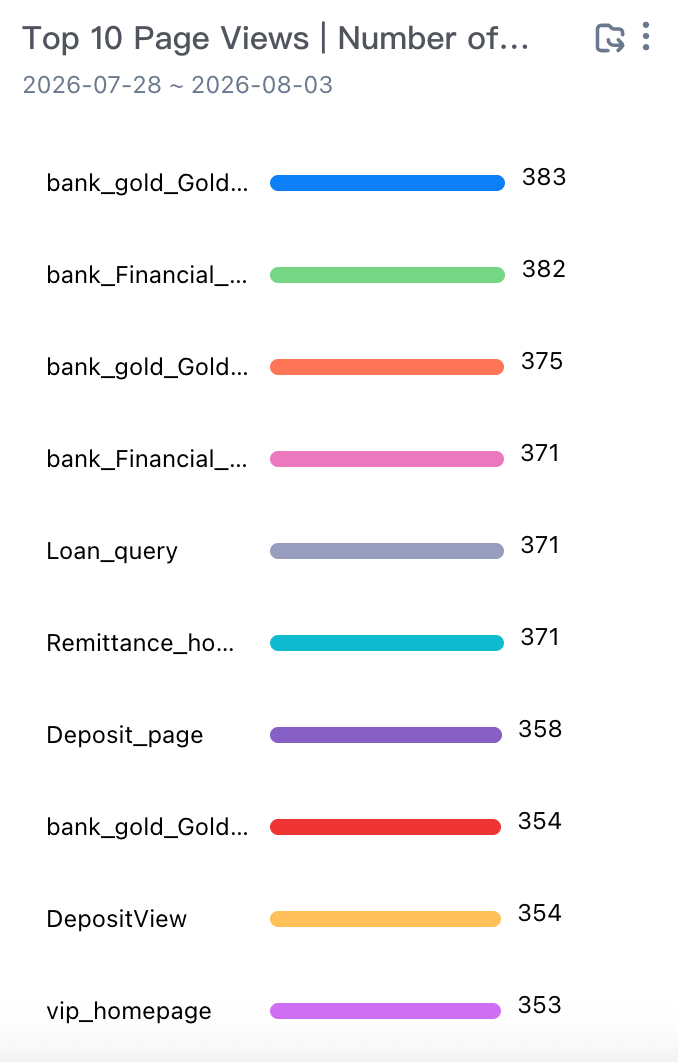
TOP 10 Page Browsing, Number of New Devices
Event Code: any preset system event triggered by the user within the selected time. The display logic displays the event name if the event name is entered. If the event name is not entered, the event code is displayed.
Number of new devices for page browsing: the number of deduplication of device IDs that triggered the page exhibition within the selected time and the device started on the first day.
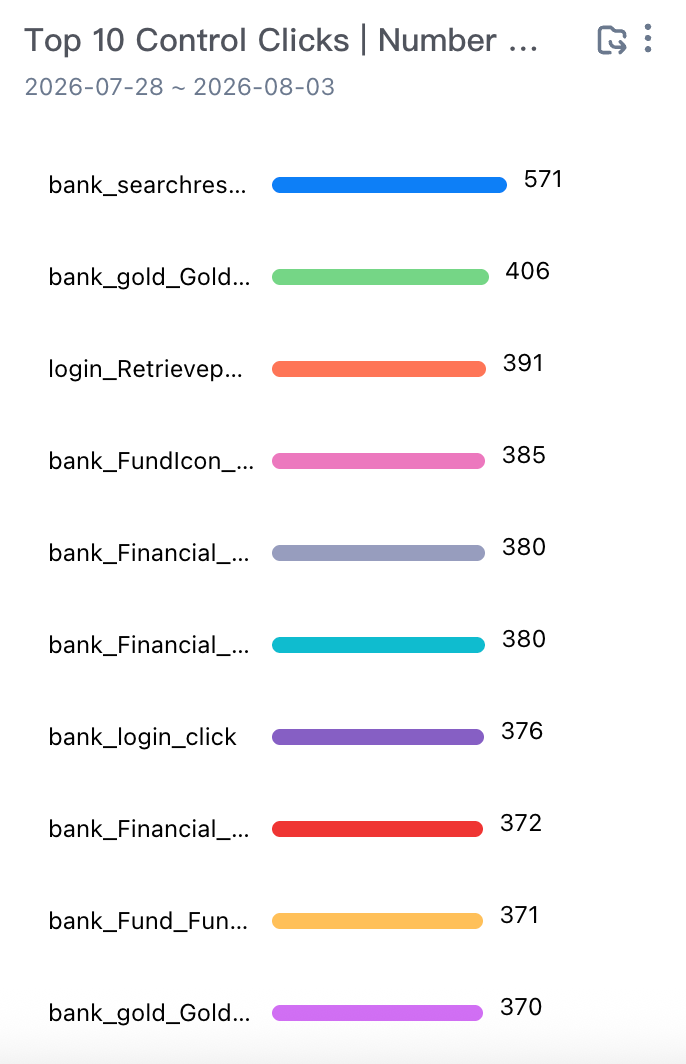
TOP 10 Control Click to Add Devices
Control event code: any preset system event triggered by the user within the selected time. The display logic displays the event name as the input event name, and displays the event code if no event name is input.
Number of new devices: the number of deduplication of the device ID that triggered the control click event within the selected time, and the device started on the first day
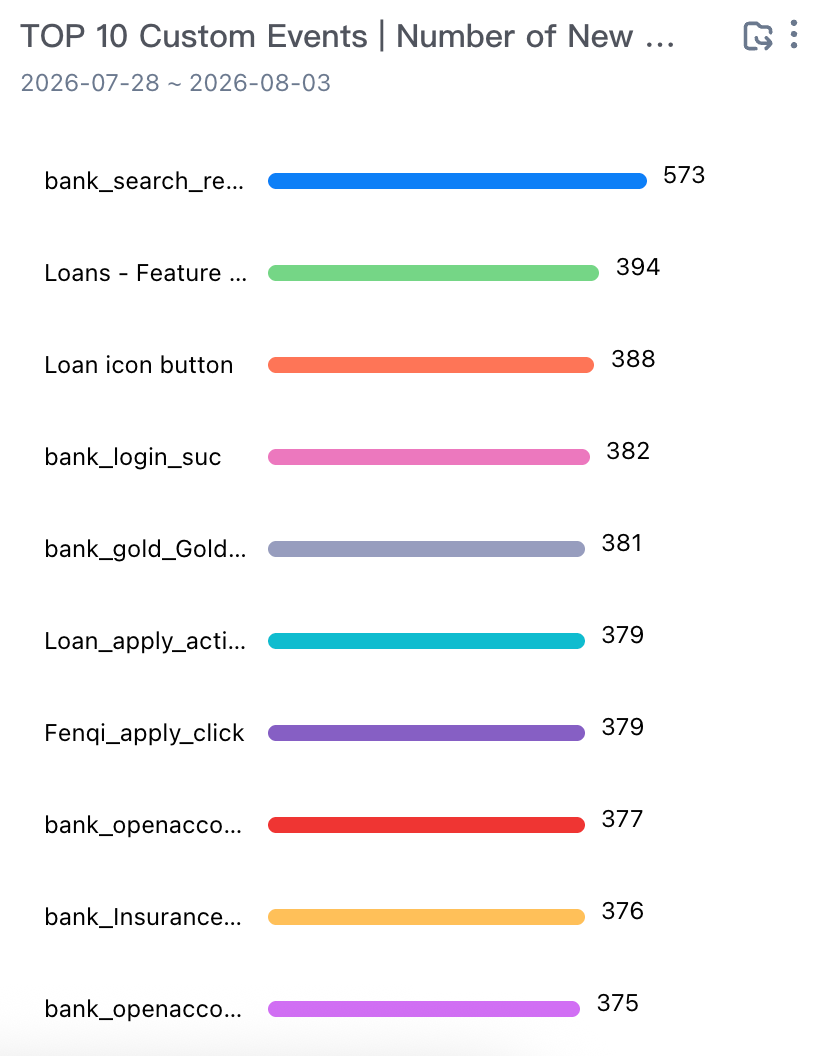
TOP 10 Custom Events-Number of New Devices
Event Code: the event code of any event whose trigger event type is equal to the custom event within the selected time. The display logic displays the event name as the event name entered. If no event name is entered, the event code is displayed.
Number of new devices: the number of deduplication of the device ID that triggered the custom event within the selected time and the device started on the first day.
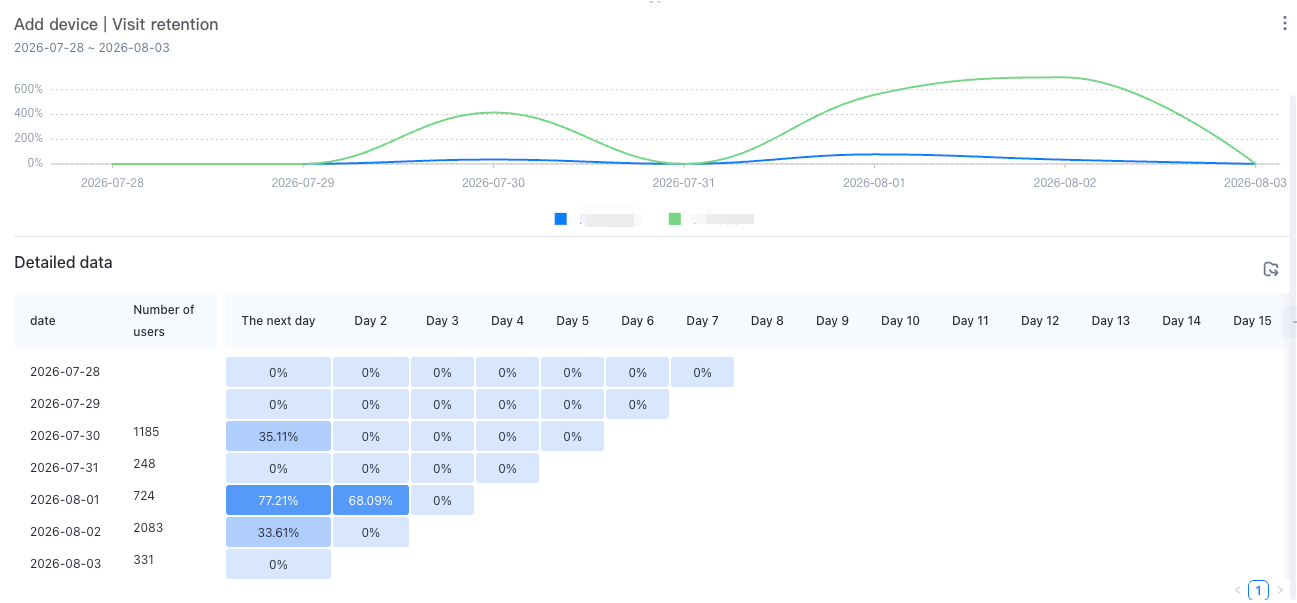
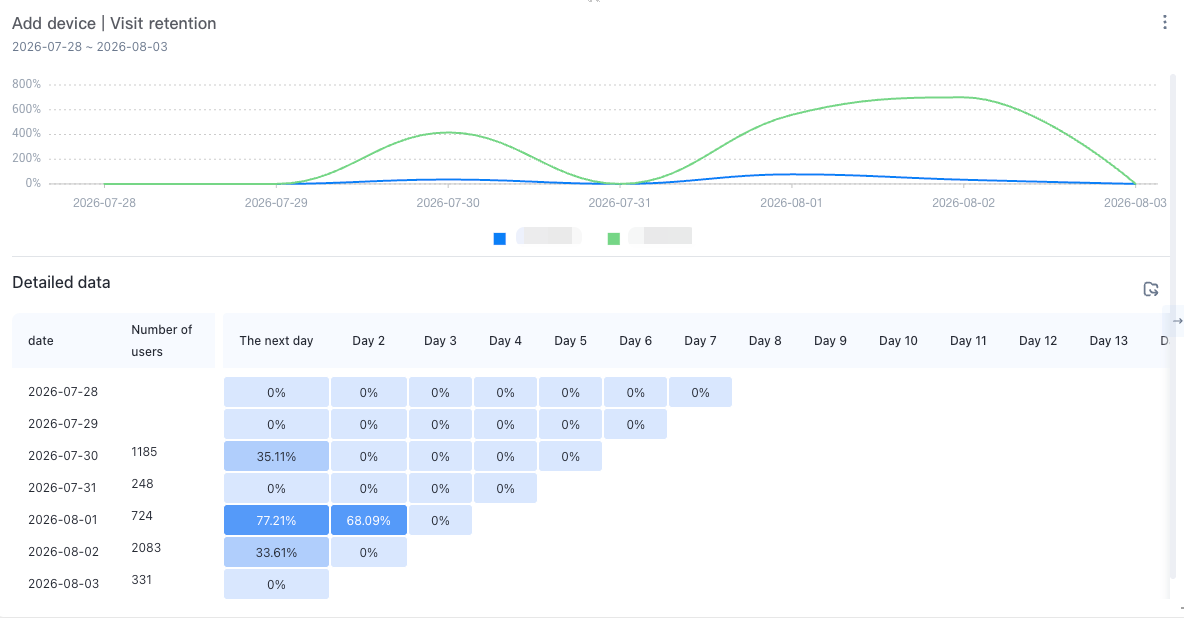
Add devices and access retention
Analysis Subject: Device ID
Number of new devices: The number of devices that triggered any event for the first time in history on day T (week or month).
Retention rate: new users on day t, number of active users on day t + n (week or month) /number of new users on day t (week or month) * 100%.
Active Users
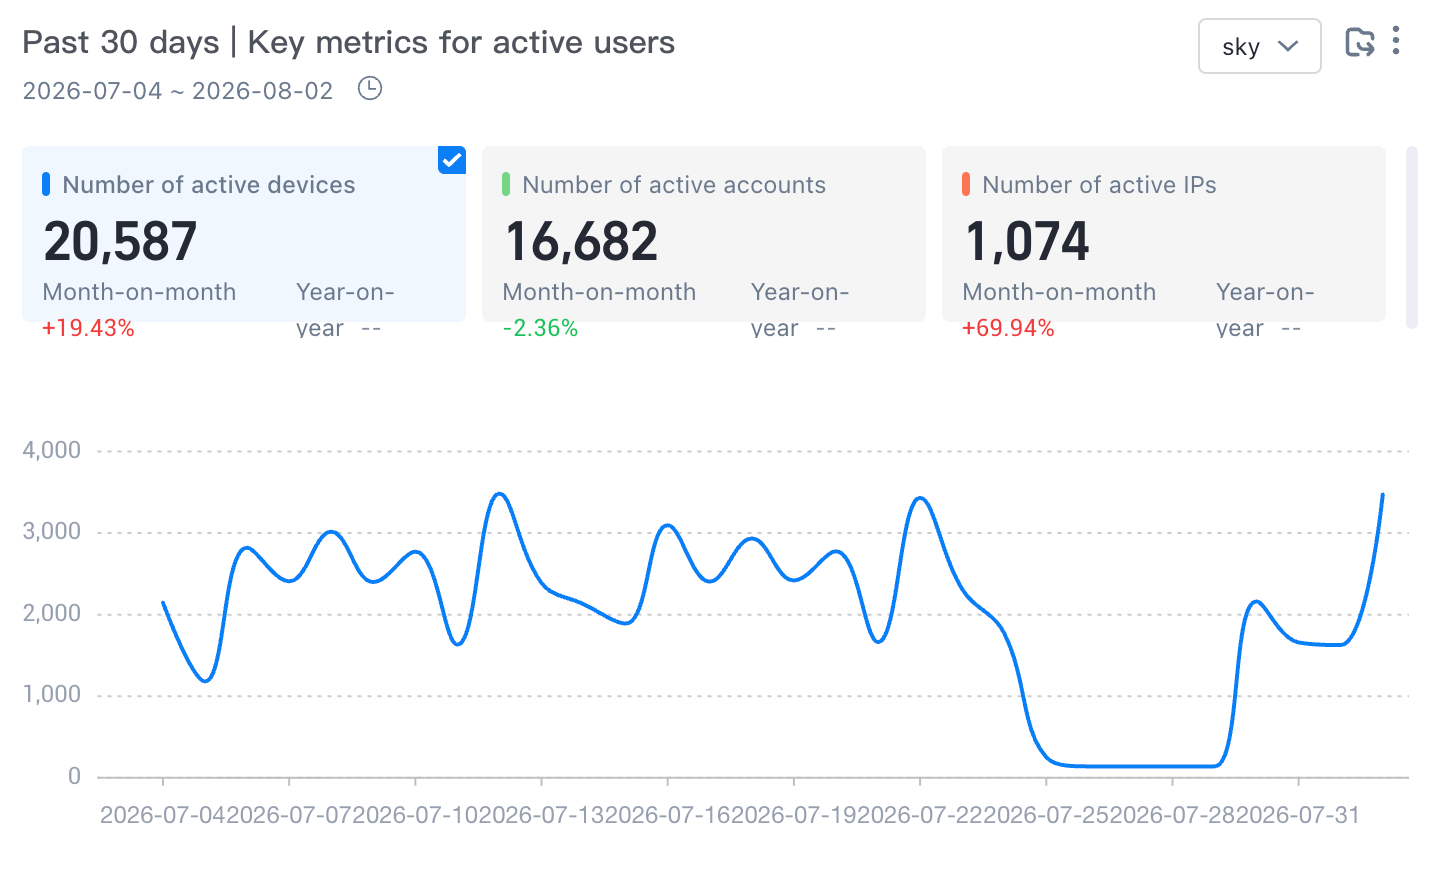
The new user dashboard includes eight reports: the number of active devices in the past seven days, the number of active accounts in the past seven days, the number of active devices in the past 30 days, the number of active accounts in the past 30 days, the key metrics of active users in the past 30 days, the distribution of access days, the number of active devices in the past 30 days, and the number of browsers and active devices. This Kanban allows you to quickly learn about active user data analysis.
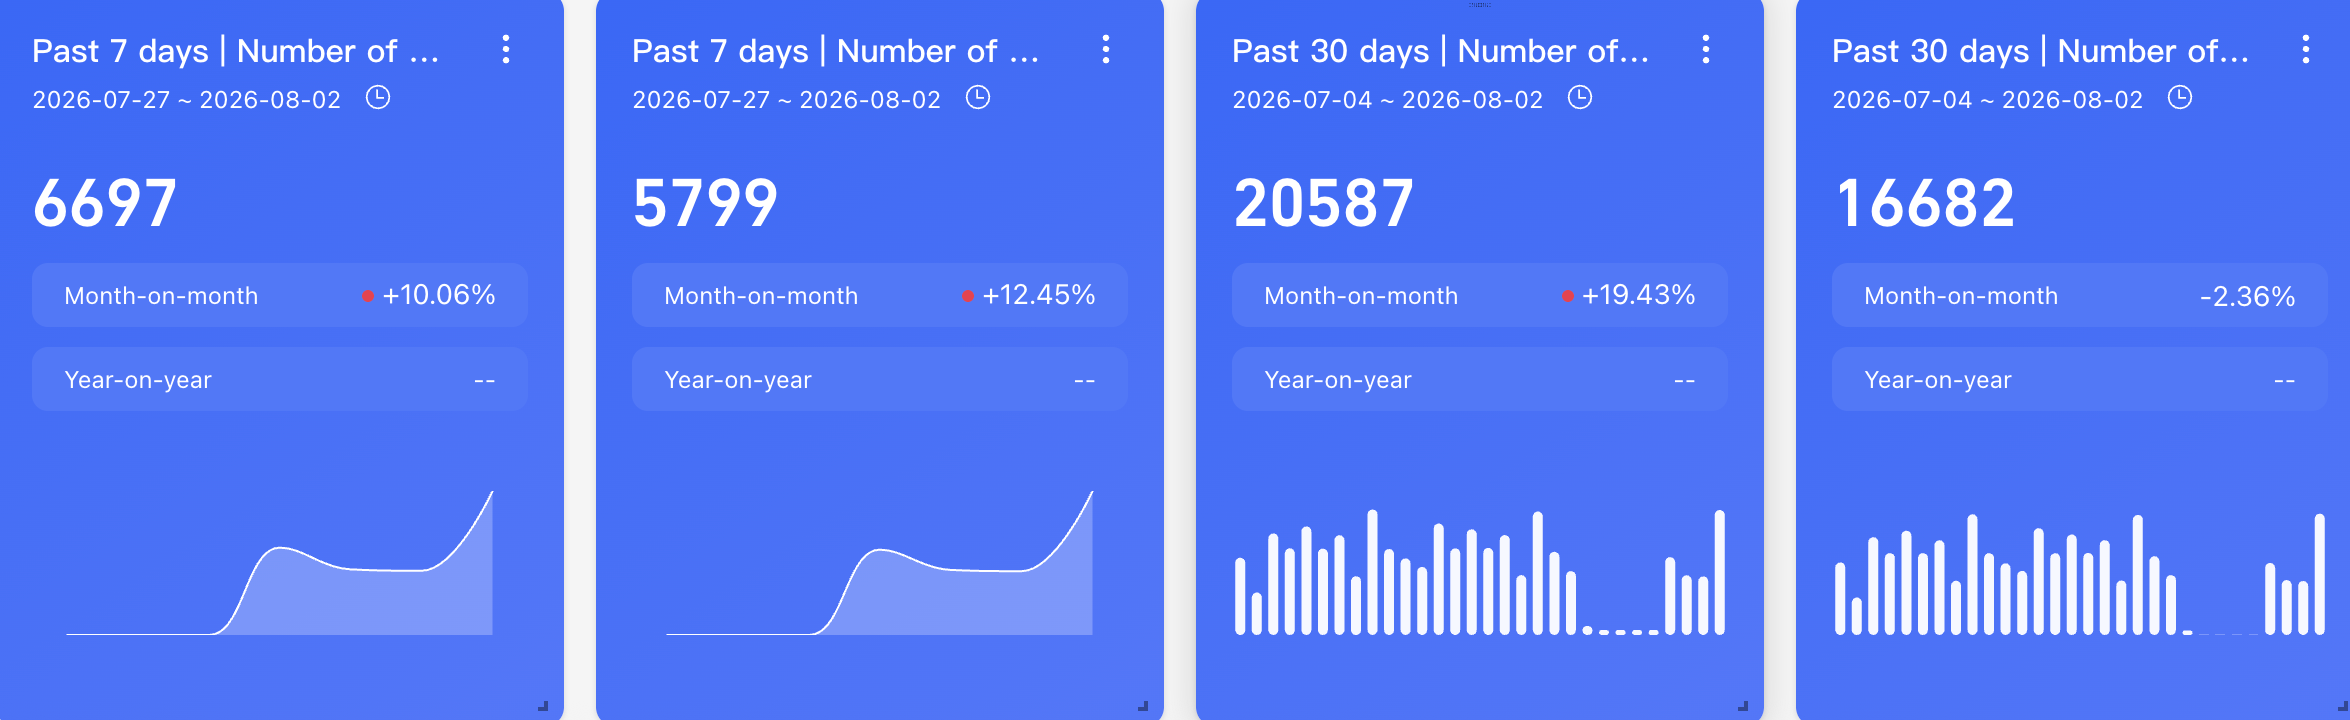
Number of active devices and accounts in the past 7/30 days
Number of devices and accounts added in the last 7 days or 30 days
Calculate the same comparison rule
Ring period indicator value-previous period indicator /previous period indicator value
Year-over-year=(current period-same period) /same period
Current Time Granularity | Ring comparison | YoY |
By Hour | Compare with last hour | Compared to the same period yesterday. |
By Day | Compared to yesterday. | Compared to the same period last week |
By Week | Compared to last week. | Accumulation of the same period last month |
By Month | Compare with last month | Compared with the same period last year |
Number of active accounts: the number of account IDs that triggered any event in the past 7/30 days.
Number of active devices: the number of deduplication of device IDs that triggered any event in the past 7/30 days.
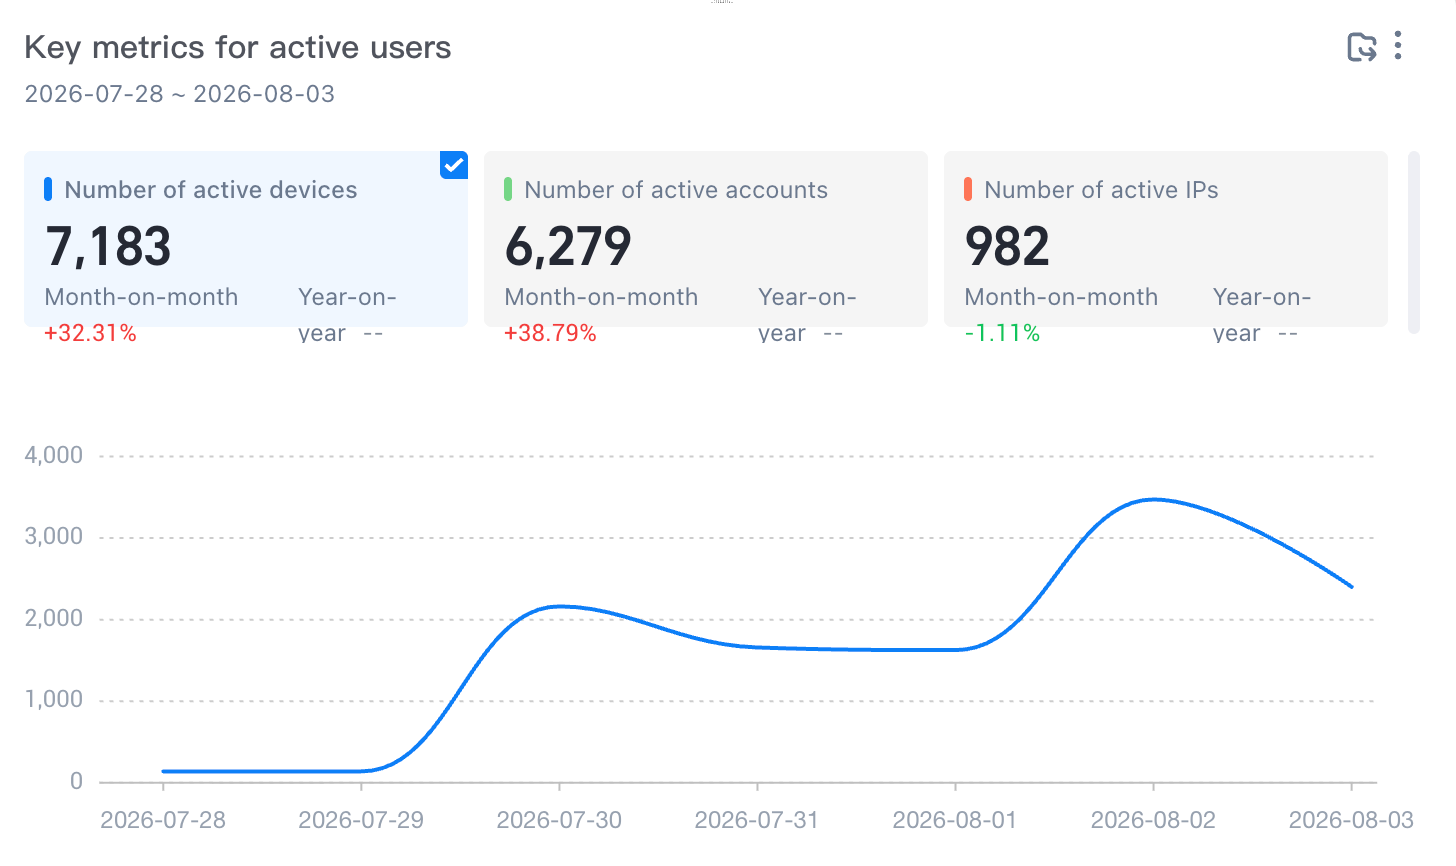
Key metrics of active users
Number of Active Devices: the number of deduplication of device IDs that triggered any event within the selected time.
Number of Active Accounts: the number of account IDs that trigger any event within the selected time.
Number of Active IP Addresses: the number of IP addresses that trigger any event within the selected time.
Key metrics for active users over the past 30 days
Number of active devices: the number of deduplication of device IDs that triggered any event in the past 30 days.
Number of active accounts: the number of account IDs that triggered any event in the past 30 days.
Active IP Addresses: the number of IP addresses that triggered any event in the past 30 days.
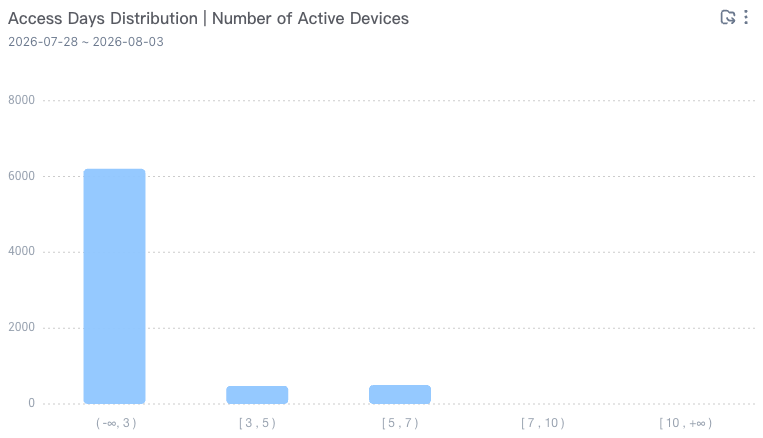
Distribution of access days and number of active devices
Access Days Distribution: the distribution of the number of days in which any event is triggered within the selected time.
Active Devices: the number of active devices that triggered any event during the selected time.
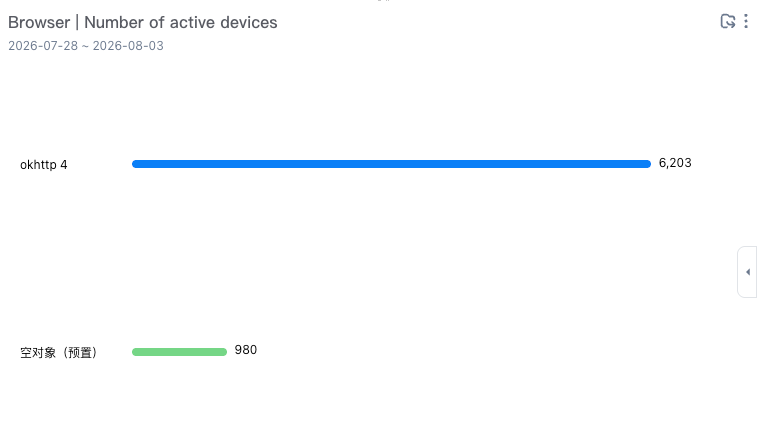
Number of browsers and active devices
Number of Active Devices: the number of deduplication of device IDs that triggered any event within the selected time.
Browser: The property value of the system property browser at the selected time.
Retained Users
The new user dashboard includes two reports: new device access retention and active device access retention. You can view the retention analysis of new and active users through retained users.
Add devices and access retention
Analysis Subject: Device ID
Access retention: triggers the initial behavior "any event" and the subsequent behavior "any event" within the selected time
New devices: The number of devices that triggered any event for the first time in history on day T (week or month).
Retention rate: new users on day t, number of active users on day t + n (week or month) /number of new users on day t (week or month) * 100%.
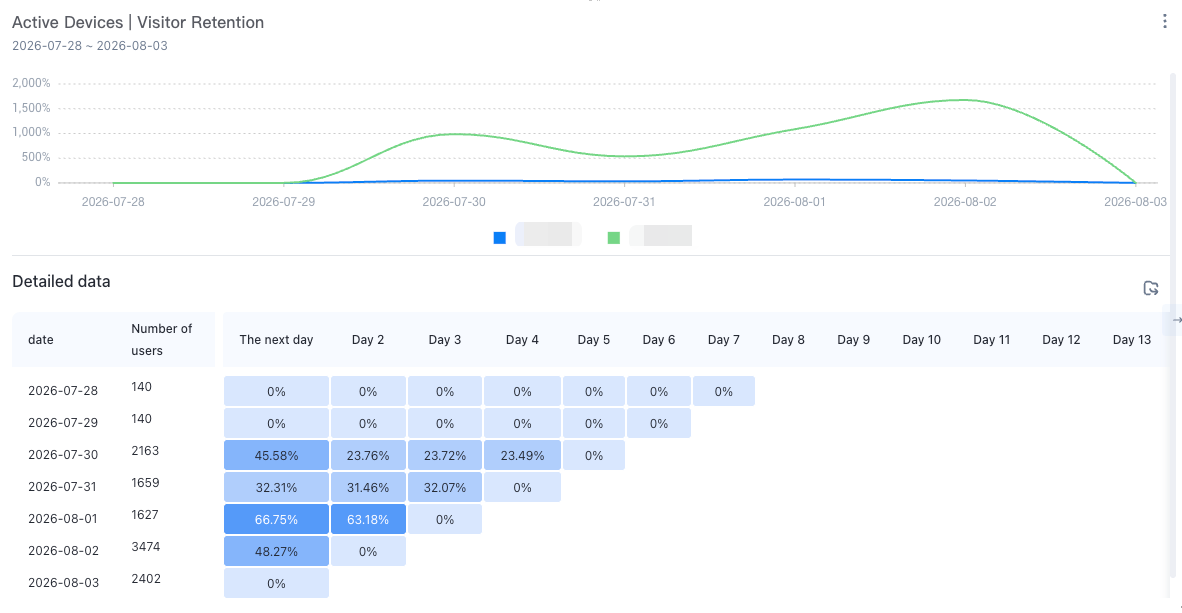
Active devices and access retention
Active Devices: The number of devices that triggered any event on the Tth day (week or month).
Retention rate: Number of active users on day T and active again on day T + N (week or month) /Number of active users on day T * 100%.
Device Terminal
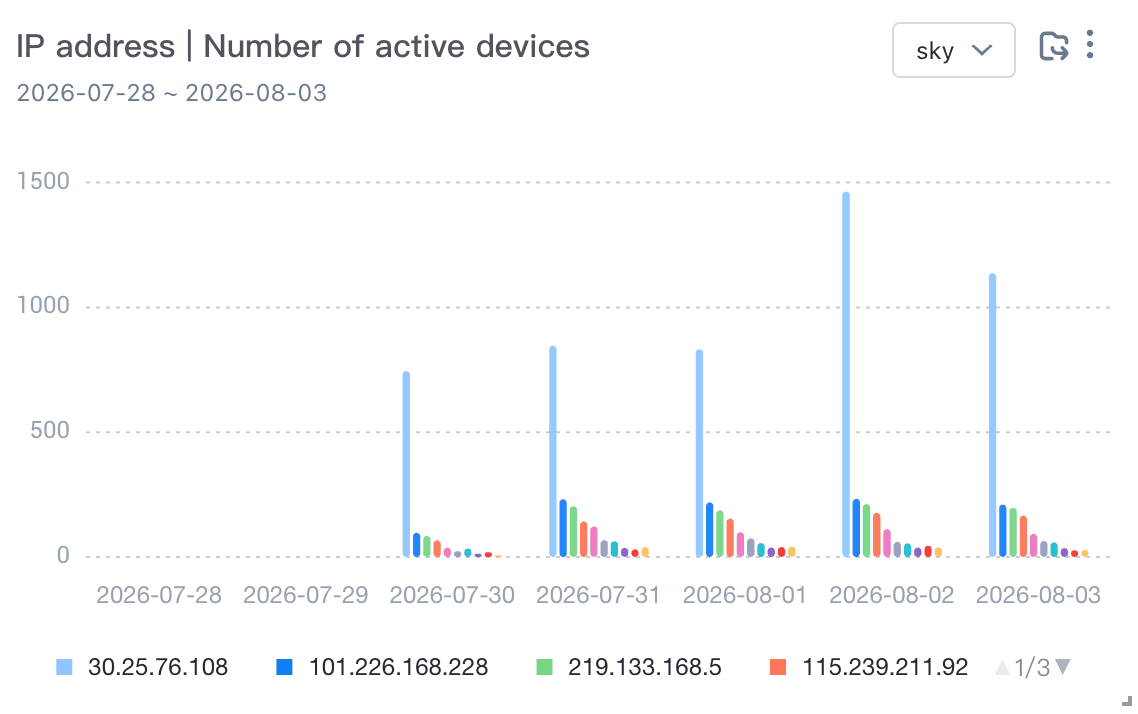
The device terminal dashboard includes four reports: operating system, number of active devices, operating system version, number of active devices, resolution, number of active devices, IP address, and number of active devices. You can view the device terminal data analysis through the device terminal report.
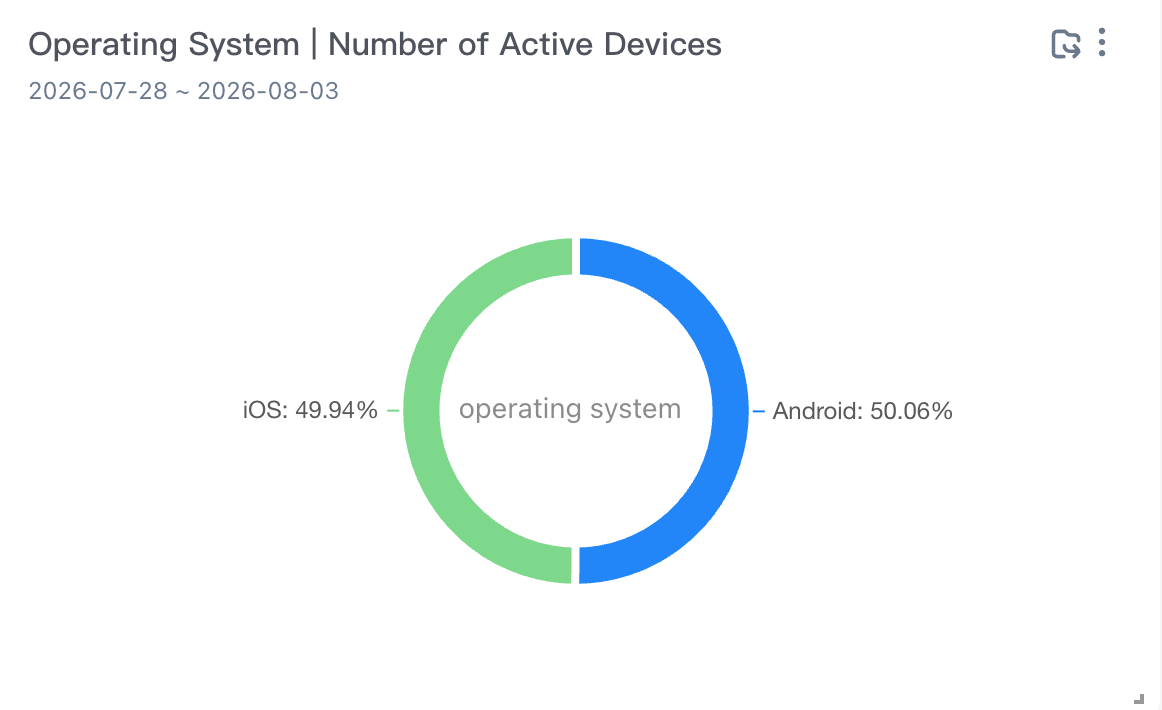
Operating system, number of active devices
Operating System: the property value of the operating system for the selected time.
Active Devices: the number of active devices that triggered any event within the selected time.
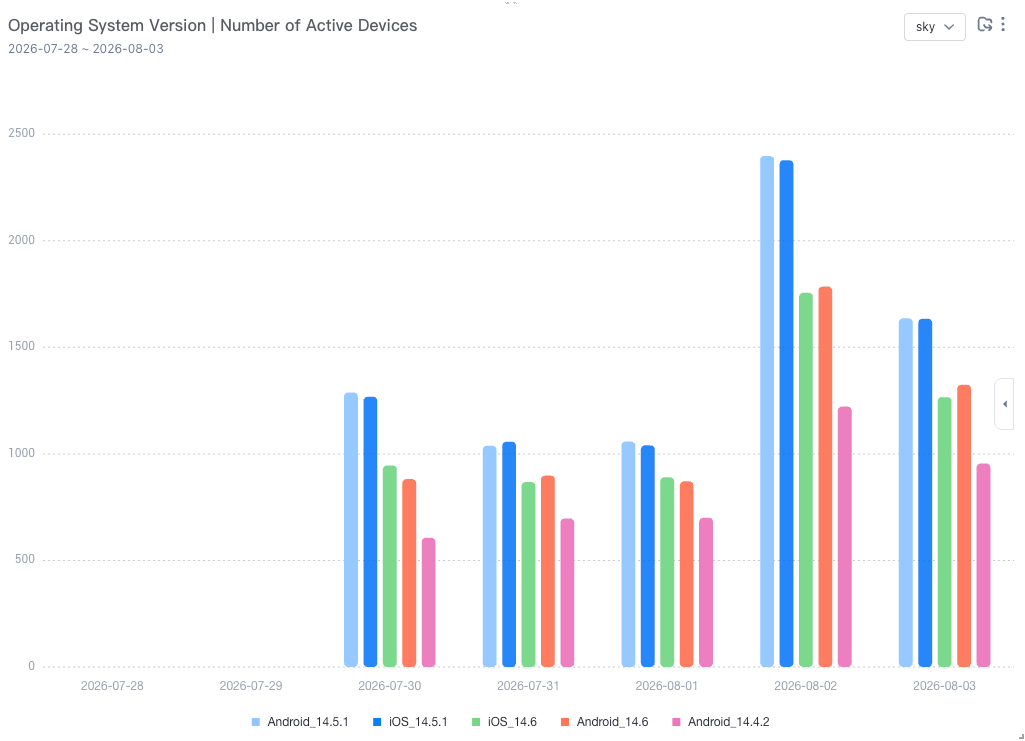
Operating system version and number of active devices
Operating System Version: the value of the property operating system version for the selected time.
Active Devices: the number of active devices that triggered any event within the selected time.
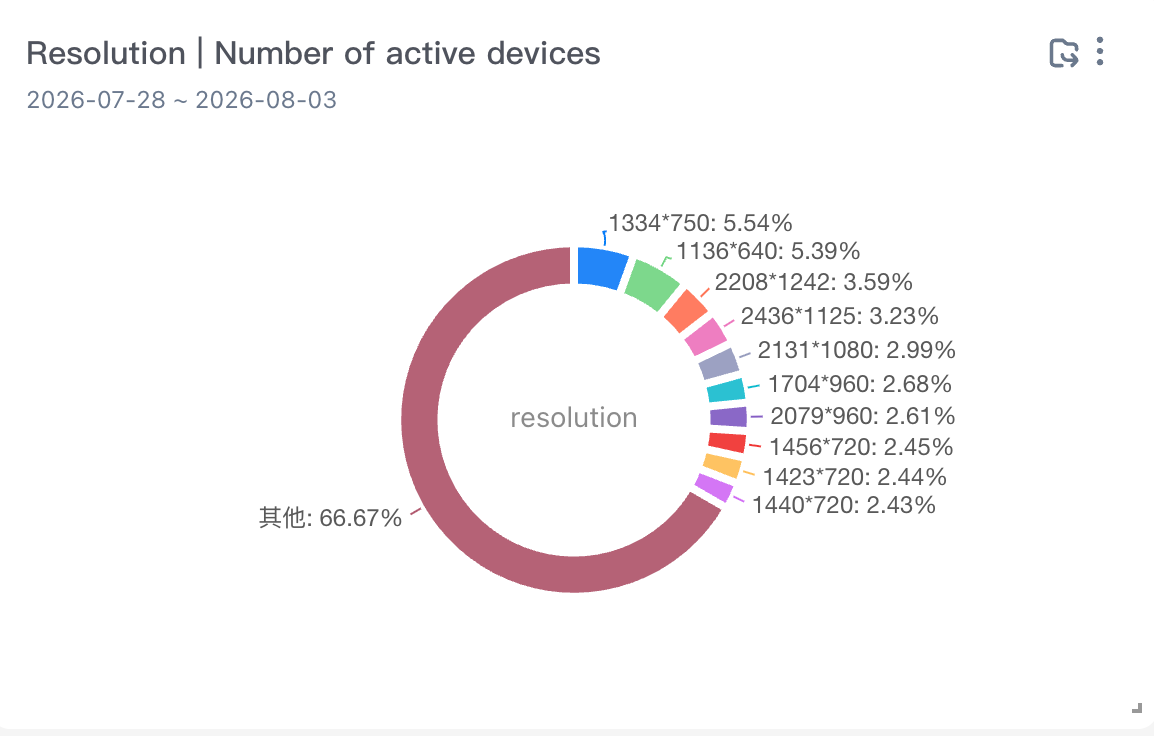
Resolution, number of active devices
Resolution: the property value of the system property resolution within the selected time.
Active Devices: the number of active devices that triggered any event within the selected time.
IP address and number of active devices
IP Address: the attribute value of the system property IP address within the selected time.
Active Devices: the number of active devices that triggered any event within the selected time.
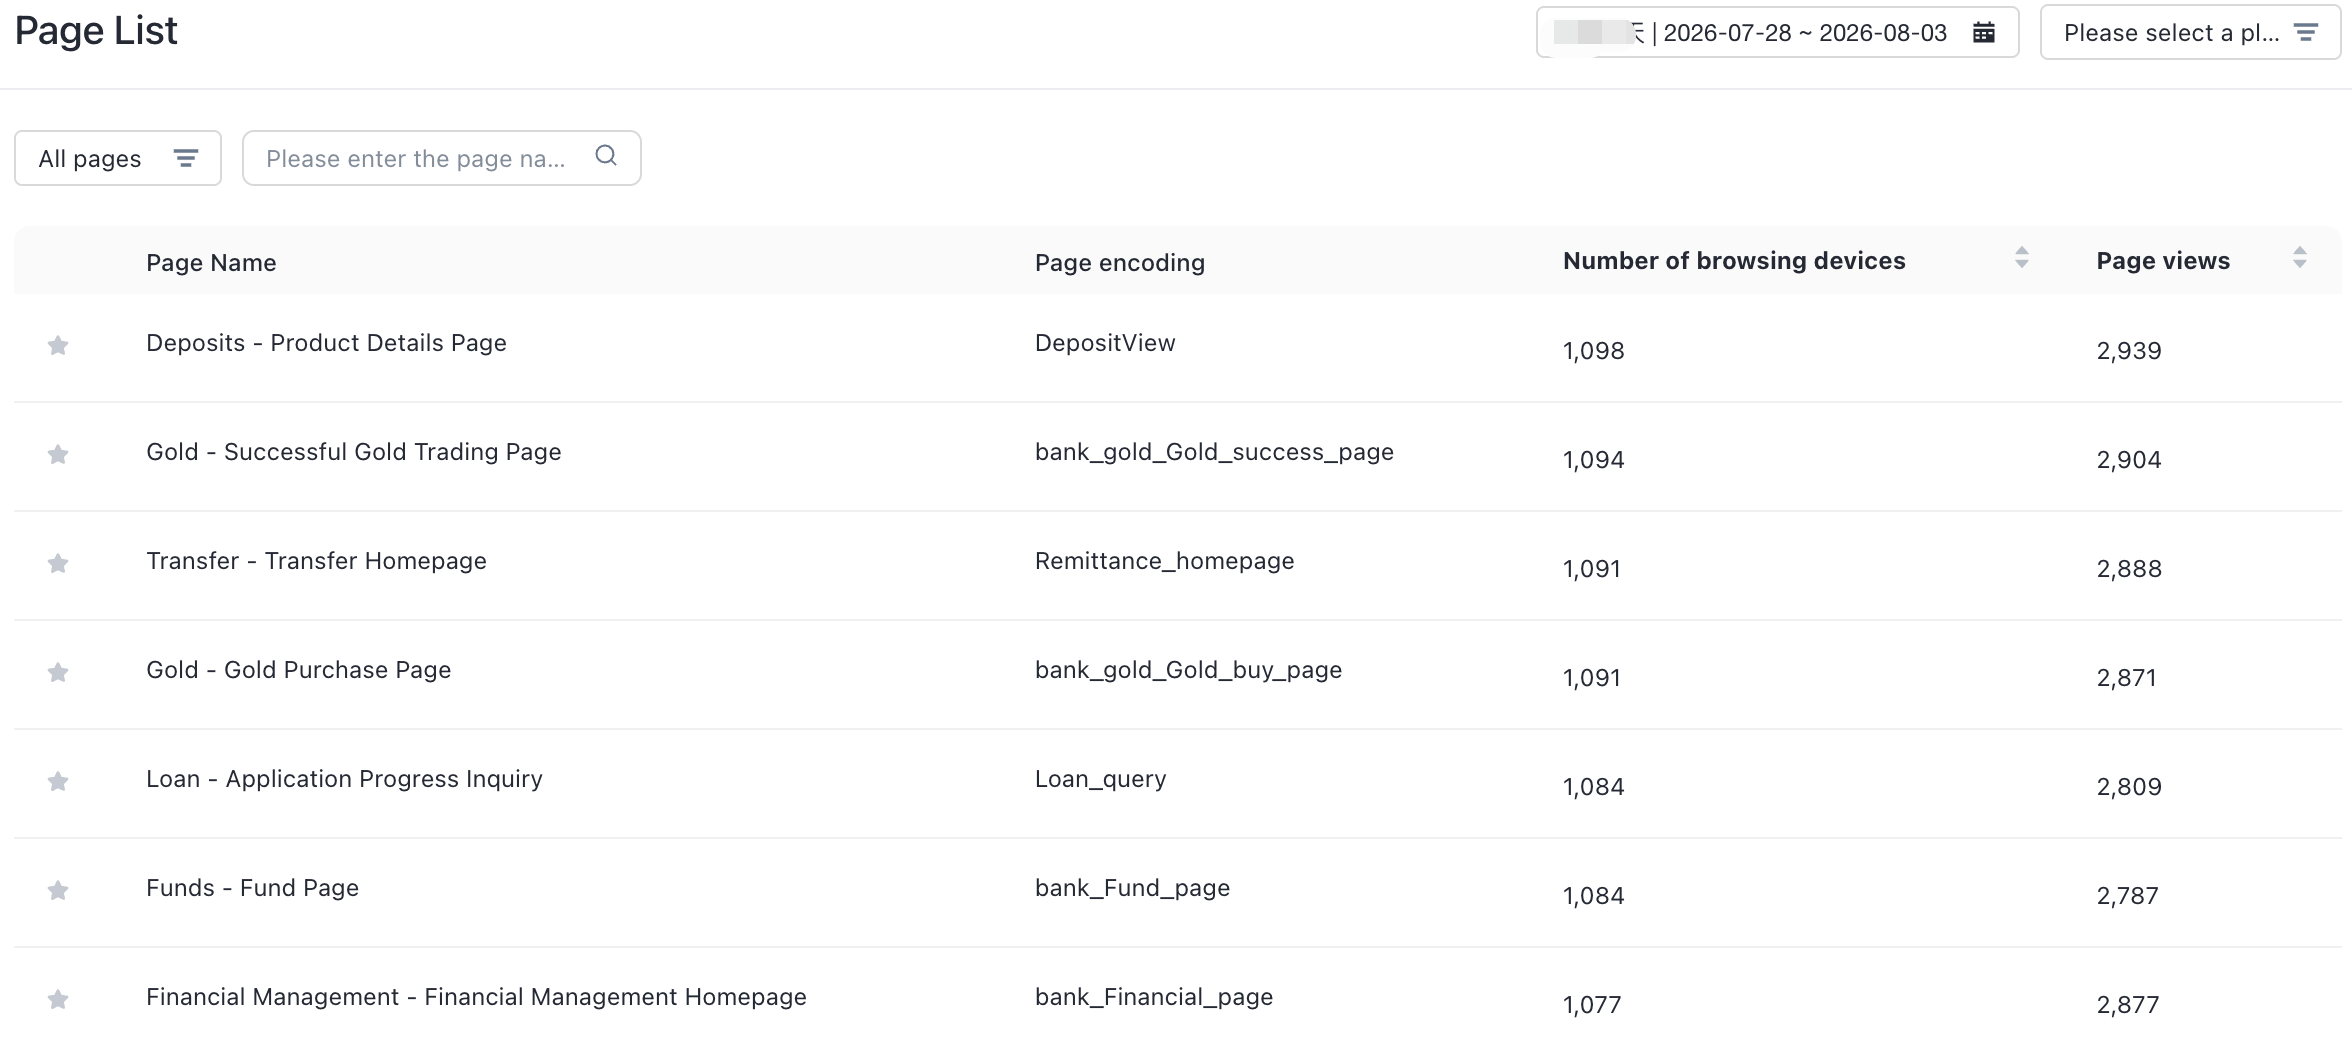
Page List
The page list kanban report can view the number of users and browsing times of all pages under the application.
Page Name: the name of the page code entered on the collection management platform. If no name is entered, the code is directly displayed.
Page code: the code of the page browsing event report, which corresponds to the page_name field in the SDK message
Browsing Devices: The number of page browsing events is deduplication based on the number of devices.
Browsing Times: the number of logs that are generated by page browsing events.
Custom events
On the custom event dashboard, you can view the number of users and times of all custom events in the application.
Event Name: the name of the event code entered by the customer on the collection management platform. If the event code is not entered, the event code is directly displayed.
Code: the code of the event that is reported by the event. The code corresponds to the ID field in the SDK message.
Triggered Users: the number of users who triggered the event.
Triggers: the number of logs that are reported by the event.