1. Configure feature switches
All configuration classes are enabled by default. If you want to disable some features, configure them before you initialize the appkey.
Please note that the configuration switch here is lower than the product background "switch and sampling configuration" in the setting of the switch, if you in the product background switch /sample rate changes, will be in the next startup when the next time and overwrite the configuration of the switch.
The adjustment switch is divided into two configuration classes:
The UMAPMConfig class contains the configuration of crashes and crashes.
The UMEFSConfig class supports startup analysis, network analysis, memory analysis, H5 page analysis, OOM exceptions, native page analysis, and log recovery.
1.1 UMAPMConfig class switch
The UMAPMConfig class enables or disables the configuration of each module in the UMAPM.
@interface UMAPMConfig : NSObject<NSCopying>

+(UMAPMConfig*)defaultConfig;

/**
 * The Crash&Catton monitoring switch is turned on by default.
 */
@property (nonatomic,assign) BOOL crashAndBlockMonitorEnable;

/*
 * Catton monitoring parameters
 * The interval at which heartbeat detection is sent. Unit: seconds.
 * The interval range is [1,4]. If the interval is exceeded, the default value 2 is used.
 */
@property (nonatomic, assign) float sendBeatInterval;

/*
 * Catton monitoring parameters
 * The time interval for detecting a stuck state is in seconds.   (Detect checkBeatInterval seconds after sending heartbeat)
 * The interval range is [1,4]. If the interval is exceeded, the default value 2 is used.
 */
@property (nonatomic, assign) float checkBeatInterval;

/*
 * Catton monitoring parameters
 * How many times in a row that no heartbeat is considered to trigger Caton
 * The interval range is [1,4]. If it exceeds the range, the default value 3 is used. Note that this parameter must be an integer.
 */
@property (nonatomic, assign) NSInteger toleranceBeatMissingCount;

@end
Configure a module | Configuration Variable Name | Default Value |
crash& Caton Module | crashAndBlockMonitorEnable | YES |
Example
- (BOOL)application:(UIApplication *)application didFinishLaunchingWithOptions:(NSDictionary *)launchOptions {

     UMAPMConfig* config = [UMAPMConfig defaultConfig];
     config.crashAndBlockMonitorEnable = YES;
     [UMCrashConfigure setAPMConfig:config];

     [QTConfigure setCustomDomain:@"Your collection service domain name" standbyDomain:@""];
     [QTConfigure initWithAppkey:@"Your appkey" channel:@"App Store"];
}
1.2 UMEFSConfig class
UMEFSConfig the classes for the various modules in UMEFS provide configuration on or off functionality.
@interface UMEFSConfig : NSObject

+(UMEFSConfig*)defaultConfig;

/**
 * Start the module monitoring switch, which is turned on by default.
 */
@property (nonatomic,assign) BOOL launchMonitorEnable;

/**
 * Memory module monitoring switch, turned on by default
 */
@property (nonatomic,assign) BOOL memMonitorEnable;

/**
 * Network module monitoring switch, enabled by default
 */
@property (nonatomic,assign) BOOL networkEnable;

/**
 * The switch of the H5 access module is turned on by default.
 */
@property (nonatomic,assign) BOOL javaScriptBridgeEnable;

/**
 * The OOM module monitoring switch is turned on by default.
 */
@property (nonatomic,assign) BOOL oomMonitorEnable;

/**
 * The native page module monitoring switch is turned on by default.
 */
@property (nonatomic,assign) BOOL pageMonitorEnable;

/**
 * The switch of the log salvage module is turned on by default.
 */
@property (nonatomic,assign) BOOL logCollectEnable;

/**
 * The ID of the log recovery module.
 */
@property (nonatomic,copy) NSString *logCollectUserId;

/**
 * Initialize the active sending PV.
 */
@property (nonatomic, assign) BOOL initSendPVEnable;

/**
 * Used to connect the front and back links.
 */
@property (nonatomic, strong) NSDictionary* rumConfig;

@end
Module description
Configure a module | Configuration Variable Name | Default Value |
Startup module switch | launchMonitorEnable | YES |
Network Module Switch | networkEnable | YES |
Memory Module Switches | memMonitorEnable | YES |
H5 module switch | javaScriptBridgeEnable | YES |
OOM module switch | oomMonitorEnable | YES |
Native page module switch | pageMonitorEnable | YES |
Log fishing module switch | logCollectEnable | YES |
Log retrieving module userId | logCollectUserId | Empty |
Initialize the active sending PV | initSendPVEnable | NO |
Front-end and rear-end links are opened | rumConfig | Empty |
Initialization example
#import <UMEFS/UMEFS.h>
#import <UMEFS/UMEFSConfig.h>
#import <UMEFS/UMEFSConfigure.h>
#import <QTCommon/QTCommon.h>

- (BOOL)application:(UIApplication *)application didFinishLaunchingWithOptions:(NSDictionary *)launchOptions {

    UMEFSConfig* configForEFS = [UMEFSConfig defaultConfig];
    configForEFS.networkEnable = YES;
    configForEFS.launchMonitorEnable = YES;
    configForEFS.memMonitorEnable = YES;
    configForEFS.javaScriptBridgeEnable = YES;
    configForEFS.oomMonitorEnable = YES;
    configForEFS.pageMonitorEnable = YES;
    configForEFS.logCollectEnable = YES;
    configForEFS.logCollectUserId = @"The ID of the log recovery module.";
    configForEFS.initSendPVEnable = YES;
    configForEFS.rumConfig = @{
        @"injectTraceHeader": @"traceparent",
        @"needTracedUrls":@[@"/v1/trace", @"^/v1/trace$", ...],
        @"ignoredUrls": @[@"/v1/trace", @"^/v1/trace$", ...],
    };
    [UMEFSConfigure setAPMConfig:configForEFS];

    [QTConfigure setCustomDomain:@"Your collection service domain name" standbyDomain:@""];
    [QTConfigure initWithAppkey:@"Your appkey" channel:@"App Store"];

    return YES;
}
2. Configure function modules
2.1 collapse analysis
After you integrate the common and apm plug-ins, you can use the crash analysis feature.
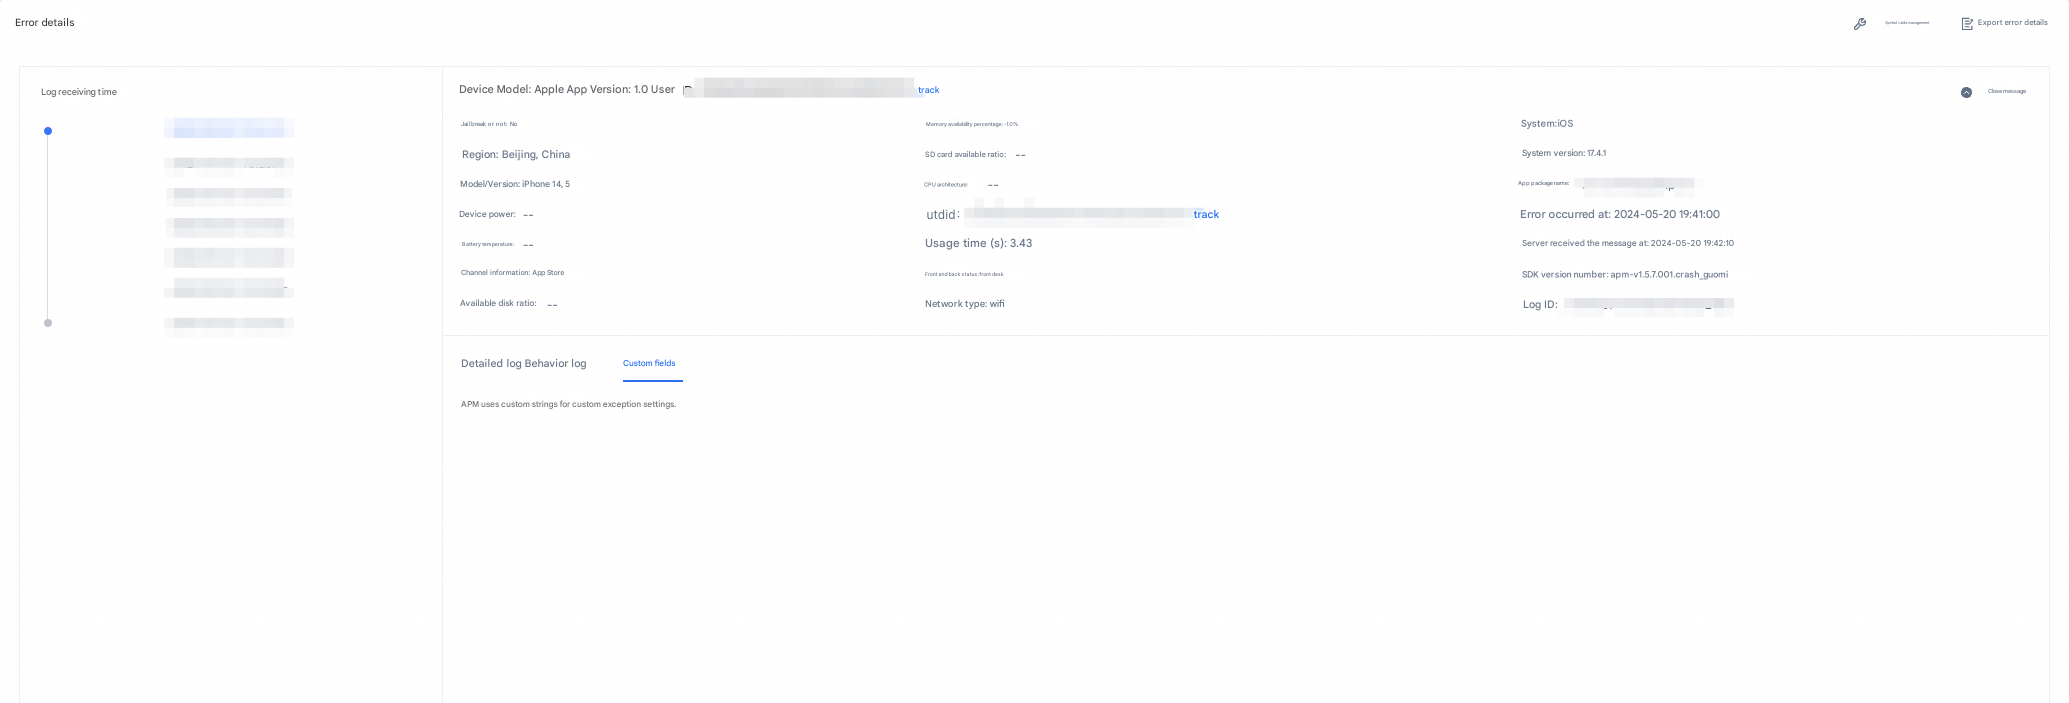
Optional supplementary feature: crash callback. You can view the crash callback on the Error Details-Custom Fields tab.
Crash callback description: When a crash occurs, you can call this callback to your business logic. This interface returns string data, which is written to the crash file and uploaded to the server for display. Crash callback is limited to 256 characters
Callback interface:
// The return string cannot be larger than 256 bytes. The larger part will be truncated.
+(void)setCrashCBBlock:(CallbackBlock_Nullable)cbBlock;
Example:
#import <UMAPM/UMCrashConfigure.h>

[UMCrashConfigure setCrashCBBlock:^NSString*_Nullable{

    return @ "Custom string on crash";
}];
After the upload is complete, you can view the callback information in the Error Details-Custom field.
The following figure shows an example of the feature:
Take note of the following items during testing:
1. The app cannot be in debug mode when a crash is triggered.
2. The crash log is uploaded at the next startup and cannot be in debugging mode at the next startup.
Both of the preceding steps disable debug mode. Otherwise, it will affect the monitoring and identification of the crash.
In Release mode, if the test device is connected to Xcode by a data cable, data reporting will also be affected.
2.2 custom exceptions
Custom exception upload
Interface functions:
/**
 * Report custom errors
 * The length of the @ name name must be no more than 256 bytes.
 * @reason The length of the cause of the error is limited to 256 bytes, which exceeds truncation.
 * @stackTrace The length of the stack is within the limit of 100*1024 bytes, which exceeds truncation.
 *
 * @example:
 * // The unique identifier of the log type.
 NSString* name = @"myUnity";
 NSString* reason = @"csharp exception";

 NSArray* stackTrace = [NSArray arrayWithObjects:
 @"msg: Exception: Exception, Attempted to divide by zero.",
 @"UnityDemo+ExceptionProbe.NormalException () (at <unknown>:0)",
 @"UnityDemo.TrigException (System.Int32 selGridInt) (at <unknown>:0)",
 @"UnityDemo.OnGUI () (at <unknown>:0)",
 nil];
 *
 *[UMCrashConfigure reportExceptionWithName:name reason:reason stackTrace:stackTrace];
 *
 *
 */
+(void)reportExceptionWithName:(NSString* _Nonnull)name reason:(NSString* _Nonnull)reason stackTrace:(NSArray* _Nonnull)stackTrace;
Example:
#import <UMAPM/UMCrashConfigure.h>

NSString* name = @"myUnity";
NSString* reason = @"csharp exception";

NSArray* stackTrace = [NSArray arrayWithObjects:
 		       @"msg: Exception: Exception, Attempted to divide by zero.",
 		       @"UnityDemo+ExceptionProbe.NormalException () (at <unknown>:0)",
                       @"UnityDemo.TrigException (System.Int32 selGridInt) (at <unknown>:0)",
 		       @"UnityDemo.OnGUI () (at <unknown>:0)",
                       nil];

[UMCrashConfigure reportExceptionWithName:name reason:reason stackTrace:stackTrace];
Feature demonstration example: 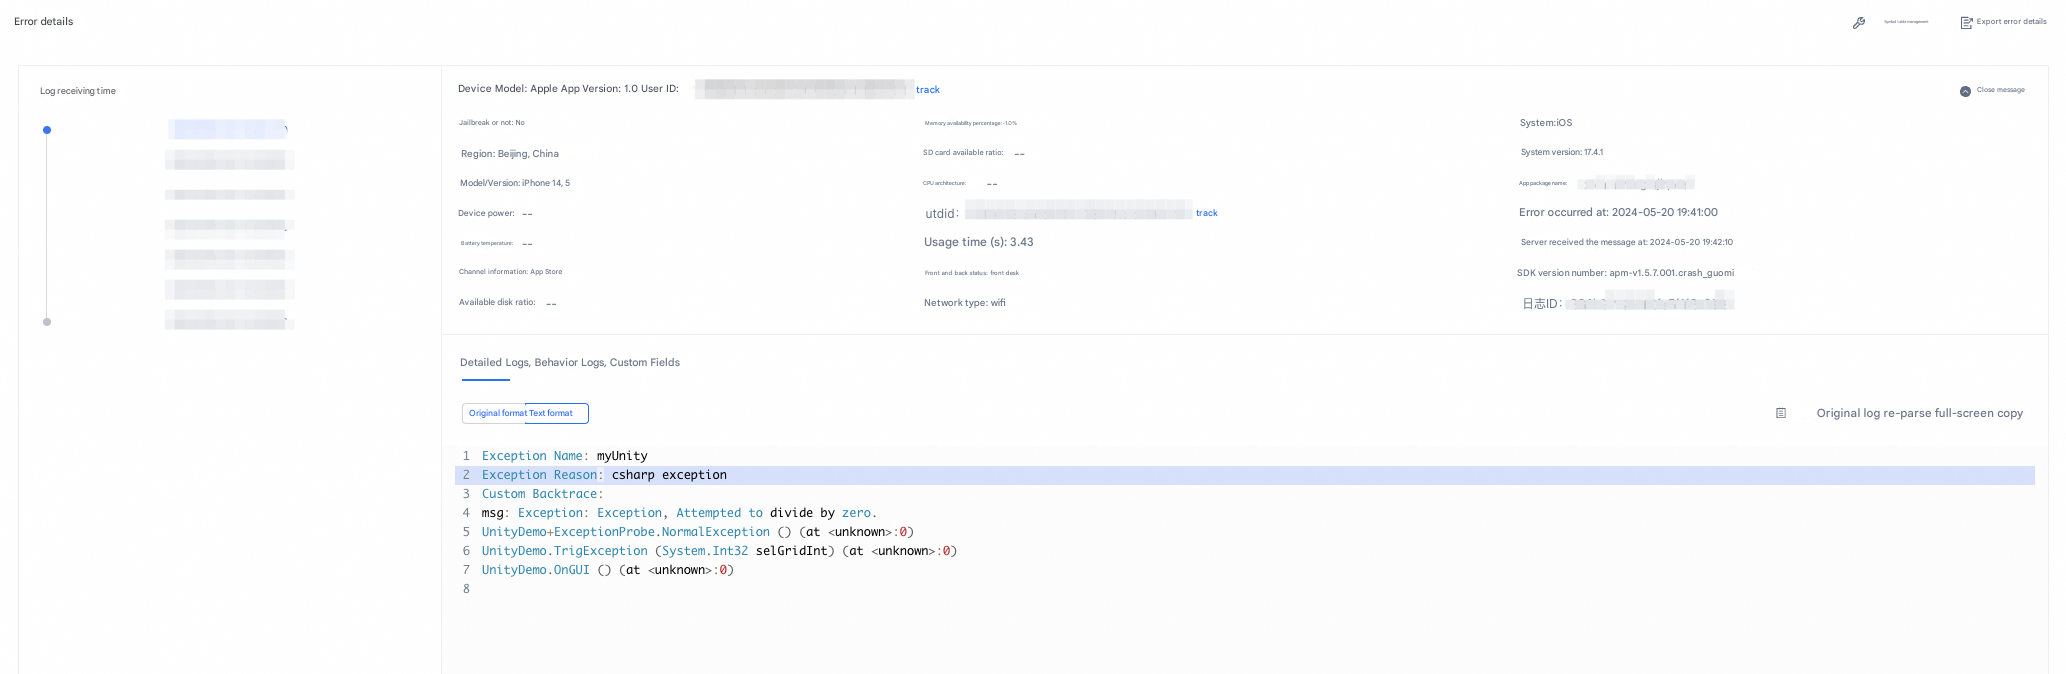
2.3 Catton Analysis
To enable Caton analysis, you must integrate the UMAPM.framework and UMEFS.framework libraries.
By configuration items the crashAndBlockMonitorEnable option is set to YES to open the Caton module
Example:
#import <UMAPM/UMAPMConfig.h>
#import <UMAPM/UMCrashConfigure.h>
#import <QTCommon/QTCommon.h>

- (BOOL)application:(UIApplication *)application didFinishLaunchingWithOptions:(NSDictionary *)launchOptions {

    UMAPMConfig* config = [UMAPMConfig defaultConfig];
    config.crashAndBlockMonitorEnable = YES;
    [UMCrashConfigure setAPMConfig:config];

    [QTConfigure setCustomDomain:@"Your collection service domain name" standbyDomain:@""];
    [QTConfigure initWithAppkey:@"Your appkey" channel:@"App Store"];
}
2.4 startup analysis
2.4.1 Definition of startup phase
Startup is divided into cold start and hot start:
Cold start
By default, the following four predefined startup phases are monitored:
Pre-initialization duration: the period from the start of the process when the function exec starts to the specified + load execution.
Initialization duration: from the specified + load to the finishLaunching phase.
Application build duration: from finishLaunching to FirstVC.viewDidLoad(). (childview also needs to be built in viewDidLoad)
Loading duration of the first page: The first page is rendered from FirstVC.viewDidLoad() to FirstVC.viewDidAppear().
Hot start
From applicationWillEnterForeground() to applicationDidBecomeActive() to end.
2.4.2 Method for starting monitoring
Start monitoring is divided into automatic monitoring and manual monitoring.
The two modes can be cross-used. The manual tracking mode prevails.
2.4.2.1 Automatic Mode
You only need to initialize the appkey.
Users can also set the optional operation to set the first ViewController to specify the first page to ensure correct monitoring of the loading time of the cold start first page.
The related API is as follows:
+(void)setRootVCCls:(Class)cls;// DidFinishLaunching the first sentence to set the RootViewControllerExample:
#import <UMAPM/UMLaunch.h>

[UMLaunch setRootVCCls:[ViewController class]];
Note:
If not set, we will look for [UIApplication sharedApplication] delegate's window rootViewController for the monitor lifecycle.
2.4.2.2 Manual Mode
Currently, manual mode only supports tracking in the cold start /first start phase
The related API is as follows:
/*
 * Manually set three predefined end times (the initialization duration ends, the application building duration ends, and the page loading duration ends). * /
+(void)setPredefineLaunchType:(UMPredefineLaunchType)predefineLaunchType;
At present, the cold start of the three predefined stages of the buried points are:
1. Initialization duration end point (UMPredefineLaunchType_DidFinishLaunchingEnd).
2. The end time of the application build duration (UMPredefineLaunchType_ViewDidLoadEnd).
3, the first page load completed the end time point (UMPredefineLaunchType_ViewDidAppearEnd).
The corresponding enumeration variables are:
// The predefined type of the cold start.
typedef NS_ENUM(NSInteger,UMPredefineLaunchType){
 UMPredefineLaunchType_DidFinishLaunchingEnd,// set in the last sentence of the didFinishLaunchingWithOptions
 UMPredefineLaunchType_ViewDidLoadEnd,// the last call to the viewDidLoad function of the first ViewController
 UMPredefineLaunchType_ViewDidAppearEnd // the last call to the viewDidAppear function of the first ViewController
};
Example on the end of the initialization duration
Users need to be in the system callback function of the didFinishLaunchingWithOptions function last buried point to ensure accuracy
#import <UMAPM/UMLaunch.h>

- (BOOL)application:(UIApplication *)application didFinishLaunchingWithOptions:(NSDictionary *)launchOptions {

   [QTConfigure initWithAppkey:@"Your AppKey" channel:@"App Store"];

   // bury the last point in the didFinishLaunchingWithOptions to ensure accuracy
   [UMLaunch setPredefineLaunchType:UMPredefineLaunchType_DidFinishLaunchingEnd];

   return YES;
}
Example on the end of the first page loading duration
You need to use the viewDidAppear function of the first ViewController to ensure accuracy.
#import <UMAPM/UMLaunch.h>

- (void)viewDidAppear {

  [super viewDidAppear];

  // The last tracking point in viewDidAppear.
  [UMLaunch setPredefineLaunchType:UMPredefineLaunchType_ViewDidAppearEnd];
 }
Custom stage tracking point
User-defined stage tracking can only be performed in the cold start stage. You can collect statistics on the execution time of a function or code block to help you refine the start stage.
Please note that:
1. You must pair the beginLaunch and endLaunch processes.
2. You must call the beginLaunch and endLaunch methods before the viewDidAppear method. Subsequent calls are invalid.
3. The length of the beginLaunch and endLaunch parameters cannot be greater than 10 characters.
4. The number of beginLaunch and endLaunch pairs cannot exceed 10. If the number of beginLaunch and endLaunch pairs exceeds 10, the subsequent ones are discarded.
The related API is as follows:
/*
 * Users set their own custom phase in the cold or hot start phase
 * @note BeginLaunch and endLaunch must be called together.
 * If the call time period is not called before the end of the page loading duration, it will not be reported.
 */
+ (void)beginLaunch:(NSString *)methodName;
+ (void)endLaunch:(NSString *)methodName;
Example:
#import <QTCommon/QTCommon.h>
#import <UMAPM/UMLaunch.h>

- (BOOL)application:(UIApplication *)application didFinishLaunchingWithOptions:(NSDictionary *)launchOptions {

    [UMLaunch beginLaunch:@"initCommon"];
    [QTConfigure initWithAppkey:@"Your AppKey" channel:@"App Store"];
    [UMLaunch endLaunch:@"initCommon"];
    [UMLaunch setPredefineLaunchType:UMPredefineLaunchType_DidFinishLaunchingEnd];

    return YES;
}
2.5 Network Analysis
2.5.1 Network analysis scope
Currently, the network module supports iOS system URL Loading System, and supports iOS8 and above operating systems.
NSURLSession supports most common API network captures (HTTP or HTTPS).
currently does not support NSURLConnection-related APIs for earlier versions of iOS. Socket capture is not currently supported.
All versions of AFNetworking are supported.
Note: When the third-party SDK for NSURLProtocol is integrated, system version incompatibility may cause a crash. For more information, see Section 2.5.3.
2.5.2 Description of network analysis capture content
The network module now captures the start and end time of each stage of the network, the upstream and downstream traffic, and the corresponding URL
Note:
If you want to enable the network feature, you must enable the network configuration items feature before the app initiates the network feature to capture full data. Otherwise, the network capture feature may lose data or become invalid.
When the network library is used together with other three-party network libraries, conflicts may occur, resulting in network module failure.
1. Please check the enableNetworkForProtocol function description and call it as required.
Example:
#import <UMEFS/UMEFS.h>
#import <UMEFS/UMEFSConfig.h>
#import <UMEFS/UMEFSConfigure.h>
#import <QTCommon/QTCommon.h>

- (BOOL)application:(UIApplication *)application didFinishLaunchingWithOptions:(NSDictionary *)launchOptions {

    NSLog(@"UMEFS version:%@",[UMEFSConfigure getVersion]);
    UMEFSConfig* configForEFS = [UMEFSConfig defaultConfig];
    configForEFS.networkEnable = YES;
    configForEFS.launchMonitorEnable = YES;
    configForEFS.memMonitorEnable = YES;
    configForEFS.javaScriptBridgeEnable = YES;
    configForEFS.oomMonitorEnable = YES;
    [UMEFSConfigure setAPMConfig:configForEFS];

    [QTConfigure setCustomDomain:@"Your collection service domain name" standbyDomain:@""];
    [QTConfigure initWithAppkey:@"Your AppKey" channel:@"App Store"];

    return YES;
}
2. Check whether the log check takes effect
Once the network module takes effect, it will print the following log in xcode to indicate success: UMAPM_NetworkSampling after printing YES, it means that the network module is enabled and sampling takes effect.
2021-09-13 14:24:24.962273+0800 QTAPMDemo[386:36277] UMAPM_NetworkEnable(1:1):1 2021-09-13 14:24:24.977290+0800 QTAPMDemo[386:36277] UMAPM_NetworkSampling(1,1):YES
After the log is displayed, you can send a network request to test whether the backend server can receive the request. The following sample network code shows the request. After the request is sent, you can view the request with the corresponding URL on the backend interface.
// Because the Get request is cached, the content of the response is directly obtained and returned locally.
#define NetworkURL @"https://www.aliyun.com/"

NSMutableURLRequest *request = [[NSMutableURLRequest alloc] initWithURL:[NSURL URLWithString:NetworkURL]];
request.HTTPMethod = @"GET";
[request addValue:@"application/html" forHTTPHeaderField:@"Content-Type"];

NSURLSessionDataTask* dataTask = [[NSURLSession sharedSession] dataTaskWithRequest:request completionHandler:^(NSData * _Nullable data, NSURLResponse * _Nullable response, NSError * _Nullable error) {

  if (data) {
      NSString* str = [[NSString alloc] initWithData:data encoding:NSUTF8StringEncoding];
      NSLog(@"str:%@",str);
  } else if (error) {
      NSLog(@"error:%@",error);
  }
}];
[dataTask resume];
2.5.3 Notes on integrating NSURLProtocol and performance monitoring network analysis module
Increase the network analysis module in iOS13 and below the system's separate switch, in order to avoid at the same time integrated NSURLProtocol and APM SDK network module itself conflict caused by crash, especially increase the enableNetworkForProtocol function.
Problem phenomenon please see: the https://developer.umeng.com/docs/193624/detail/352123
The configured function is described as follows:
/**
 * @brief sets the separate switch of APM's network module for iOS13 and below systems to avoid crashes caused by conflicts between network modules that integrate NSURLProtocol and APM SDK at the same time.
 * If you need to call this operation, call this operation before you initialize the network module of the APM SDK.
 *
 * @param enable specifies the switch. YES: captures iOS13 and the following specific network requests. This is enabled by default. NO: iOS 13 and the following specific network requests are not captured.
 *
 * @note Cause: If you integrate NSURLProtocol and the network module of APM SDK, you initialize the network module of APM SDK first, and then initialize registerClass of NSURLProtocol, which will cause the crash in iOS13 and later versions. Currently, it can be determined that the problem is caused by iOS system API, and iOS14 does not have this problem. (Initialize the registerClass of NSURLProtocol first, and then initialize the network module of APM SDK, which will not cause problems.)
 * Compatible with iOS13 and the following initialization codes:
 * @example:
 * // Make sure that NSURLProtocol is initialized in the APM SDK.
 * [NSURLProtocol registerClass:[UMURLProtocol class]];
 * UMAPMConfig* config = [UMAPMConfig defaultConfig];
 * config.networkEnable = YES;
 * [UMCrashConfigure setAPMConfig:config];
 * [QTConfigure initWithAppkey:@"Your AppKey" channel:@"App Store"];
 *
 * @note
 * This switch is turned on by default. When you integrate the network modules of both NSURLProtocol and APM SDK, you can call this switch as needed. If you follow the preceding initialization sequence, you do not need to call this switch.
 *
 * @note After this function is disabled and takes effect, the network module will not be completely disabled, but specific network requests will not be captured. If developers can know the scenario of integrating NSURLProtocol and APM network modules at the same time, it is recommended to adjust the initialization smoothly to be compatible with all scenarios and test compatibility in iOS13 and below versions.
 * @note: In other scenarios, you do not need to call this function.
 */
+(void)enableNetworkForProtocol:(BOOL)enable;
Example:
#import <UMEFS/UMEFSConfigure.h>

[UMEFSConfigure enableNetworkForProtocol:YES];
2.6 Memory Analysis
Before you initialize the SDK, set the memMonitorEnable property of the UMEFSConfig instance to YES. By default, this property is enabled.
#import <UMEFS/UMEFS.h>
#import <UMEFS/UMEFSConfig.h>
#import <UMEFS/UMEFSConfigure.h>
#import <QTCommon/QTCommon.h>

- (BOOL)application:(UIApplication *)application didFinishLaunchingWithOptions:(NSDictionary *)launchOptions {

    UMEFSConfig* configForEFS = [UMEFSConfig defaultConfig];
    configForEFS.networkEnable = YES;
    configForEFS.launchMonitorEnable = YES;
    configForEFS.memMonitorEnable = YES;
    configForEFS.javaScriptBridgeEnable = YES;
    configForEFS.oomMonitorEnable = YES;
    configForEFS.pageMonitorEnable = YES;
    [UMEFSConfigure setAPMConfig:configForEFS];

    [QTConfigure setCustomDomain:@"Your collection service domain name" standbyDomain:@""];
    [QTConfigure initWithAppkey:@"Your AppKey" channel:@"App Store"];

    return YES;
}
2.7 OOM exception
You can enable the OOM module by configuration items the oomMonitorEnable option to YES.
Take note of the following items:
1. When an OOM is triggered, the app cannot be in debugging mode, which is similar to a crash.
2. OOM is uploaded at the next startup, and the next startup cannot be in debugging mode.
both of the preceding steps, the debug mode is disabled. Otherwise, the monitoring and identification of Oom will be affected.
To enable the OOM module, you must integrate the UMAPM.framework and UMEFS.framework libraries.
In Release mode, if the test device is connected to Xcode by a data cable, data reporting is also affected.
Example:
#import <UMEFS/UMEFS.h>
#import <UMEFS/UMEFSConfig.h>
#import <UMEFS/UMEFSConfigure.h>
#import <QTCommon/QTCommon.h>

- (BOOL)application:(UIApplication *)application didFinishLaunchingWithOptions:(NSDictionary *)launchOptions {

    UMEFSConfig* configForEFS = [UMEFSConfig defaultConfig];
    configForEFS.networkEnable = YES;
    configForEFS.launchMonitorEnable = YES;
    configForEFS.memMonitorEnable = YES;
    configForEFS.javaScriptBridgeEnable = YES;
    configForEFS.oomMonitorEnable = YES;
    configForEFS.pageMonitorEnable = YES;
    [UMEFSConfigure setAPMConfig:configForEFS];

    [QTConfigure setCustomDomain:@"Your collection service domain name" standbyDomain:@""];
    [QTConfigure initWithAppkey:@"Your appkey" channel:@"App Store"];

    return YES;
}
2.8 H5 page analysis
Before you initialize the SDK, set the javaScriptBridgeEnable property of the UMEFSConfig instance to YES. By default, this parameter is enabled.
#import <UMEFS/UMEFS.h>
#import <UMEFS/UMEFSConfig.h>
#import <UMEFS/UMEFSConfigure.h>
#import <QTCommon/QTCommon.h>

- (BOOL)application:(UIApplication *)application didFinishLaunchingWithOptions:(NSDictionary *)launchOptions {

    UMEFSConfig* configForEFS = [UMEFSConfig defaultConfig];
    configForEFS.javaScriptBridgeEnable = YES;
    [UMEFSConfigure setAPMConfig:configForEFS];

    [QTConfigure initWithAppkey:@"Your AppKey" channel:@"App Store"];

    return YES;
}
After the H5 page embedded in the app is integrated with the APM SDK, you need to set the whitelist of the app application package name. In the bridging scenario, the H5 page does not need to set the receiving domain name.
Example:
import { init } from '@umengfe/apm';
init({
  pageFilter: {
    mode: 'ignore',
    rules: []
  },
  pid: 'Your AppKey',
  pkgList:['Your app package nay']
});
2.9 native pages
Module switch
Before you initialize the SDK, set the pageMonitorEnable property of the UMEFSConfig instance to YES. By default, this parameter is enabled.
#import <UMEFS/UMEFS.h>
#import <UMEFS/UMEFSConfig.h>
#import <UMEFS/UMEFSConfigure.h>
#import <QTCommon/QTCommon.h>

UMEFSConfig* configForEFS = [UMEFSConfig defaultConfig];
configForEFS.pageMonitorEnable = YES;
[UMEFSConfigure setAPMConfig:configForEFS];

// Initialize QTConfigure.
[QTConfigure initWithAppkey:@"Your AppKey" channel:@"App Store"];
Custom tracking point
It is used to count the execution time of a function or code block, which is convenient for customers to refine the startup phase.
Note:
1. You must pair the trackBegin and trackEnd fields.
2. You must call the trackBegin and trackEnd operation before the viewDidAppear operation ends. Subsequent calls are invalid.
3. The length of the trackBegin and trackEnd parameters cannot exceed 10 characters.
4. The number of trackBegins and trackEnds cannot be greater than six (based on methodName).
@interface UMPage : NSObject

+ (void)trackBegin:(NSString *)methodName viewController:(UIViewController *)vc;
+ (void)trackEnd:(NSString *)methodName viewController:(UIViewController *)vc;

@end
2.10 log recovery
2.10.1 Module Switch
Before you initialize the SDK, set the logCollectEnable property of the UMEFSConfig instance to YES. By default, this parameter is enabled.
If you need a custom user ID (identifying ID), you can set the logCollectUserId:
The logCollectUserId is valid within the lifecycle of a single cold start and cannot be changed.
logCollectUserId length cannot exceed 128 bytes
2.10.2 Log Dot Interface
The Log Togger interface provides a total of five different types of log levels, which represent the five levels of log severity. You can filter logs when you view them on the platform.
@interface UAPMLog : NSObject

+ (void)verbose:(NSString *)tag format:(NSString *)format, ... NS_FORMAT_FUNCTION(2,3);

+ (void)debug:(NSString *)tag format:(NSString *)format, ... NS_FORMAT_FUNCTION(2,3);

+ (void)info:(NSString *)tag format:(NSString *)format, ... NS_FORMAT_FUNCTION(2,3);

+ (void)warn:(NSString *)tag format:(NSString *)format, ... NS_FORMAT_FUNCTION(2,3);

+ (void)error:(NSString *)tag format:(NSString *)format, ... NS_FORMAT_FUNCTION(2,3);

@end
Introduce the header file:
#import <UMEFS/UAPMLog.h>Parameter limits:
Tag limit: 64 bytes
msg limit: 1024 bytes
Example:
[UAPMLog verbose:@"verbose_test" format:@"Test verbose type logs"];
[UAPMLog debug:@"debug_test" format:@"Test debug log"];
[UAPMLog info:@"info_test" format:@"Test info type log"];
[UAPMLog warm:@"warn_test" format:@"Test a warm log"];
[UAPMLog error:@"error_test" format:@"Test error type log"];
2.11 front and rear links
This feature is not required. To use this feature, you need to access the EFS SDK 2.3.0 version or later.
This feature is used to inject custom headers into HTTP requests initiated by iOS applications. This feature is used to meet the needs of front-end and back-end connection scenarios.
Call example
#import <UMEFS/UMEFS.h>
#import <UMEFS/UMEFSConfig.h>
#import <UMEFS/UMEFSConfigure.h>
#import <QTCommon/QTCommon.h>

- (BOOL)application:(UIApplication *)application didFinishLaunchingWithOptions:(NSDictionary *)launchOptions {

    UMEFSConfig* configForEFS = [UMEFSConfig defaultConfig];
    ...
    configForEFS.rumConfig = @{
        @"injectTraceHeader": @"traceparent",
        @"needTracedUrls":@[@"/v1/trace", @"^/v1/trace$", ...],
        @"ignoredUrls": @[@"/v1/trace", @"^/v1/trace$", ...],
    };
    [UMEFSConfigure setAPMConfig:configForEFS];

    [QTConfigure setCustomDomain:@"Your collection service domain name" standbyDomain:@""];
    [QTConfigure initWithAppkey:@"Your appkey" channel:@"App Store"];

    return YES;
}
Detailed Description
Property | Meaning | Default | Type |
injectTraceHeader | The SDK will inject the specified request header into the network request of the iOS application and automatically generate the relevant protocol field. | Empty | Enumeration Value
|
needTracedUrls | The whitelist of URLs for end-to-end monitoring is empty by default. | nil. The default value indicates that the whitelist is empty. If you set this parameter, only request URLs that meet the rule are injected into the request header. | Array type, element support
|
ignoredUrls | Urls injection blacklist for end-to-end monitoring. Default value: null. | null. This default value indicates that the blacklist is empty. If you set this value, only request URLs that meet the rule are not injected into the request header. | Array type, element support
|
injectSDKRequest | Specifies whether to inject the request header into the SDK internal request. The default value is NO, that is, no injection is performed. | NO. This default value indicates that the request header is not injected into the internal request URL of the SDK. | Boolean type |
3. Configure the symbol table
3.1 what is a symbol table
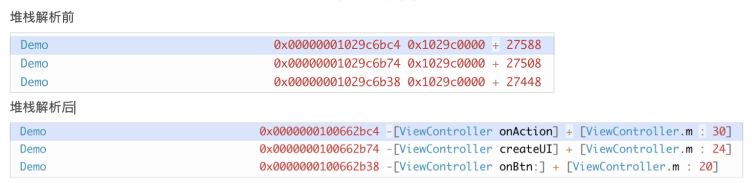
The symbol table is a mapping table between memory addresses and function names, file names, and line numbers. The symbol table elements are as follows: <start address> <end address> <function> [<file name: line number>] In order to quickly and accurately locate the user APP occurrence code location of Crash we use the symbol table program of Crash on APP stack proceed parse and restore.
3.2 why upload a symbol table?
To quickly and accurately locate the crash code, use the symbol table to parse and restore.
give an example
Performance monitoring provides a manual upload of symbol tables
3.3 iOS symbol table configuration mode
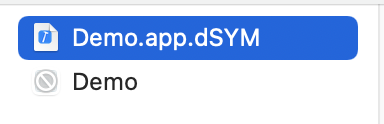
What is a dsym file?
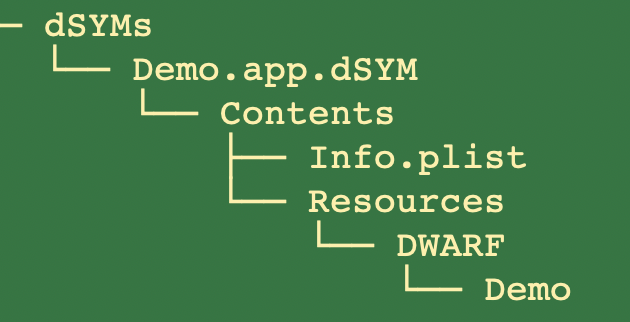
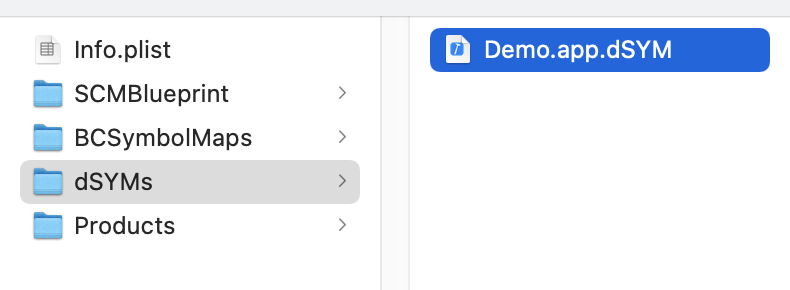
In iOS, dSYM files are object files that contain debugging information. dSYM files store information such as file names, method names, and line numbers. dSYM files correspond to hexadecimal function addresses of executable files. You can analyze crashed files to obtain specific crash information. The file name is usually: xxx.app.dSYM, where xxx usually represents the binary package name of the application, as shown in the following figure:
You can view the dSYM file and the directory schema in the Xcode package.
How do I locate the dsym file?
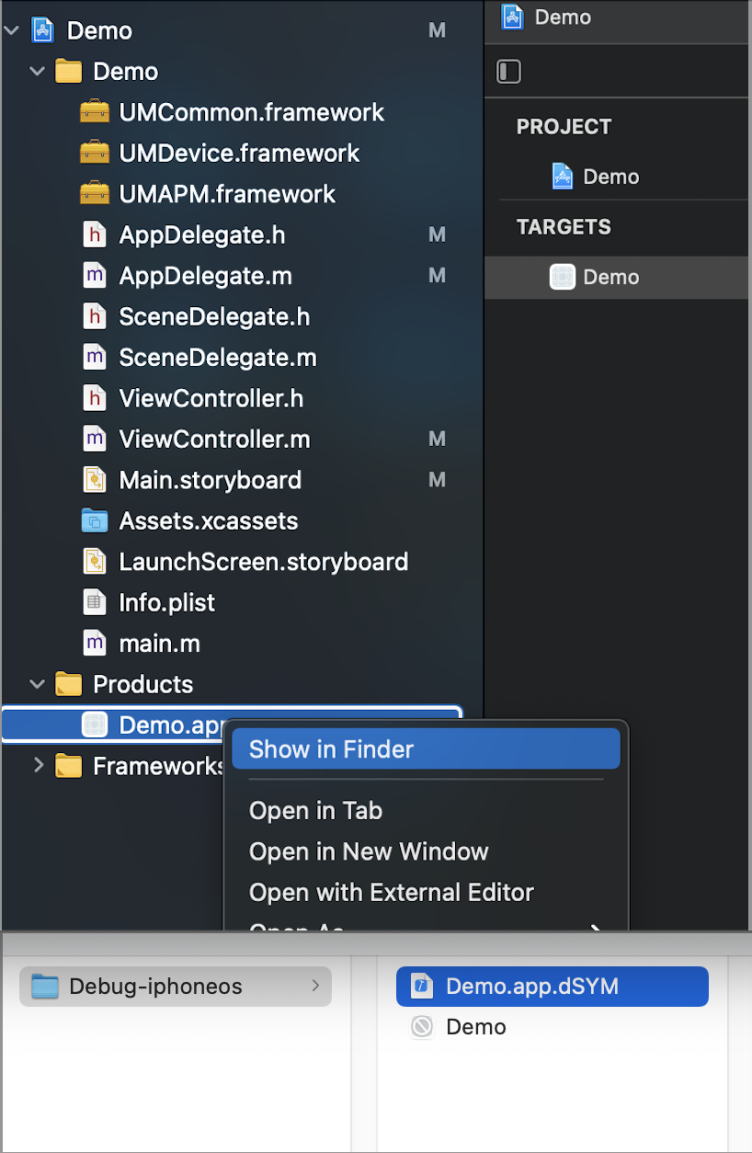
Obtain in Project
In most cases, the compiled dSYM file is in the same directory as the app file. The following section uses XCode as the IDE to describe how to locate the dSYM file.
-> Enter XCode;
-> Open the project (compiled);
-> Find the "Product" item in the left column;
-> Right-click xxx.app
-> Click "Show in Finder";
As shown in the following figure:
If you have multiple dSYM files, you can specify the directory where the dSYM files are located or the project directory when you use the tool.
3.4 other symbol table related issues
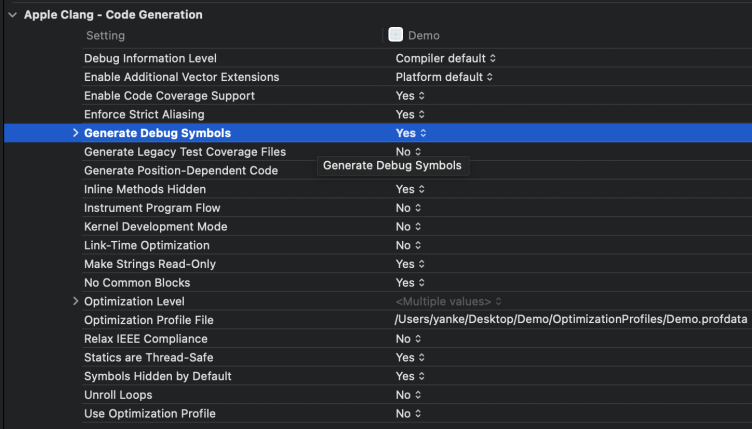
1. No dSYM file is generated after XCode compilation?
By default, the XCode Release compiler generates a dSYM file. However, the Debug compiler does not generate a dSYM file. The corresponding Xcode configuration is as follows:
XCode -> Build Settings -> Code Generation -> Generate Debug Symbols -> Yes
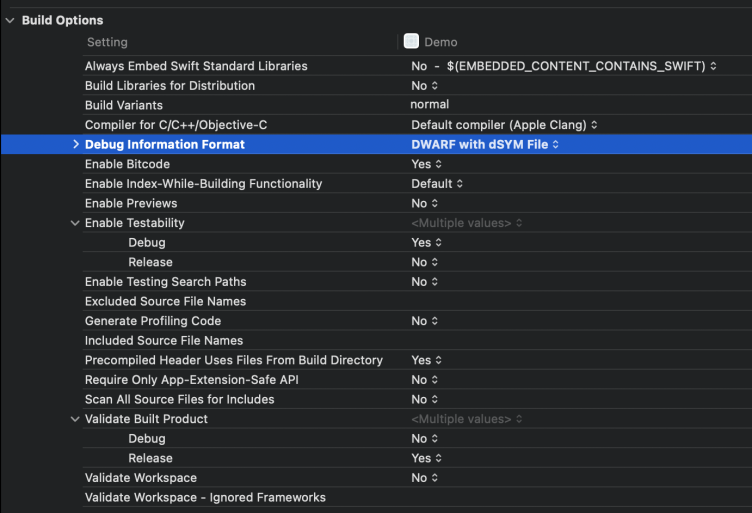
XCode -> Build Settings -> Build Option -> Debug Information Format -> DWARF with dSYM File
2. What do I need to pay attention to after I enable Bitcode?
At the point "Upload to App Store" uploaded to the App Store server, it is necessary to declare the symbol file (dSYM file) generation:
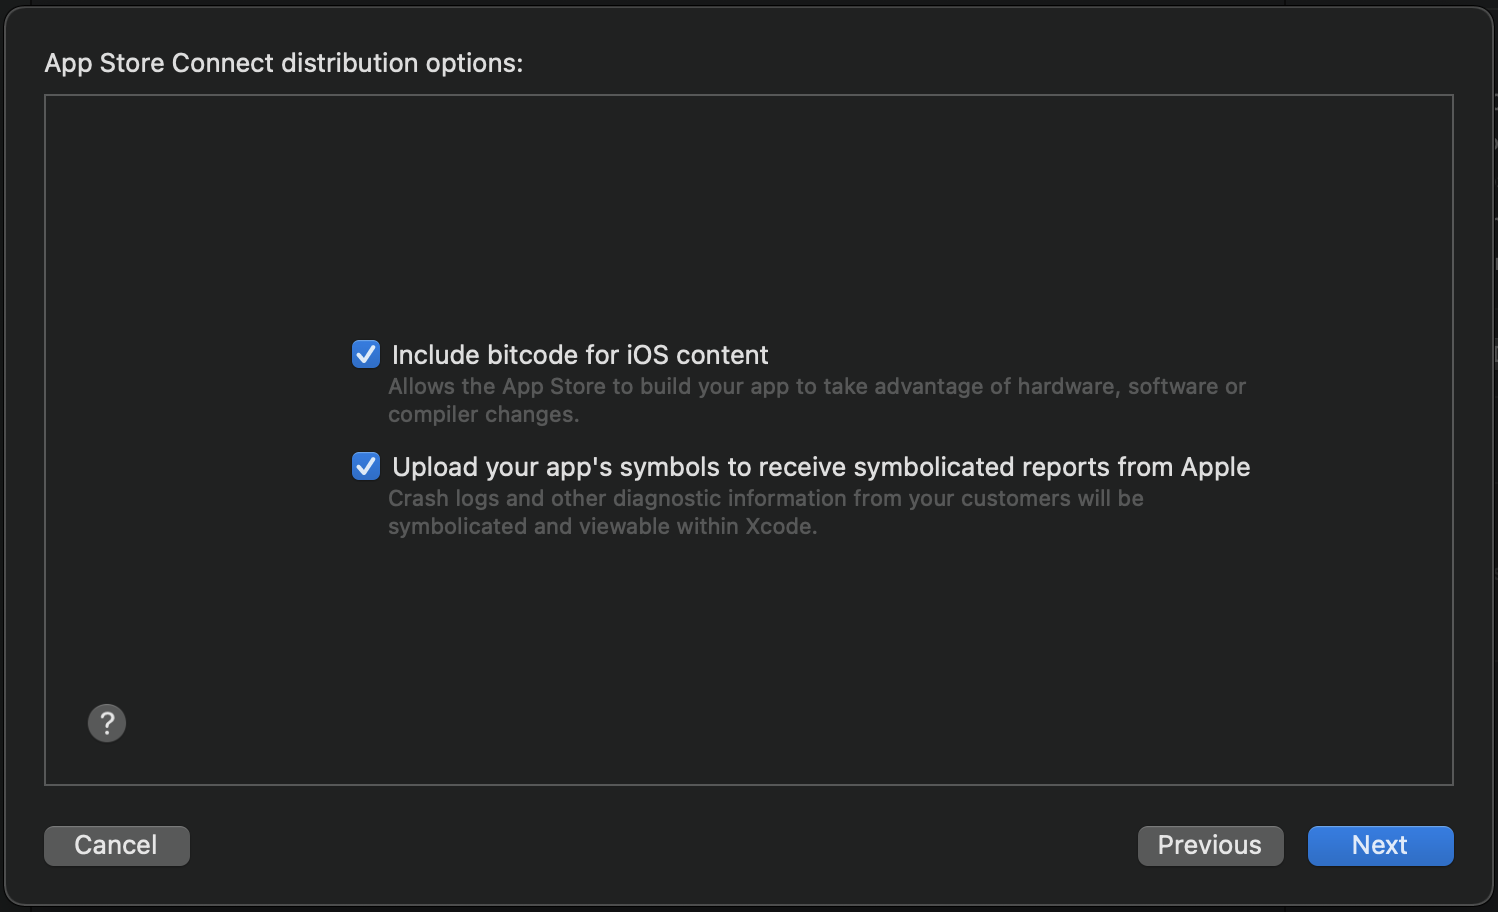
Before you configure the symbol table file, you must download the dSYM file of this version from the App Store, as shown in the following figure.
Note:
do not use locally generated dSYM files to generate symbol table files. Since the symbol table information of the dSYM file generated by local compilation is hidden, if the symbol table file generated by local compilation is generated by dSYM file and configured to the U-APM platform, the restored result will be a symbol similar to "__hiden#XXX".
3. How do I determine whether the dSYM file matches the UUID of the stack?
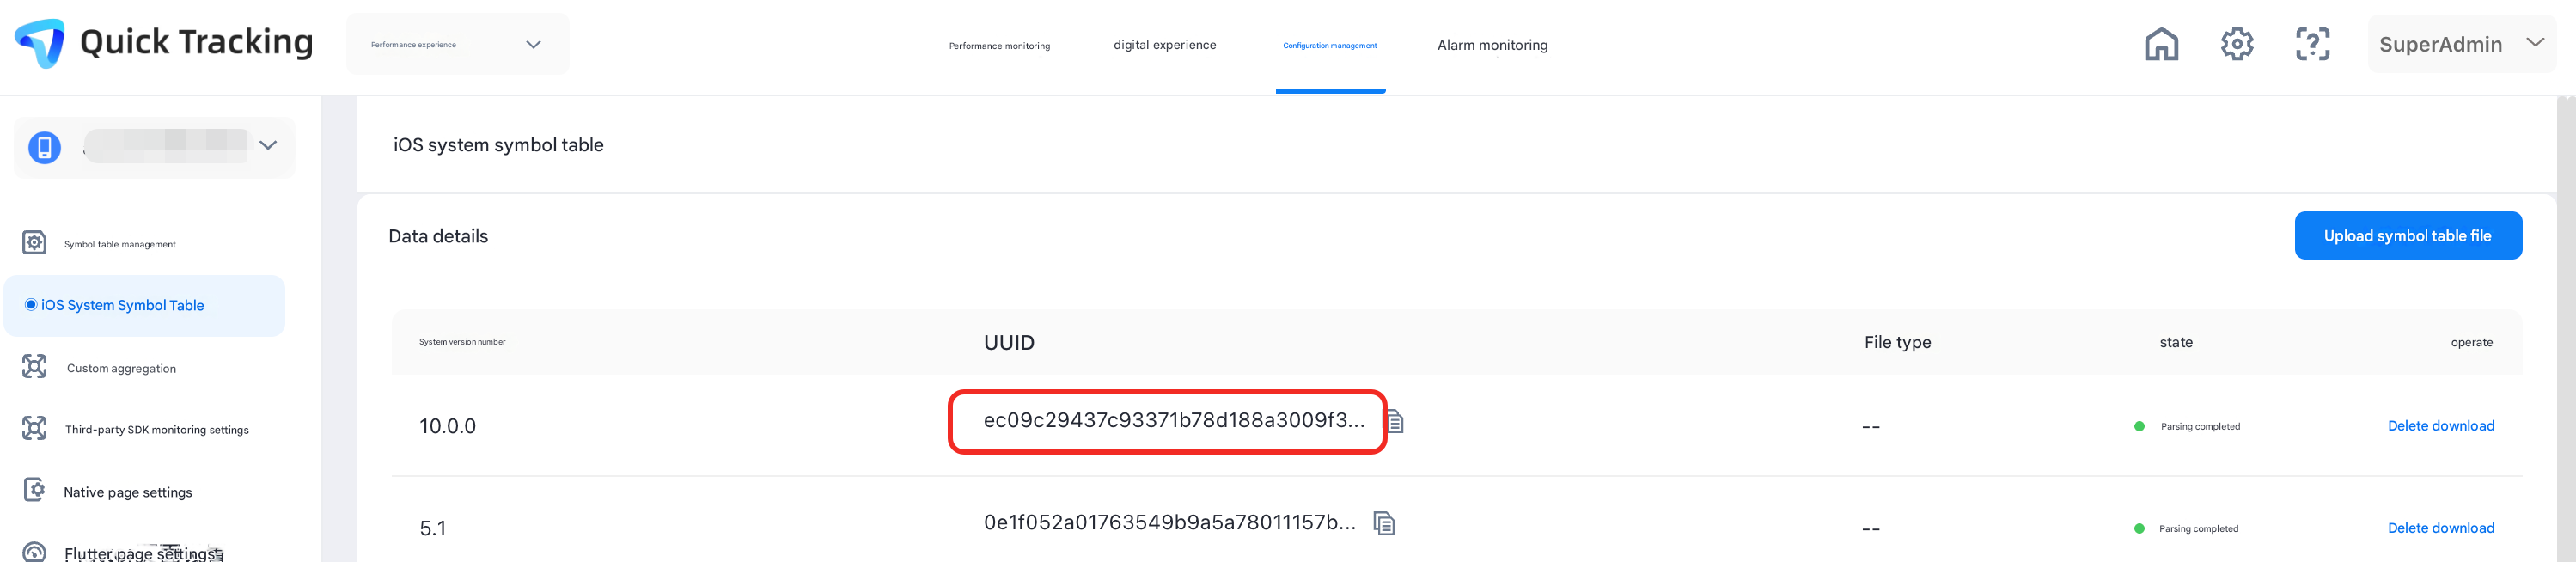
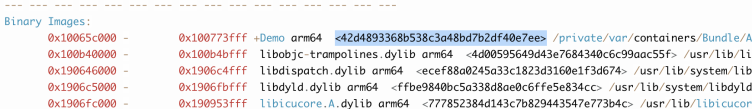
When you restore a stack after a crash, you must match the UUID of the symbol table file. Therefore, the stack can be accurately restored only when the UUID of the uploaded symbol table file is the same as the UUID of the corresponding app.
Make sure that the UUID of the selected version in APM Symbol Table Management is the same as the UUID of Binary Images in the crash stack. The value 0 at the end of the UUID in Symbol Table Management can be ignored.
4. How do I view the UUID of a dSYM file?
Run a command to view the UUID
xcrun dwarfdump --uuid <dSYM file>
View the UUID of a symbol table file
The UUID of the symbol table file is the same as that of the dSYM file. You can view the UUID of the dSYM file by using the symbol table tool.
Generate a symbol table file (.zip) ---> Decompress the symbol table file (.symbol) ---> Use a text editor to open the symbol table file
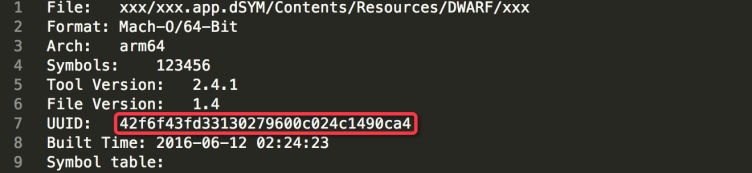
The UUID of the symbol table file is the UUID of the Debug SO file and the UUID of the symbol table file. If the file is large, we recommend that you use a text editor such as Sublime Text to open the symbol table file.
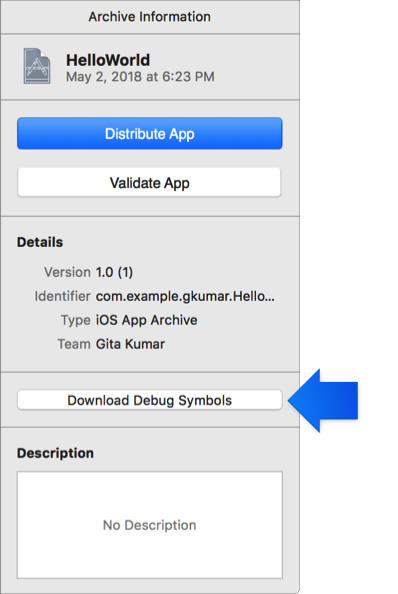
5. How do I retrieve the dSYM file of an app that has been published to the App Store?
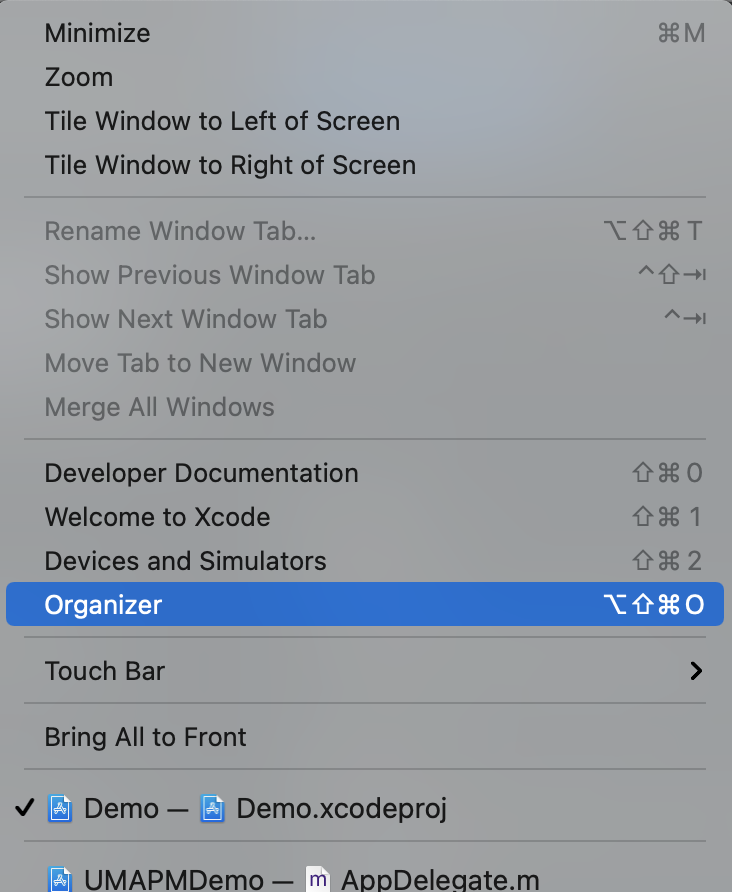
Retrieve data by using Xcode
1. Open the Xcode top menu bar-> Window -> Organizer window:
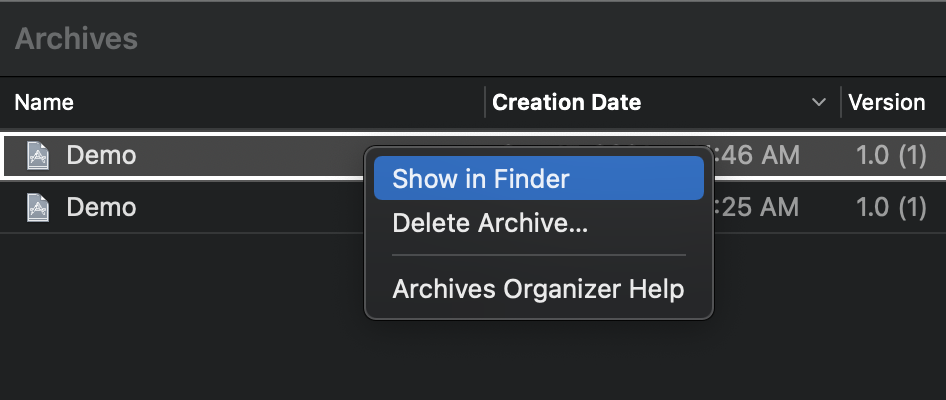
2. Find the published archive package, right-click the archive package, and then select Show in Finder.
3. Right-click the target archive file and choose Show Package Content from the shortcut menu.
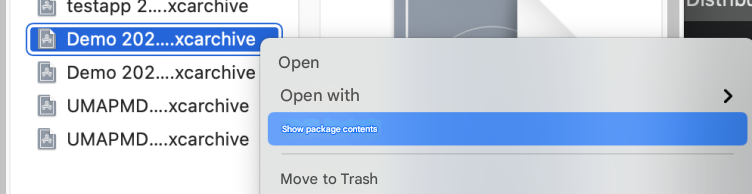
4. Select the dSYMs directory. The directory contains the downloaded dSYM file.
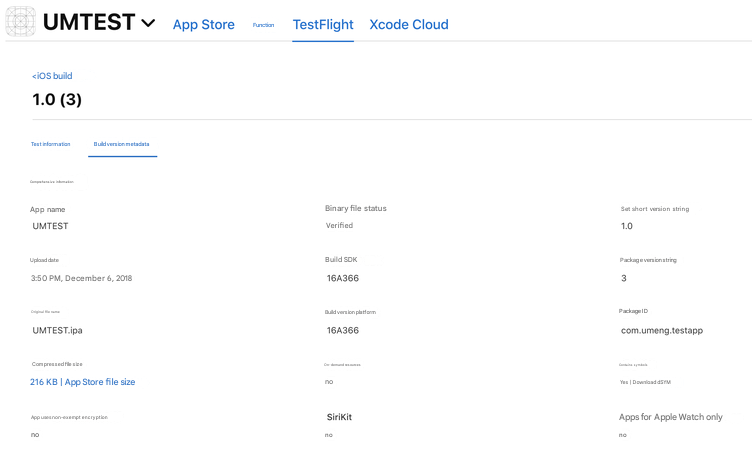
Retrieve via iTunes Connect
1. Log on to the iTunes Connect;
2. Go to the TestFlight page.
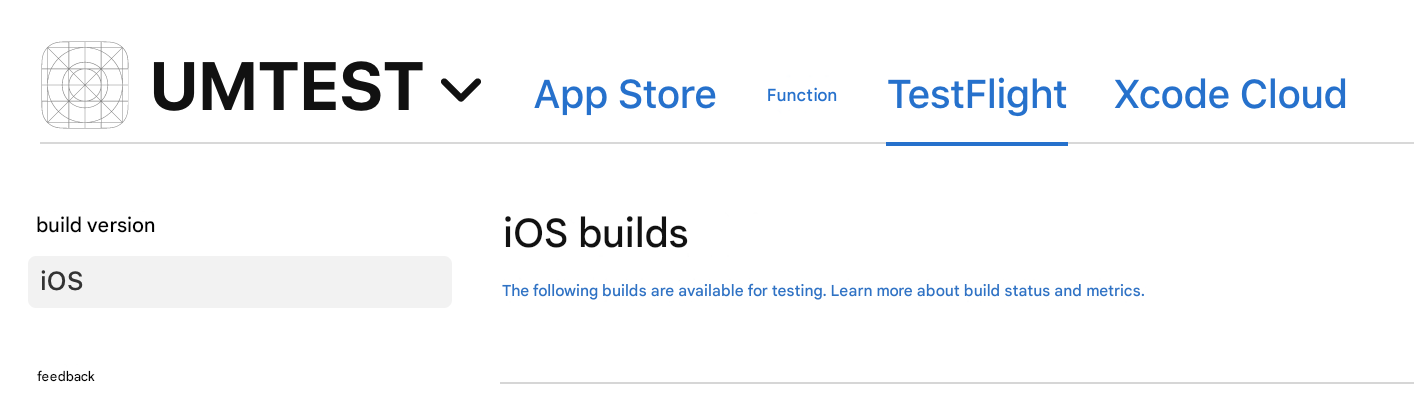
3. Select a version and click Download dSYM to download the dSYM file.
Retrieve data by using the mdfind tool
On the U-APM error details page, find the UUID of the crash:
Then, in the Mac shell, use the mdfind command to locate the dSYM file:
mdfind"com_apple_xcode_dsym_uuids == <UUID>"
Note: If you use mdfind, you must convert the UUID to the following format: 12345678-1234-1234-1234-xxxxxxxxxx
For example, if the UUID of the dSYM file is: E30FC309DF7B3C9F8AC57F0F6047D65F, run the following command to locate the dSYM file:
mdfind"com_apple_xcode_dsym_uuids == E30FC309-DF7B-3C9F-8AC5-7F0F6047D65F"|12345678-1234-1234-1234-xxxxxxxxxxxx|
We recommend that you back up the dSYM file of the app every time you build or publish an app version.
Supported upload methods: manual upload in the background (up to 400 MB)
3.5 symbol table in the product use
Version selection
You can select a version list or manually enter a version.
If there are already errors reported to the U-APM background version, you can directly upload symbol table version drop-down box to select
If a new version is to be released, you can manually enter the version number. Enter the version number that is exactly the same as the version, and click Add Version Number.
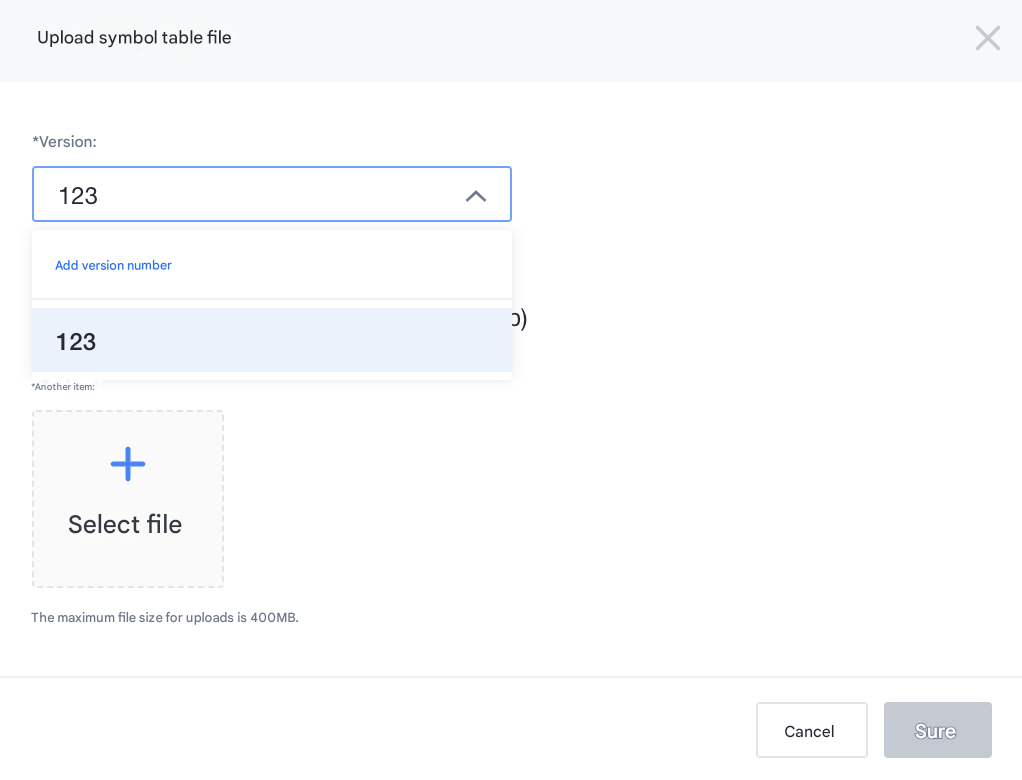
Follow the documentation to compress the symbol table files together
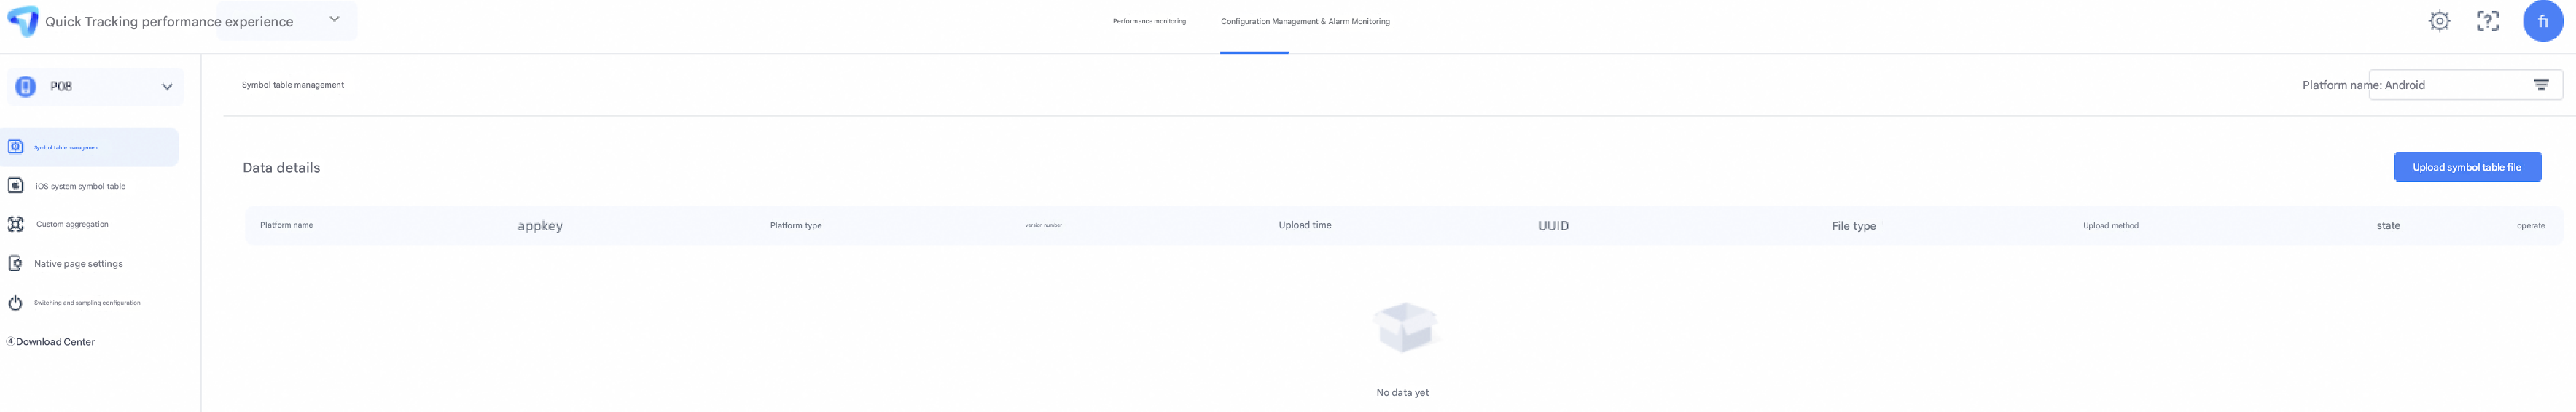
Log on to the platform, find the symbol table application that you want to upload, and click Settings in the top to go to the Application Settings page.
Click Upload to upload the compressed symbol table file.