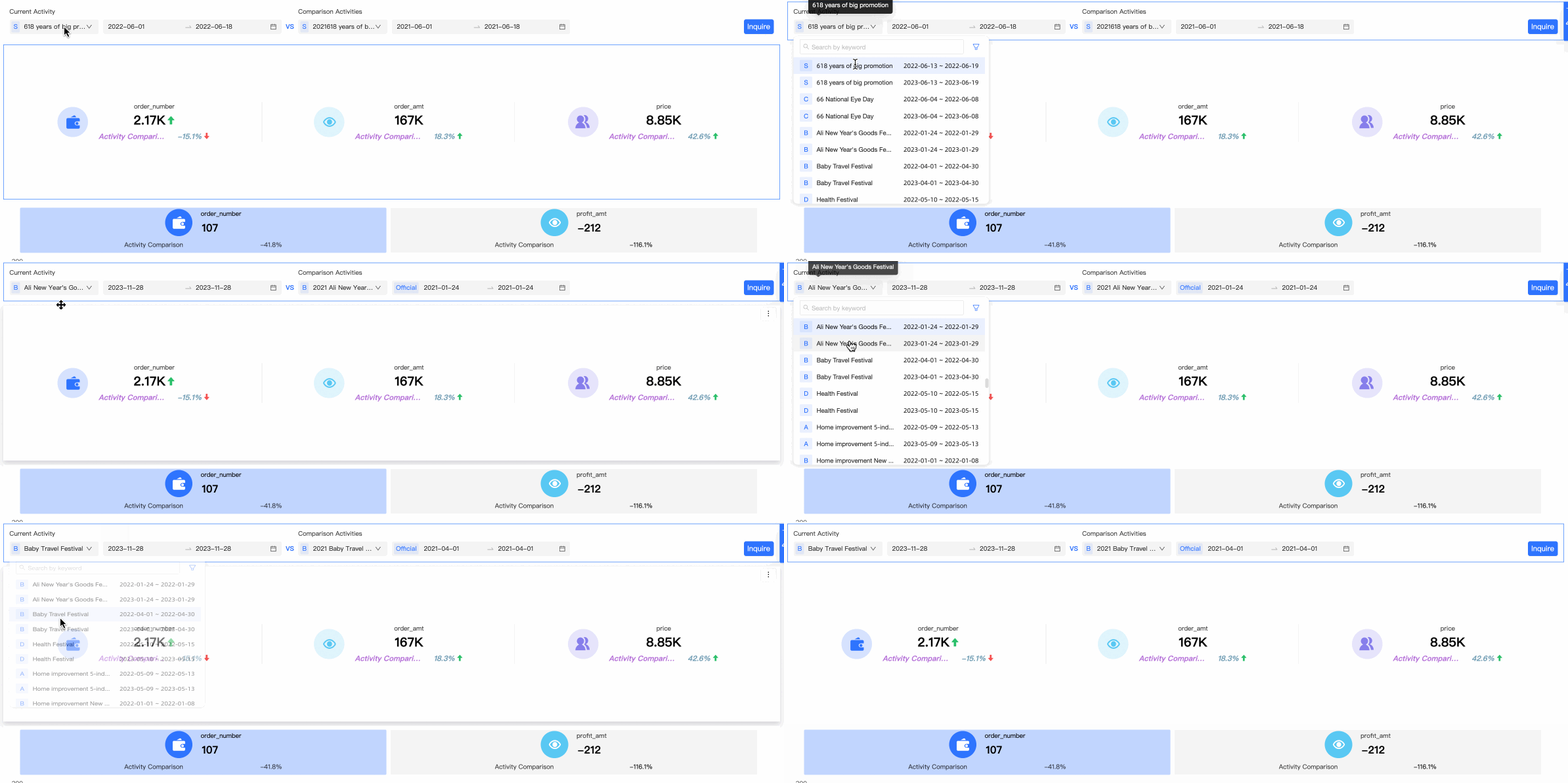
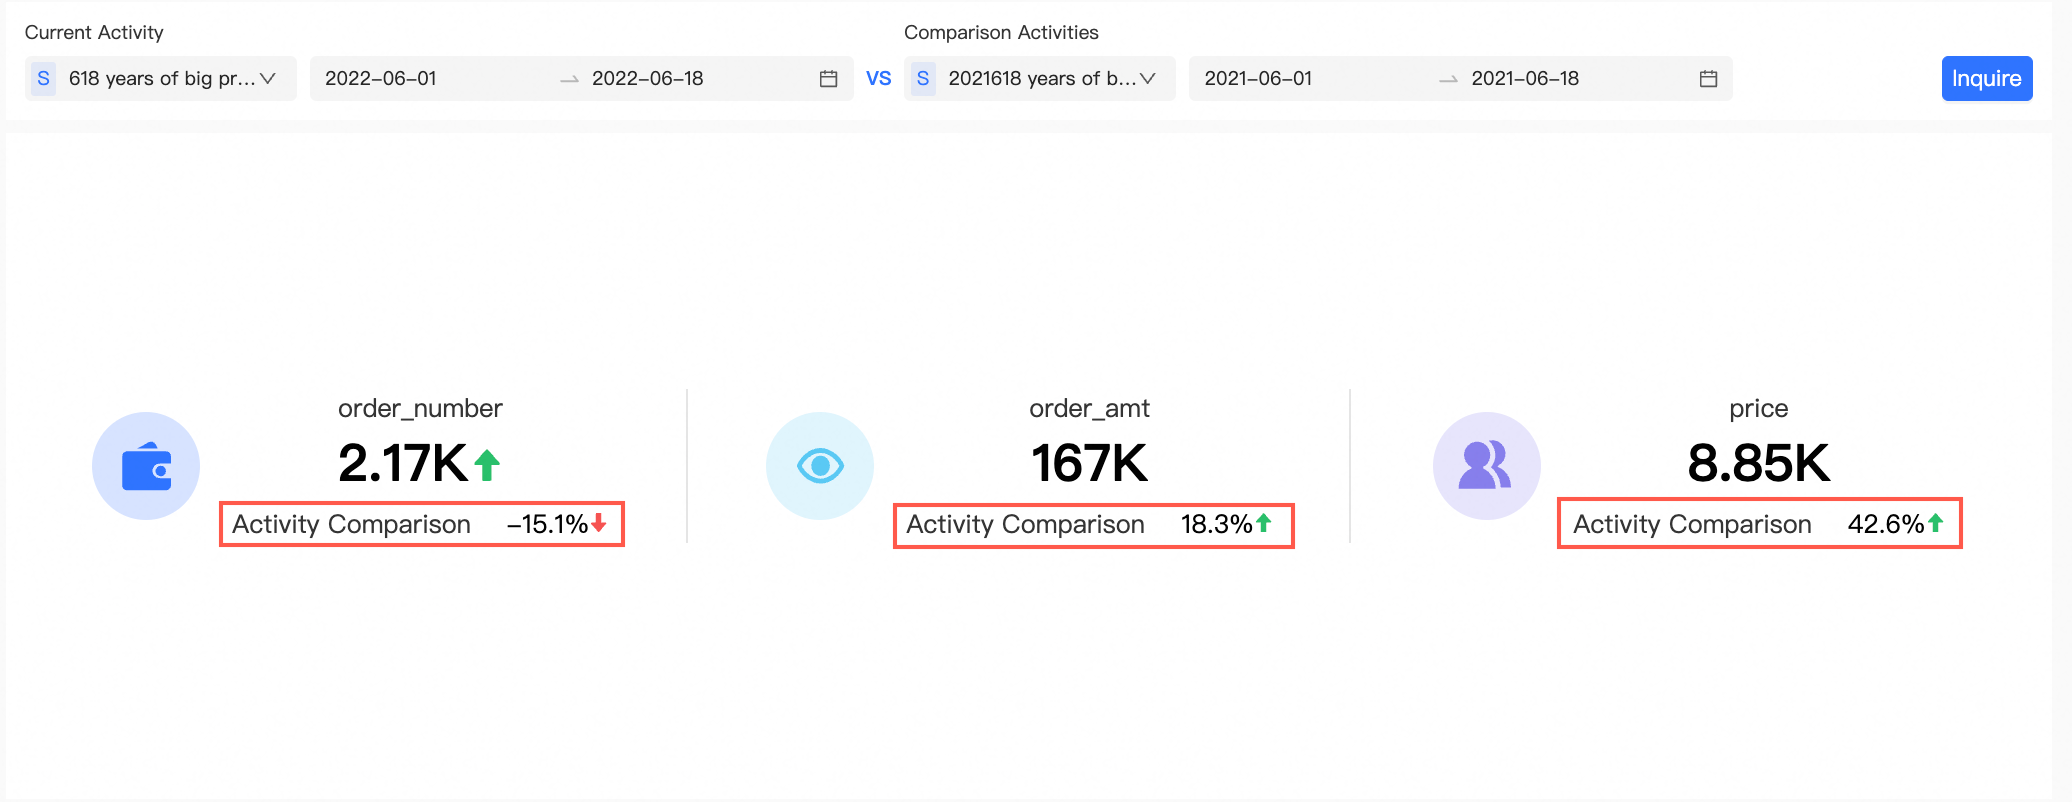
As a query control, the activity comparison control supports the analysis and display of individual activities and comparison activities. This topic describes how to use the Activity Compare control.
Scenario
When analyzing promotion activities, you can directly select an activity, a date, and compare activities and compare dates. For example, when the company analyzes this year's Double 11 activities, it selects last year's Double 11 activities for comparison activities and displays data through associated charts.
Limits
The associated chart configuration items supports only five types of charts: kanban, metric card trend chart, ranking, cross table, and detail table.
Prerequisites
Create an activity dataset. You can prepare different field content for the activity dataset based on the actual situation. Includes basic activity datasets and high-order activity datasets. In this example, the following dataset fields are used. You can specify the field names.
Basic activity dataset
Field | Field Description /Business Scenario | Description |
camp_id | The ID of the current activity. | Required |
camp_name | The name of the event, such as the 2022 Double 11 promotion. | Required |
camp_start_time | The start time of the activity, such as YYYYMMDD or YYYYMMDD HH:00:00 (if the activity started at an hour). | Required |
camp_end_time | The end time of the activity, such as YYYYMMDD or YYYYMMDD HH:00:00 (if the activity started at an hour). | Required |
High-order activity dataset
Field | Field Description /Business Scenario | Description |
camp_id | The ID of the current activity. | Required |
camp_name | The name of the event, such as the 2022 Double 11 promotion. | Required |
camp_start_time | The start time of the activity, such as YYYYMMDD or YYYYMMDD HH:00:00 (if the activity started at an hour). | Required |
camp_end_time | The end time of the activity, such as YYYYMMDD or YYYYMMDD HH:00:00 (if the activity started at an hour). | Required |
warmup_start_time | The start time of the warm-up phase. You can configure multiple phases, such as YYYYMMDD or YYYYMMDD HH:00:00 (if the activity starts from a certain hour). | No |
warmup_end_time | The end time of the warm-up phase, such as YYYYMMDD or YYYYMMDD HH:00:00 (if the activity started from a certain hour). | No |
camp_level | Activity level, which can be used as an activity filter. | No |
priority | The priority is related to the default value. When multiple activities are in progress at the same time today, the priority can be used to control which activity is displayed by default. By default, the activity with a large value is displayed. | No |
The ID type field in the active dataset. We recommend that you use the dimension type. Otherwise, the field cannot be identified.
Entry point
Entry 1: Query the empty state of a control
On the page of the created dashboard, click Query Control.
Click Add Activity Comparison Control in the Query Control section to go to the configuration dialog box.

Entry 2: The query control is not in the empty state.
In the query control of the configuration drop-down list, move the pointer over the icon in the upper-right corner
 .
. Click Add Activity Comparison Control to go to the configuration dialog box.

Description
After you go to the Settings tab, configure the Basic Information, Options, and Associated Charts sections.
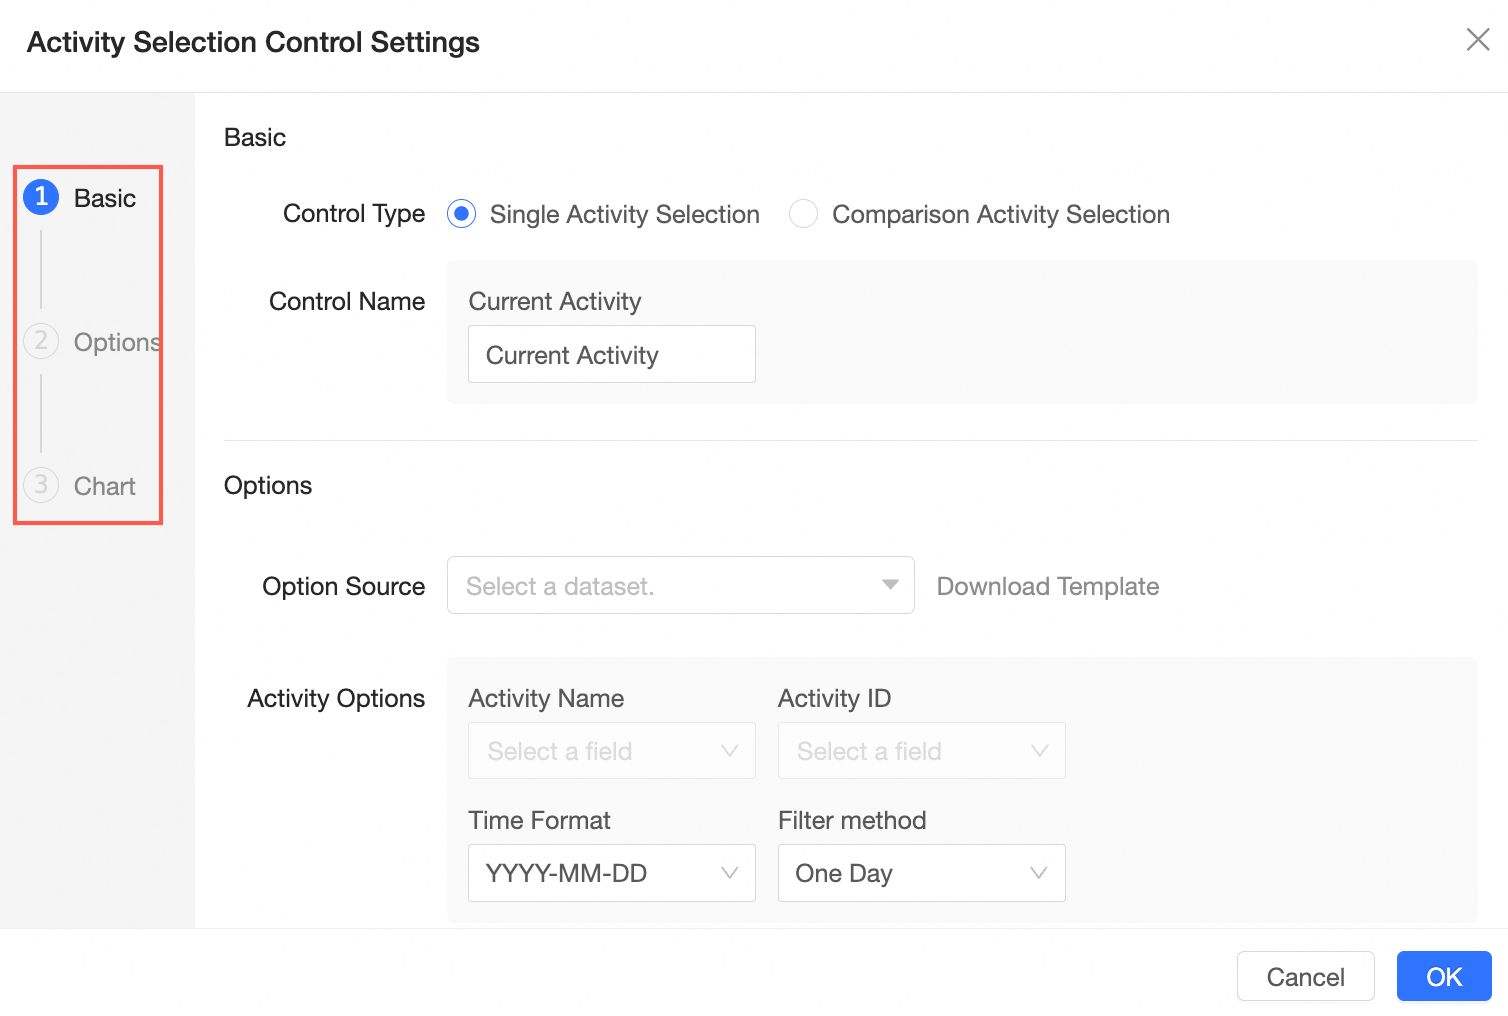
The following section describes the configuration items and the corresponding renderings. For more information, see Procedure.
Parameter | Configure renderings |
I. Basic information | |
|
|
2. Configure options | |
|
|
|
|
|
|
|
|
|
|
|
|
3. Associated charts | |
| After you select the content of the current activity, the content is automatically associated with the selected content.
|
Procedure
I. Basic information
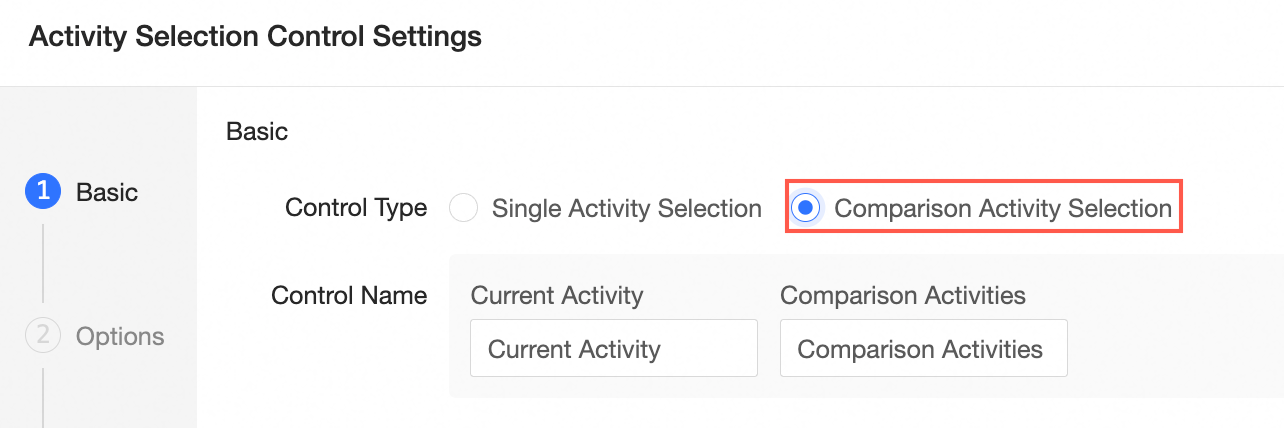
In the Basic Information section, set the Control Type parameter. If you select Select Single Activity, set the Display Name parameter. In this example, select Select Compare Activity. In this example, set the Display Name parameter.
2. Configure options
After you configure the basic information of the widget, set Option Value Source, Activity Options, Activity Phase, Activity Default Value, Activity Filter, and Compare Activity Cascade in the Options section.
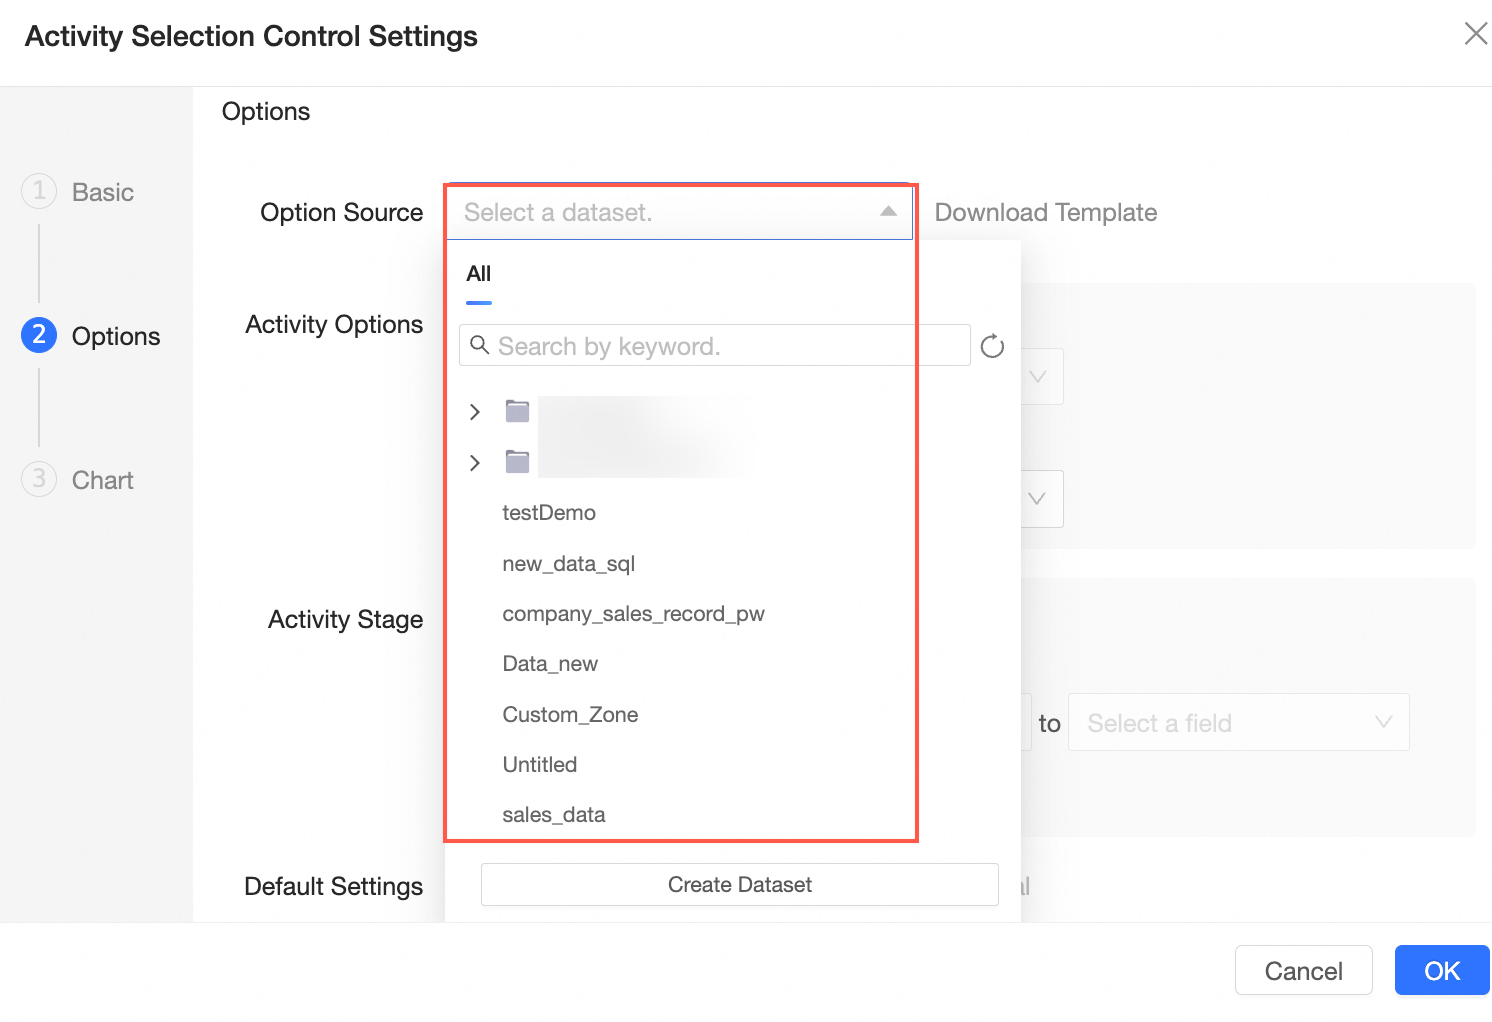
You can click Download Template on the right side to Upload Local File. You can also select an existing dataset from the drop-down list.
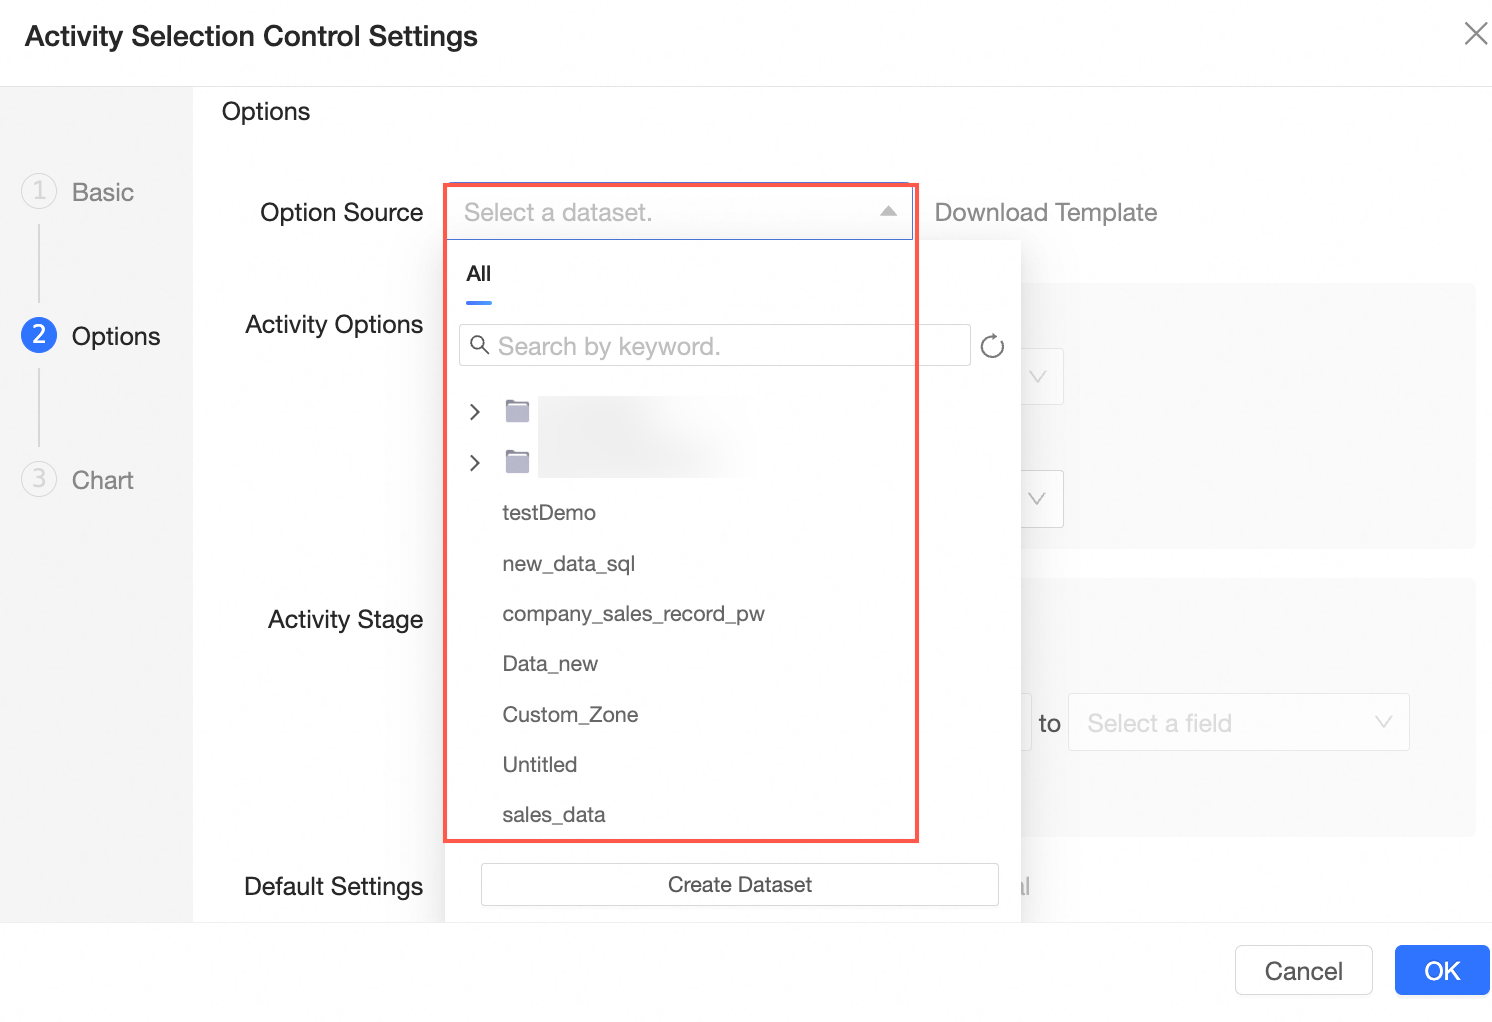
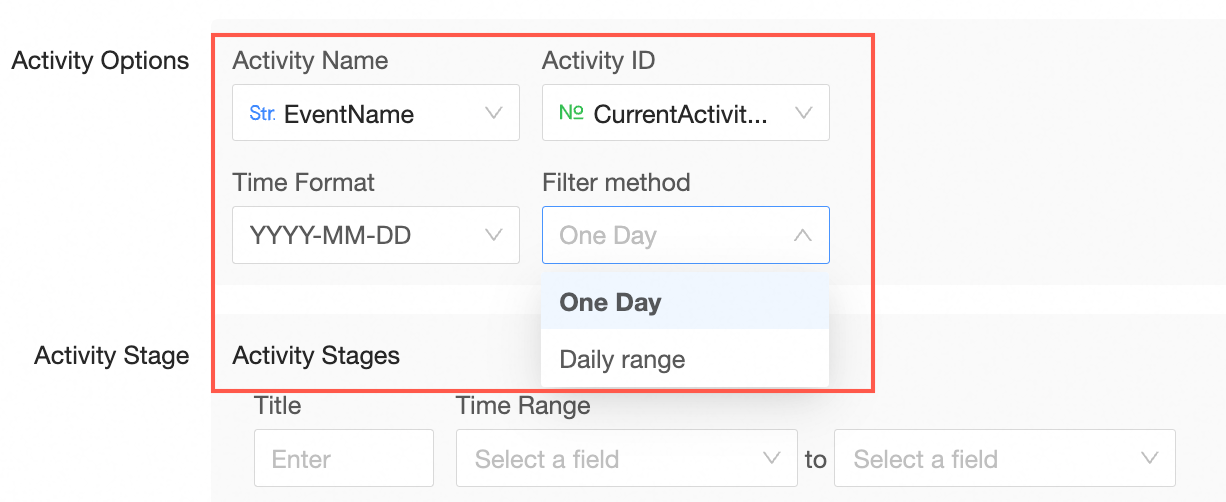
After you select an option value source, you must configure the Activity Options parameter. Set Activity Name to the Activity Name field and Activity ID to the Current Activity ID field. The Time Granularity parameter is set to Year, Month, and Day by default. You can set the Filter Method parameter to Single Day or Day Range.
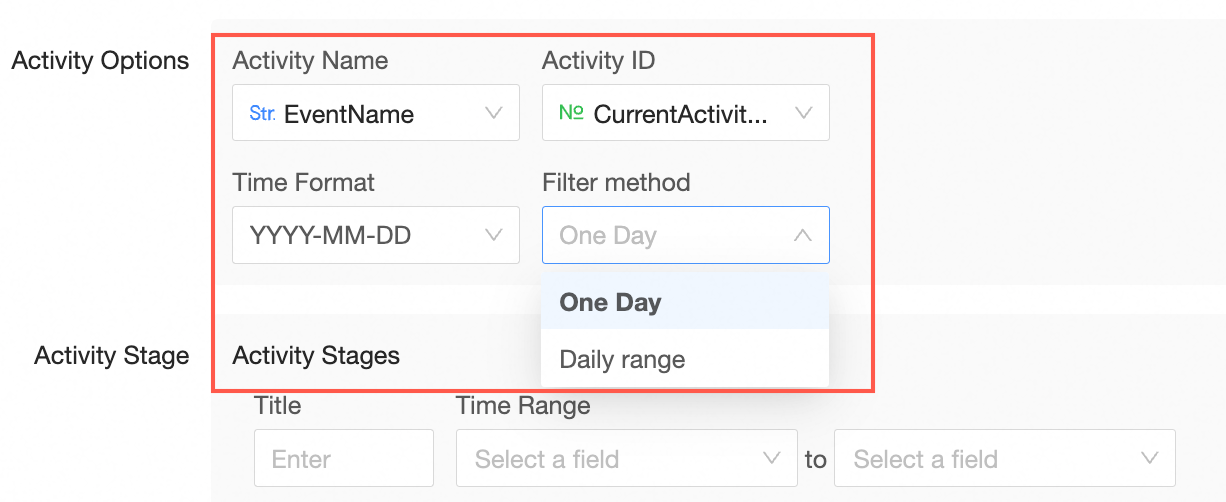
If you set the Filter Method parameter to Single Day, you can filter the time of a single day.

If you set the Filter Method parameter to Day Range, you can set the Filter Method parameter to Day Range.

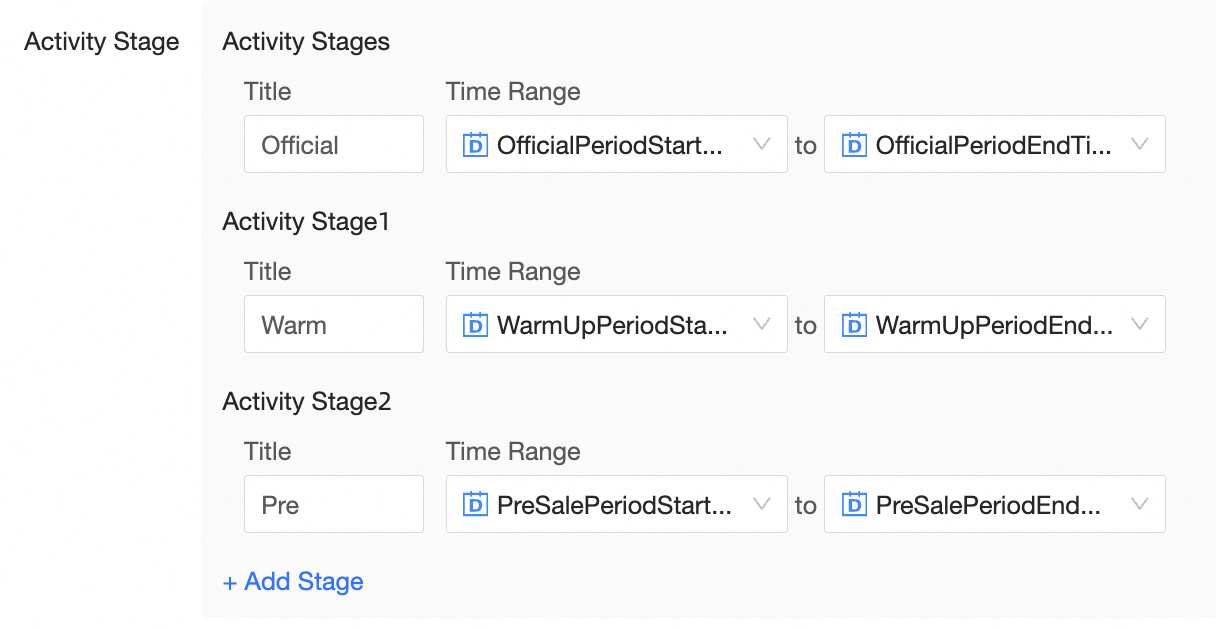
In addition to the activity content configuration, you also need to set the activity phase. You can enter the calendar display text as Formal, and select Formal Period Start Time and Formal Period End Time for the Time Range field. You can also add more segments, such as the warm-up period and pre-sale period.
You can set Default Values for the configured activities, including None, Default Recent Activities, and Manual Settings. If you select Default Recent Activity, set the Activity Priority parameter to Activity Level.
NoteIf multiple activities with the same priority exist, the activity IDs are used in ascending order. If multiple activities with the same priority 9 exist at the same time, the activity with the activity ID 1 is selected first, but the activities with the activity IDs 5 and 7 are not.
Default Latest Activity

Manual Settings
If the filter mode of the activity option is set to Single Day in the option configuration, you can configure the default date for the current activity and the comparison activity.
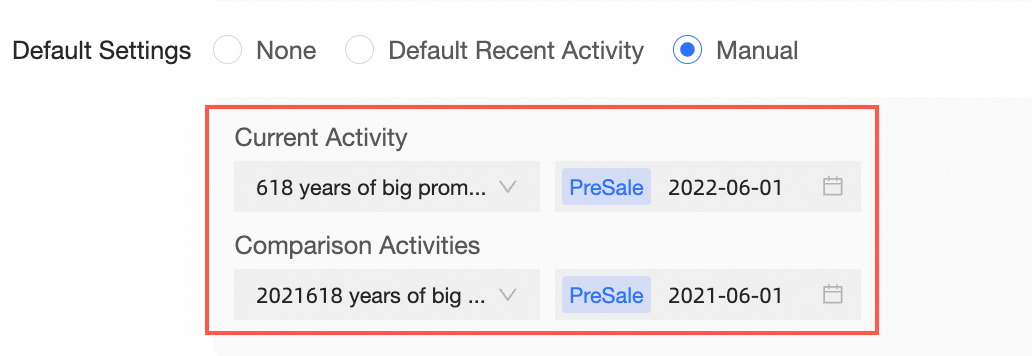
If you set the Filter By parameter to Day Range, you can specify the default date range for the current activity and the comparison activity.

By default, the activity filter feature is disabled. To filter activities, click Enable, enter Activity Level in the Filter Content field, select Activity Level, and set Control Type to Single Choice. If you want to create multiple filters, you can add filters.

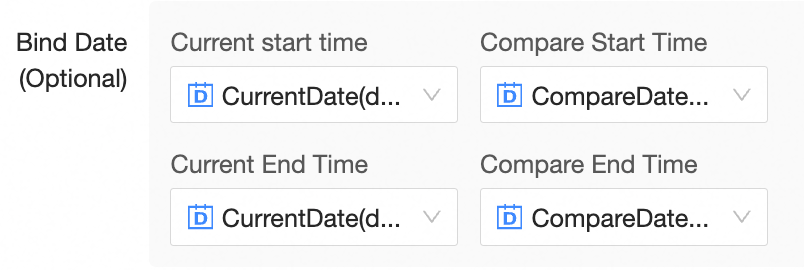
Compare Activity Cascade is supported only when the Control Type parameter is set to Compare Activity Selection. By default, this feature is disabled. If you want to use a configuration items to bind two comparison activities and the corresponding comparison date, you can enable this feature. The following table lists the options.
Activity Cascade

Date cascade (optional)
If you set the Filter By parameter to Single Day, you can configure the Current Date and Compare Date parameters.

If you set the Filter Method to Day Range, you must configure the Current Start Time and Comparison Start Time cascades and the Current End Time and Comparison End Time cascades.
3. Associated charts
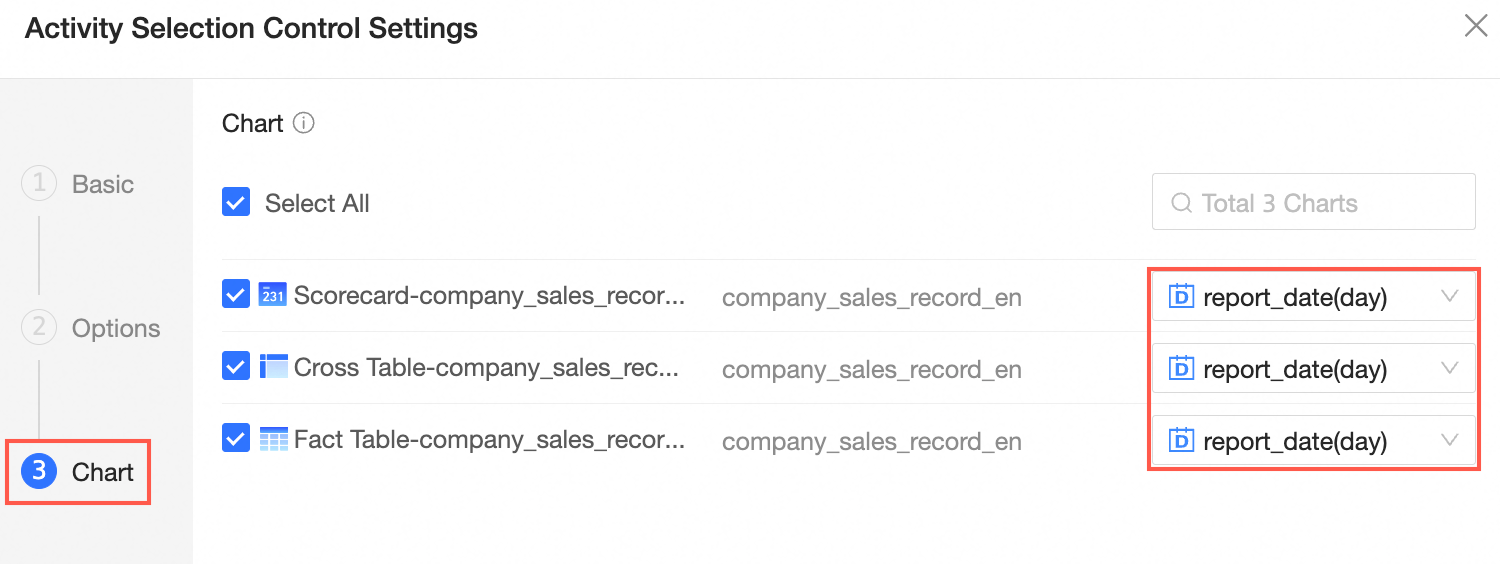
After you configure the basic information and options, you can associate charts in the Associated Charts section. You can select a chart for which you want the activity control to take effect. You can select the Date (day) field for the activity phase.
You can associate five types of charts: kanban, Indicator Card Trend, Ranking, Cross Table, and Details.
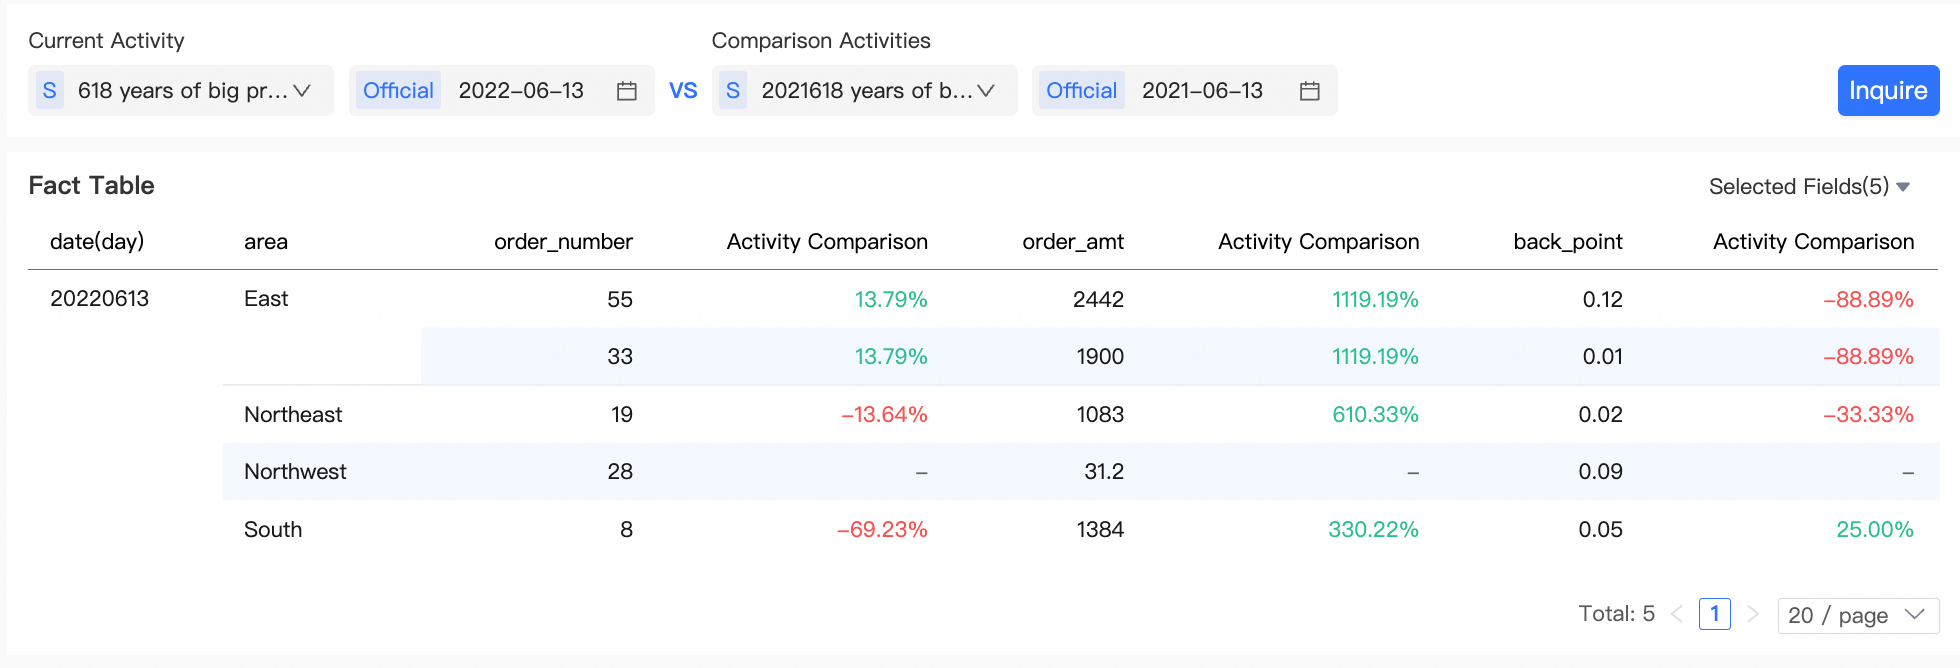
The following figure shows the results of association in cross tables and detail tables. In this example, single-day filtering is performed.
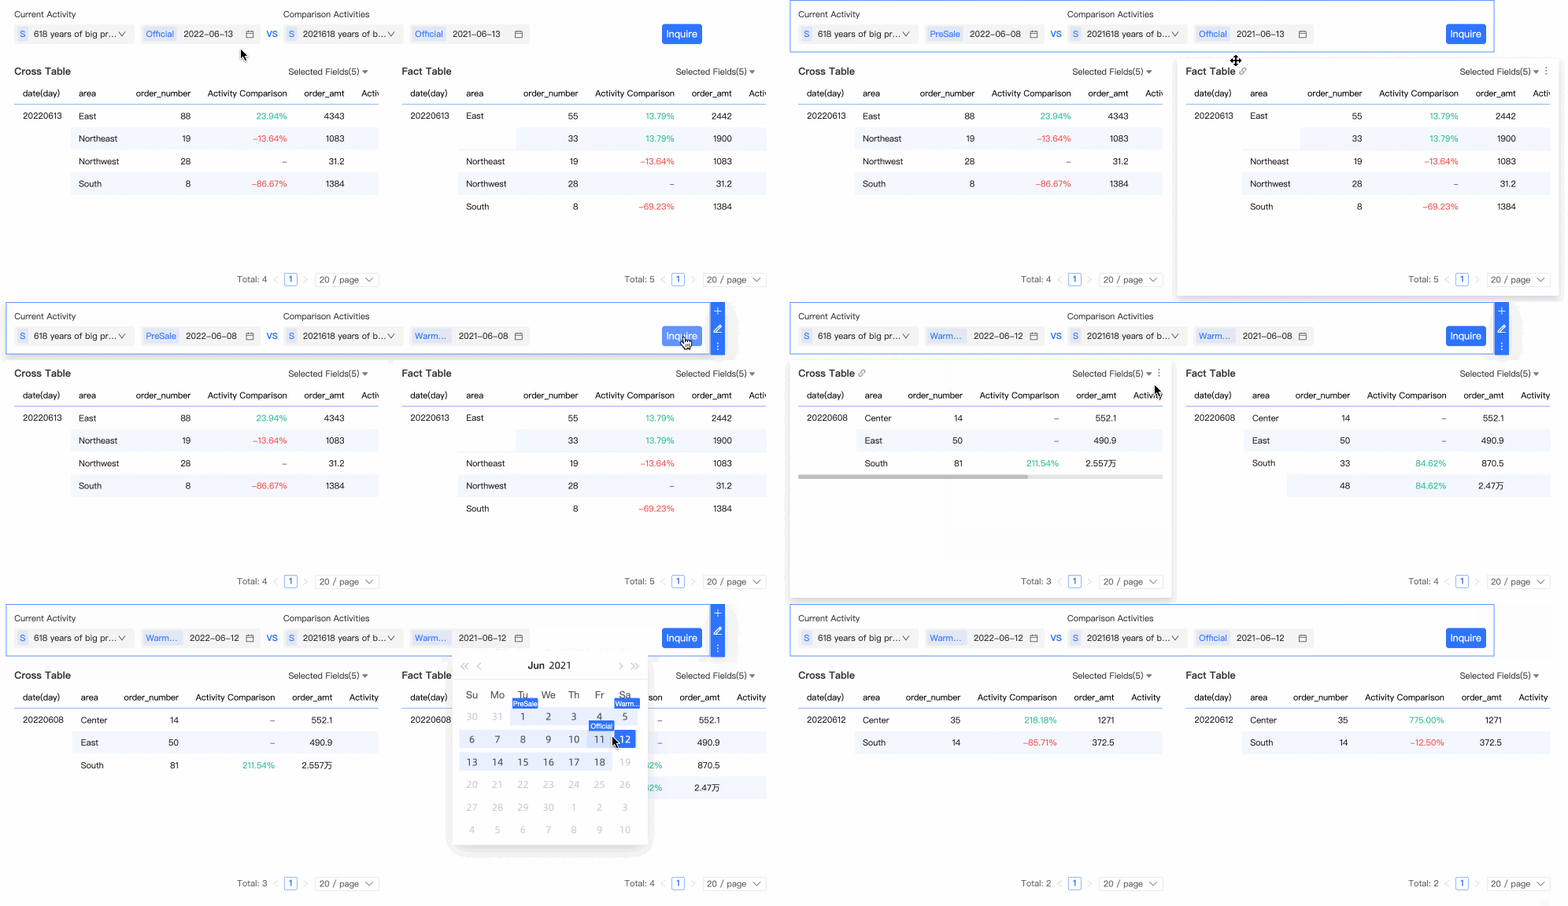
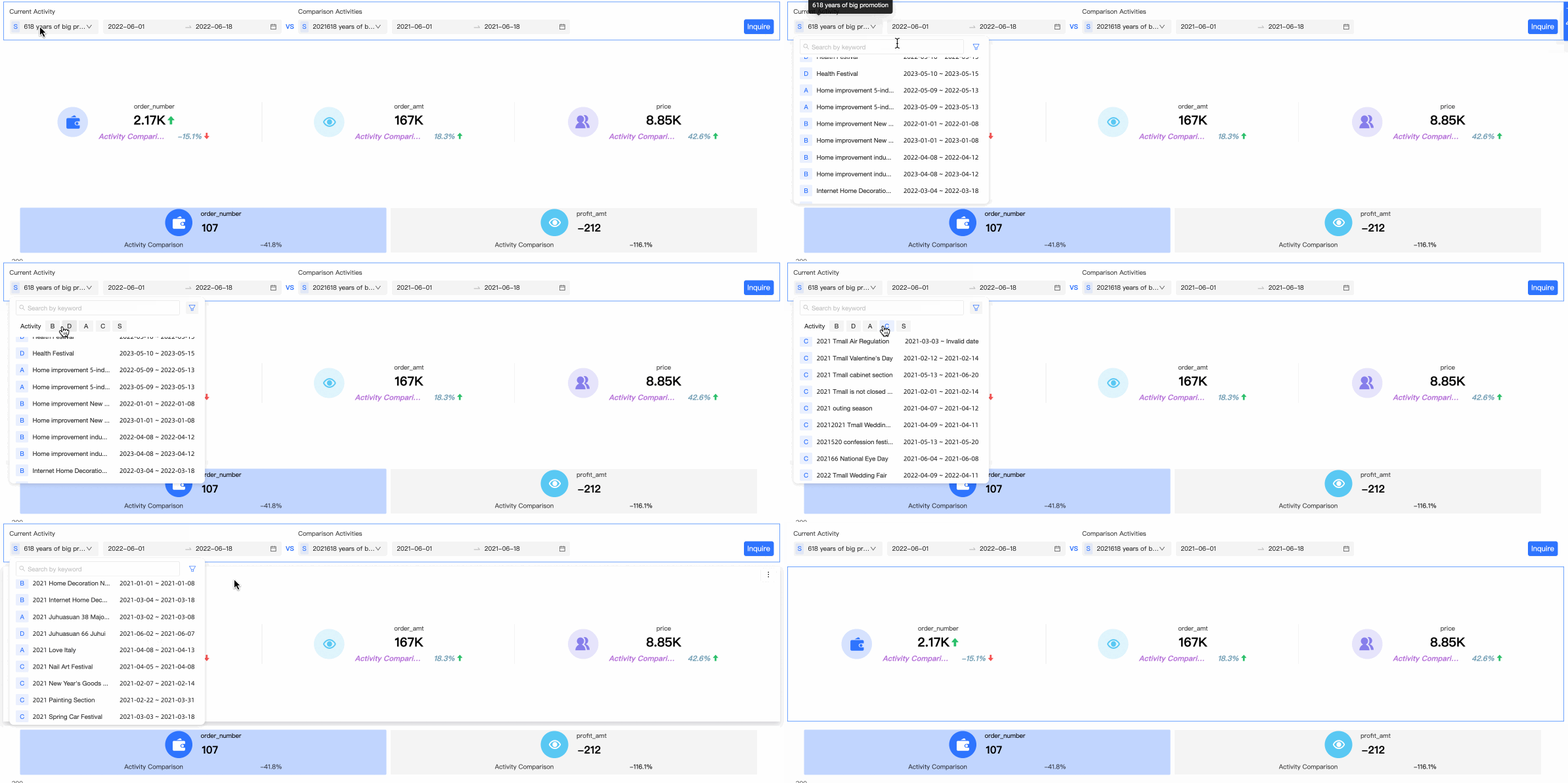
The following figure shows the correlation between the kanban and the leaderboard. In this example, the day range is used.

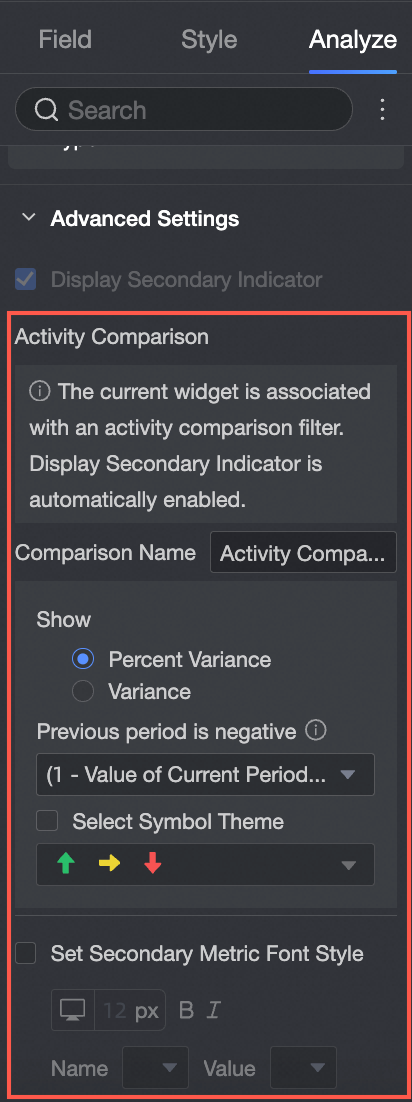
On the Analysis tab of the chart, click the Advanced tab. In the Advanced Settings section, configure the comparison settings for the activity.
Parameter/Option | |
Compare Name | Custom comparison names are supported. |
Display Content |
|
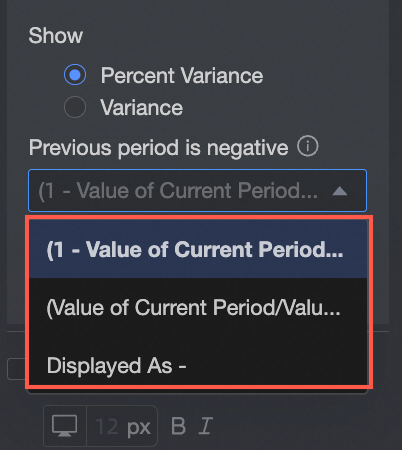
If the data of the previous period is negative | If Percentage Difference is displayed, you can select a formula to calculate the difference percentage when the previous period data is negative. The formula that you select takes effect only when the data of the previous period is less than 0. |
regular time comparison | You can select Comparison Date and select a single comparison metric to set the comparison content. You can synchronize comparison metrics.
Note This configuration items is supported for kanban, metric card trend charts, cross tables, and detail tables. |
Display Position | You can set Metric Right, Independent Right, and Metric Bottom for cross tables and detailed tables. |
Display Style | Cross tables and details tables can be set to red for positive numbers and green for negative numbers or green for positive numbers and red for negative numbers.
|
Select a mark | kanban and indicator card trend charts support selection of up and down markers.
|
Set the secondary indicator font style | You can set the secondary indicator font style for the kanban and card trend charts.
|
Secondary Indicator Position | You can set the Secondary Indicator Position parameter for the metric trend chart.
|
Use control effects
The comparison control is configured as described in the preceding steps and is associated with five charts. You can select the current activity content and comparison activity content to be compared, and view the data such as order amount and price activity comparison in the corresponding area in the associated chart.
