Exploratory Analysis is a lightweight, instant data exploration tool in Quick BI for business users. It goes beyond fixed dashboard views, enabling self-service analysis so anyone in your organization can uncover insights and make data-driven decisions.
Limitations
Only the Professional edition supports the Exploratory Analysis feature.
Target users
Includes Viewer, analyst, and developer roles.
Prerequisites
-
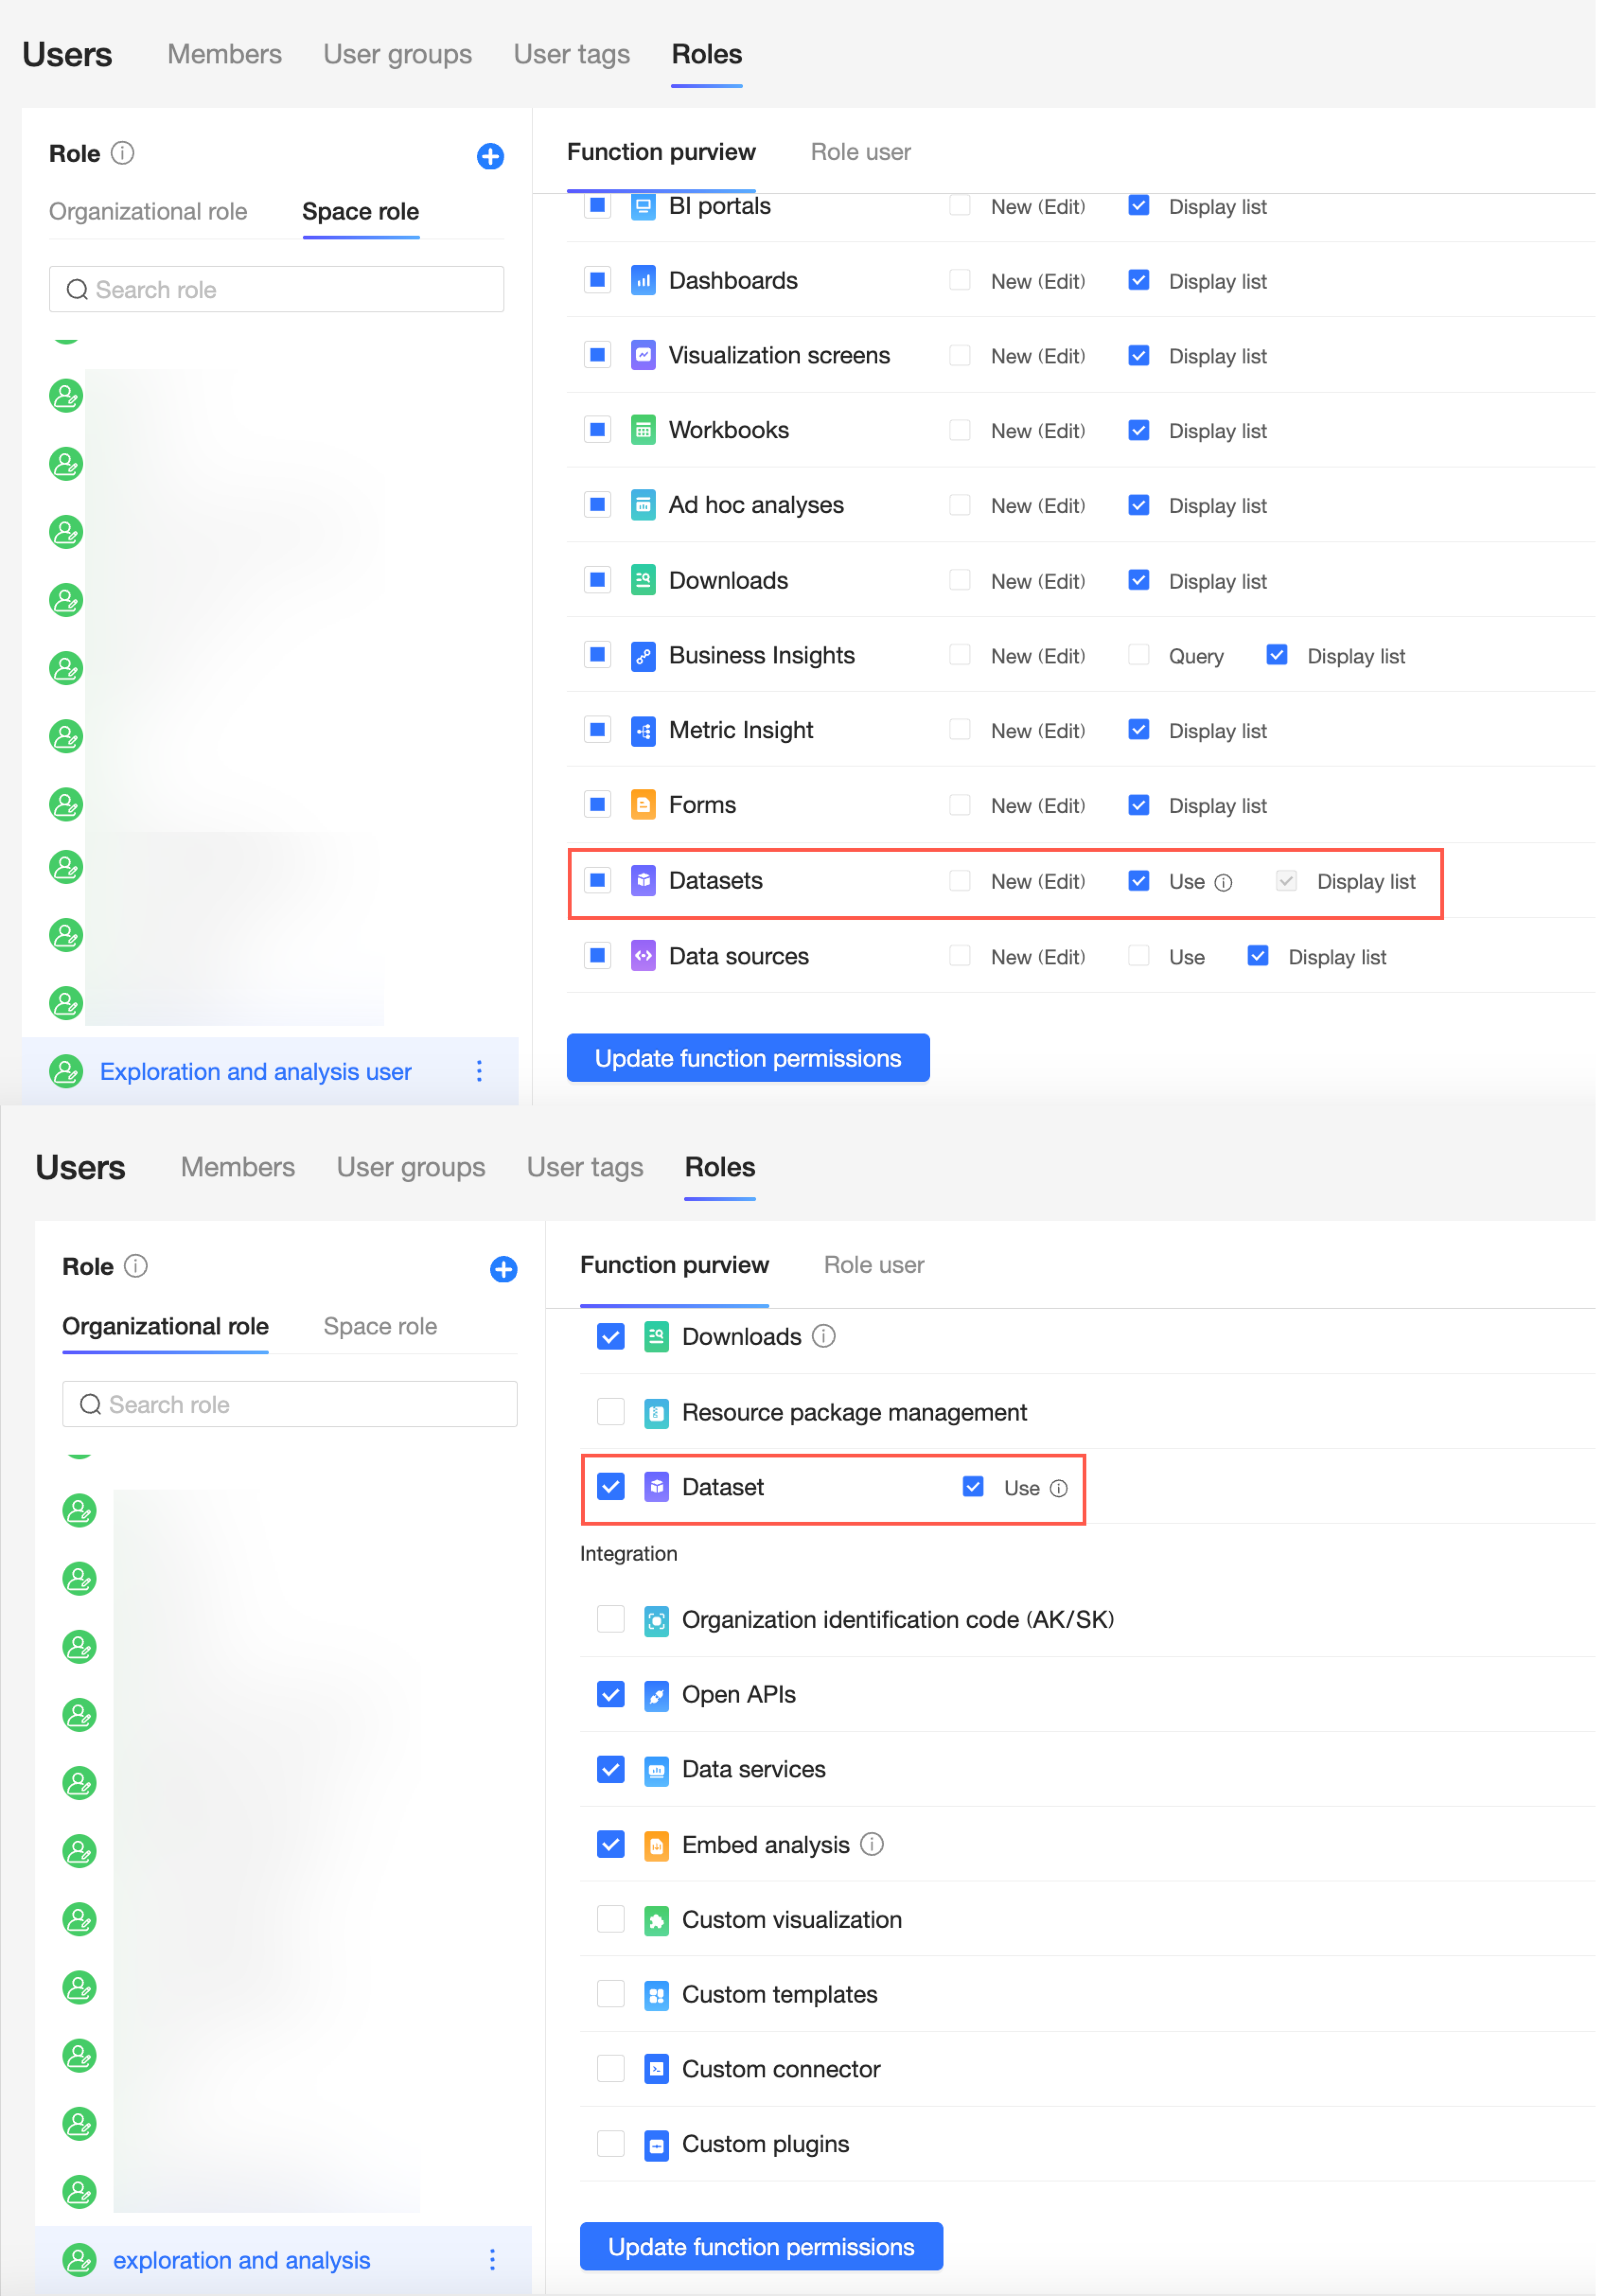
Your role in the associated workspace or organization must have permission to use datasets.
-
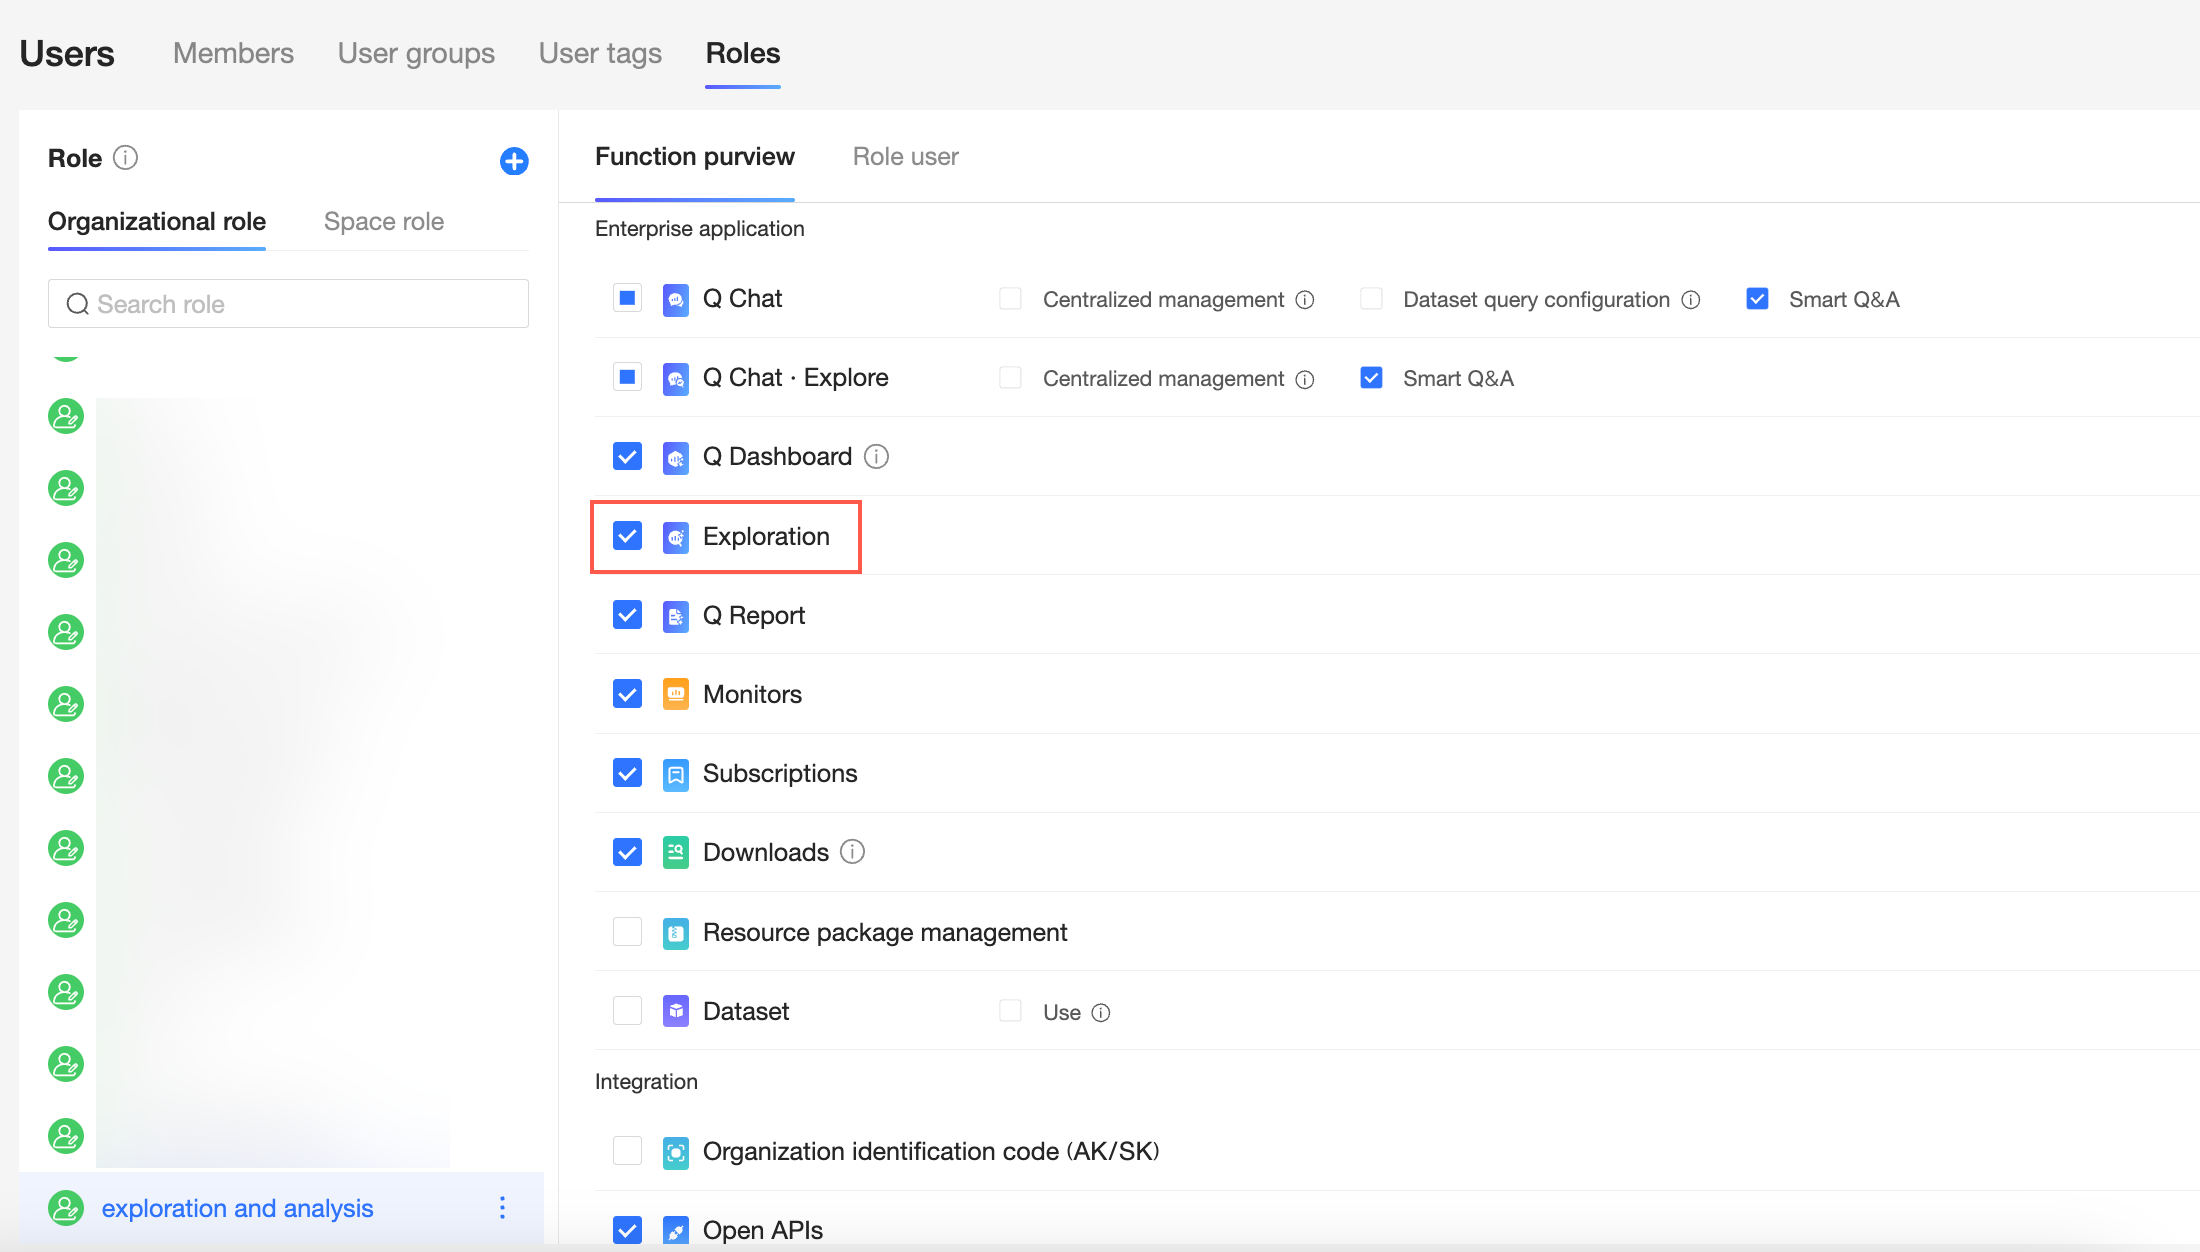
You have permission to use Exploratory Analysis.
Key benefits
Business users can explore data and uncover insights independently, without a technical background.
-
Flexible multidimensional exploration: Go beyond static reports. Drag and drop to combine any dimension and measure, adapting to changing analytical needs.
-
Intelligent chart recommendations: Automatically recommends the best chart type for your data, such as a table, bar chart, line chart, pie chart, funnel chart, or combo chart. You can also switch chart types manually.
-
Powerful quick calculation: Use built-in aggregation methods such as sum, average, and distinct count instead of writing complex formulas. Run quick calculations such as period-over-period comparisons, percentages, or cumulative calculations to generate key business metrics with a single click.
-
In-depth analysis capabilities: Compare data across activity cycles or user segments with group comparison. Custom drill-down lets you explore data from high-level summaries down to granular details.
-
Convenient sharing and collaboration: Export findings or share them to DingTalk, WeCom, and Lark with a single click to streamline team collaboration.