For report analysis scenarios that use custom latitude and longitude regions, you can upload a GeoJSON file to set the region. This topic describes how to use a JSON file to customize geographic information and display partition effects in a map.
Limits
Only Enterprise Standard Version supports the use of custom GeoJSON.
Only organization administrators can configure custom geographic partitions.
After configuration, developers and analysts can use the custom geographic location for data analysis and display.
Single-layer geographic information
Create a custom partition
Log on to the Quick BI console.
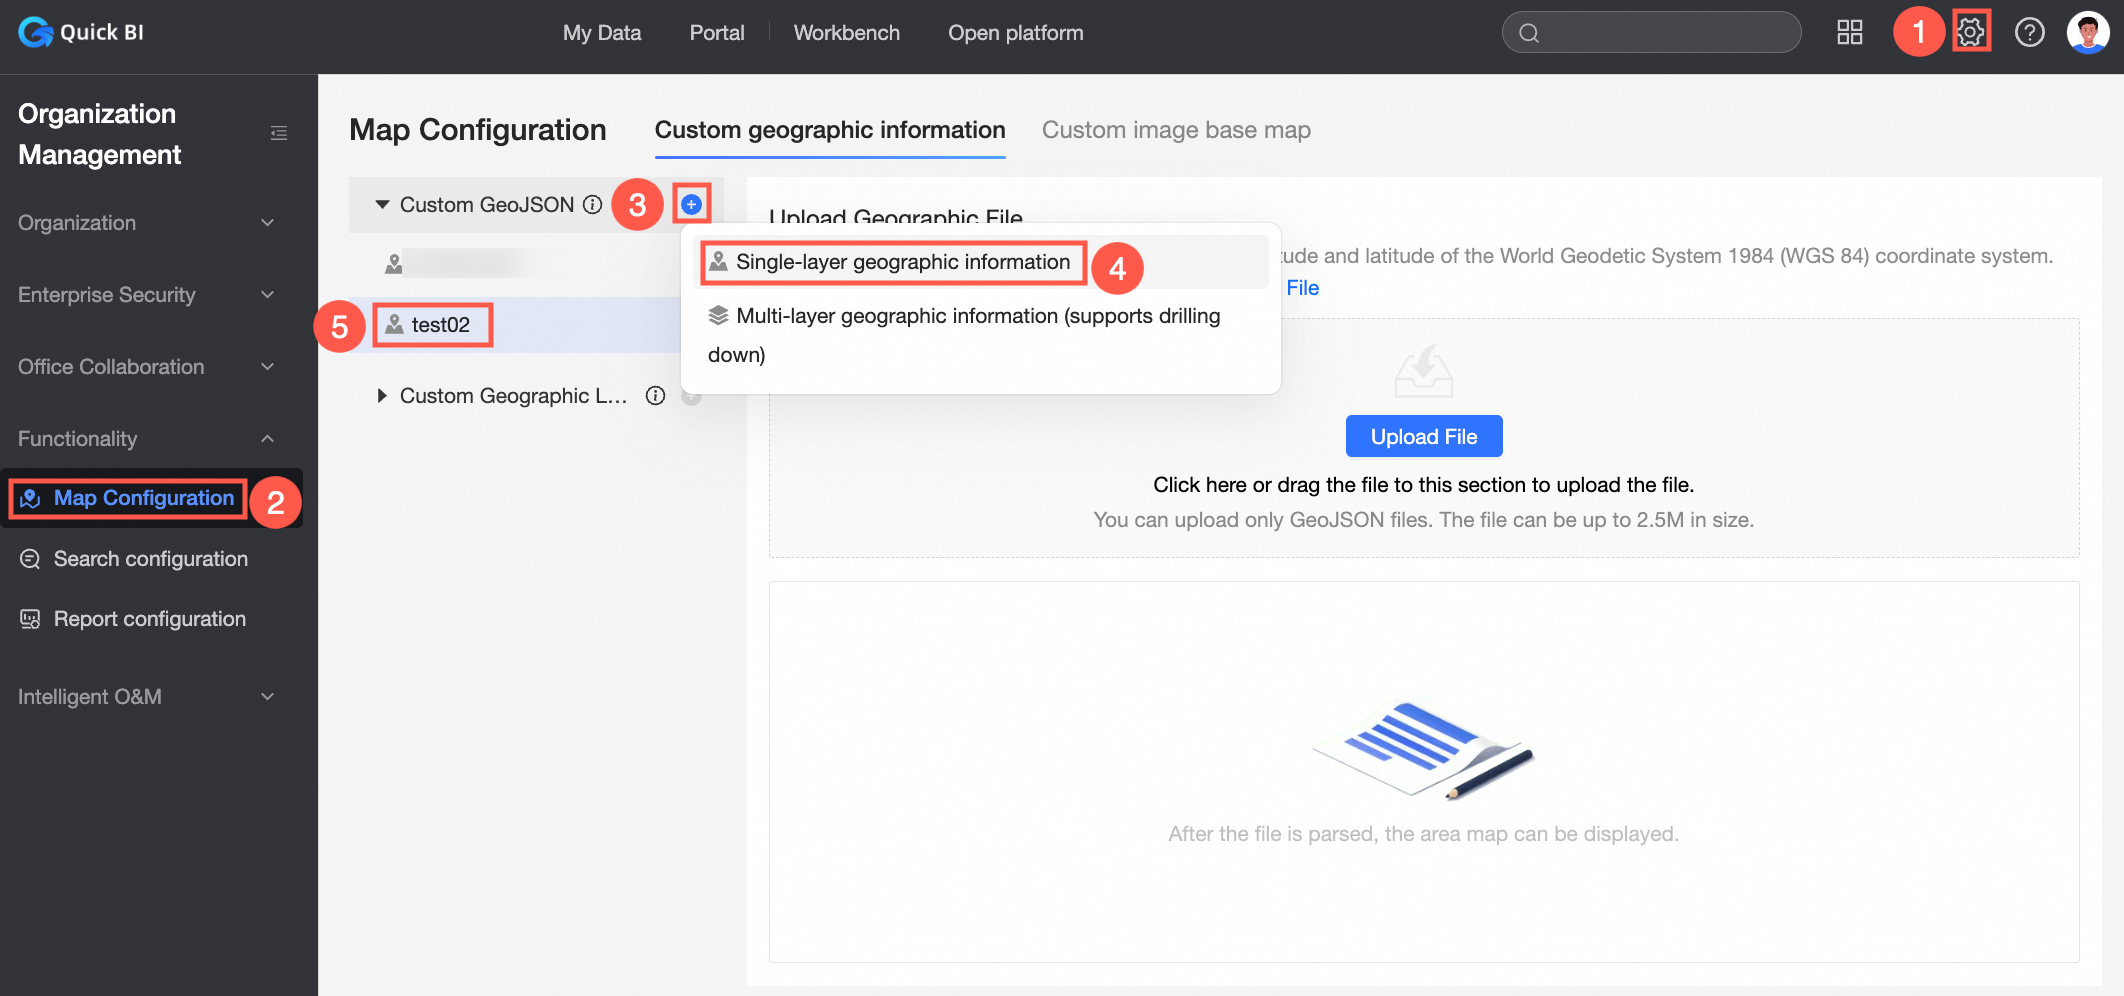
The organization administrator follows the instructions shown in the following figure to Create (③), select Single-level Geographic Information (④), and specify Custom Name (⑤).
Select the target custom partition and follow the steps shown in the following figure to upload the geographic information.
You can click or drag to upload a GeoJSON file. For more information about the format, see the sample file.
If you select File Upload, you need to sign a letter of commitment and agree to start the upload.
After the file is uploaded and parsed, you can confirm it in the display area.
 Note
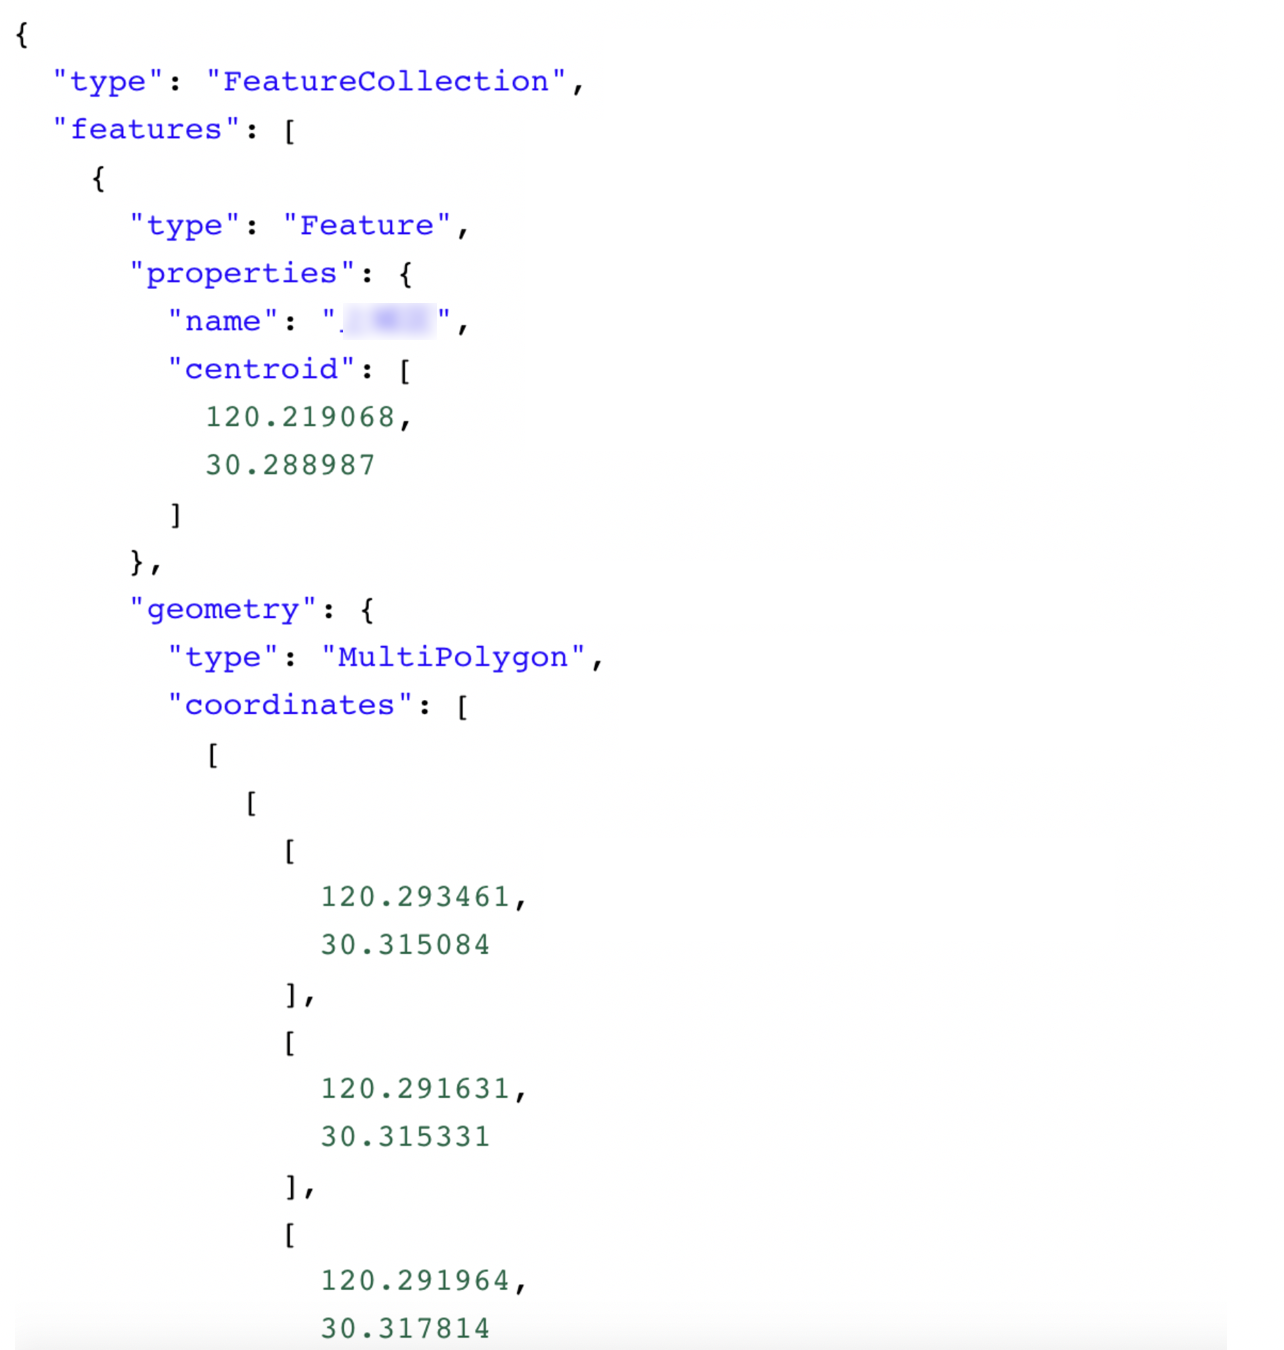
NoteThe following figure shows the GeoJSON file format.
The following table describes the other operations that you can perform on the Map Configuration page.
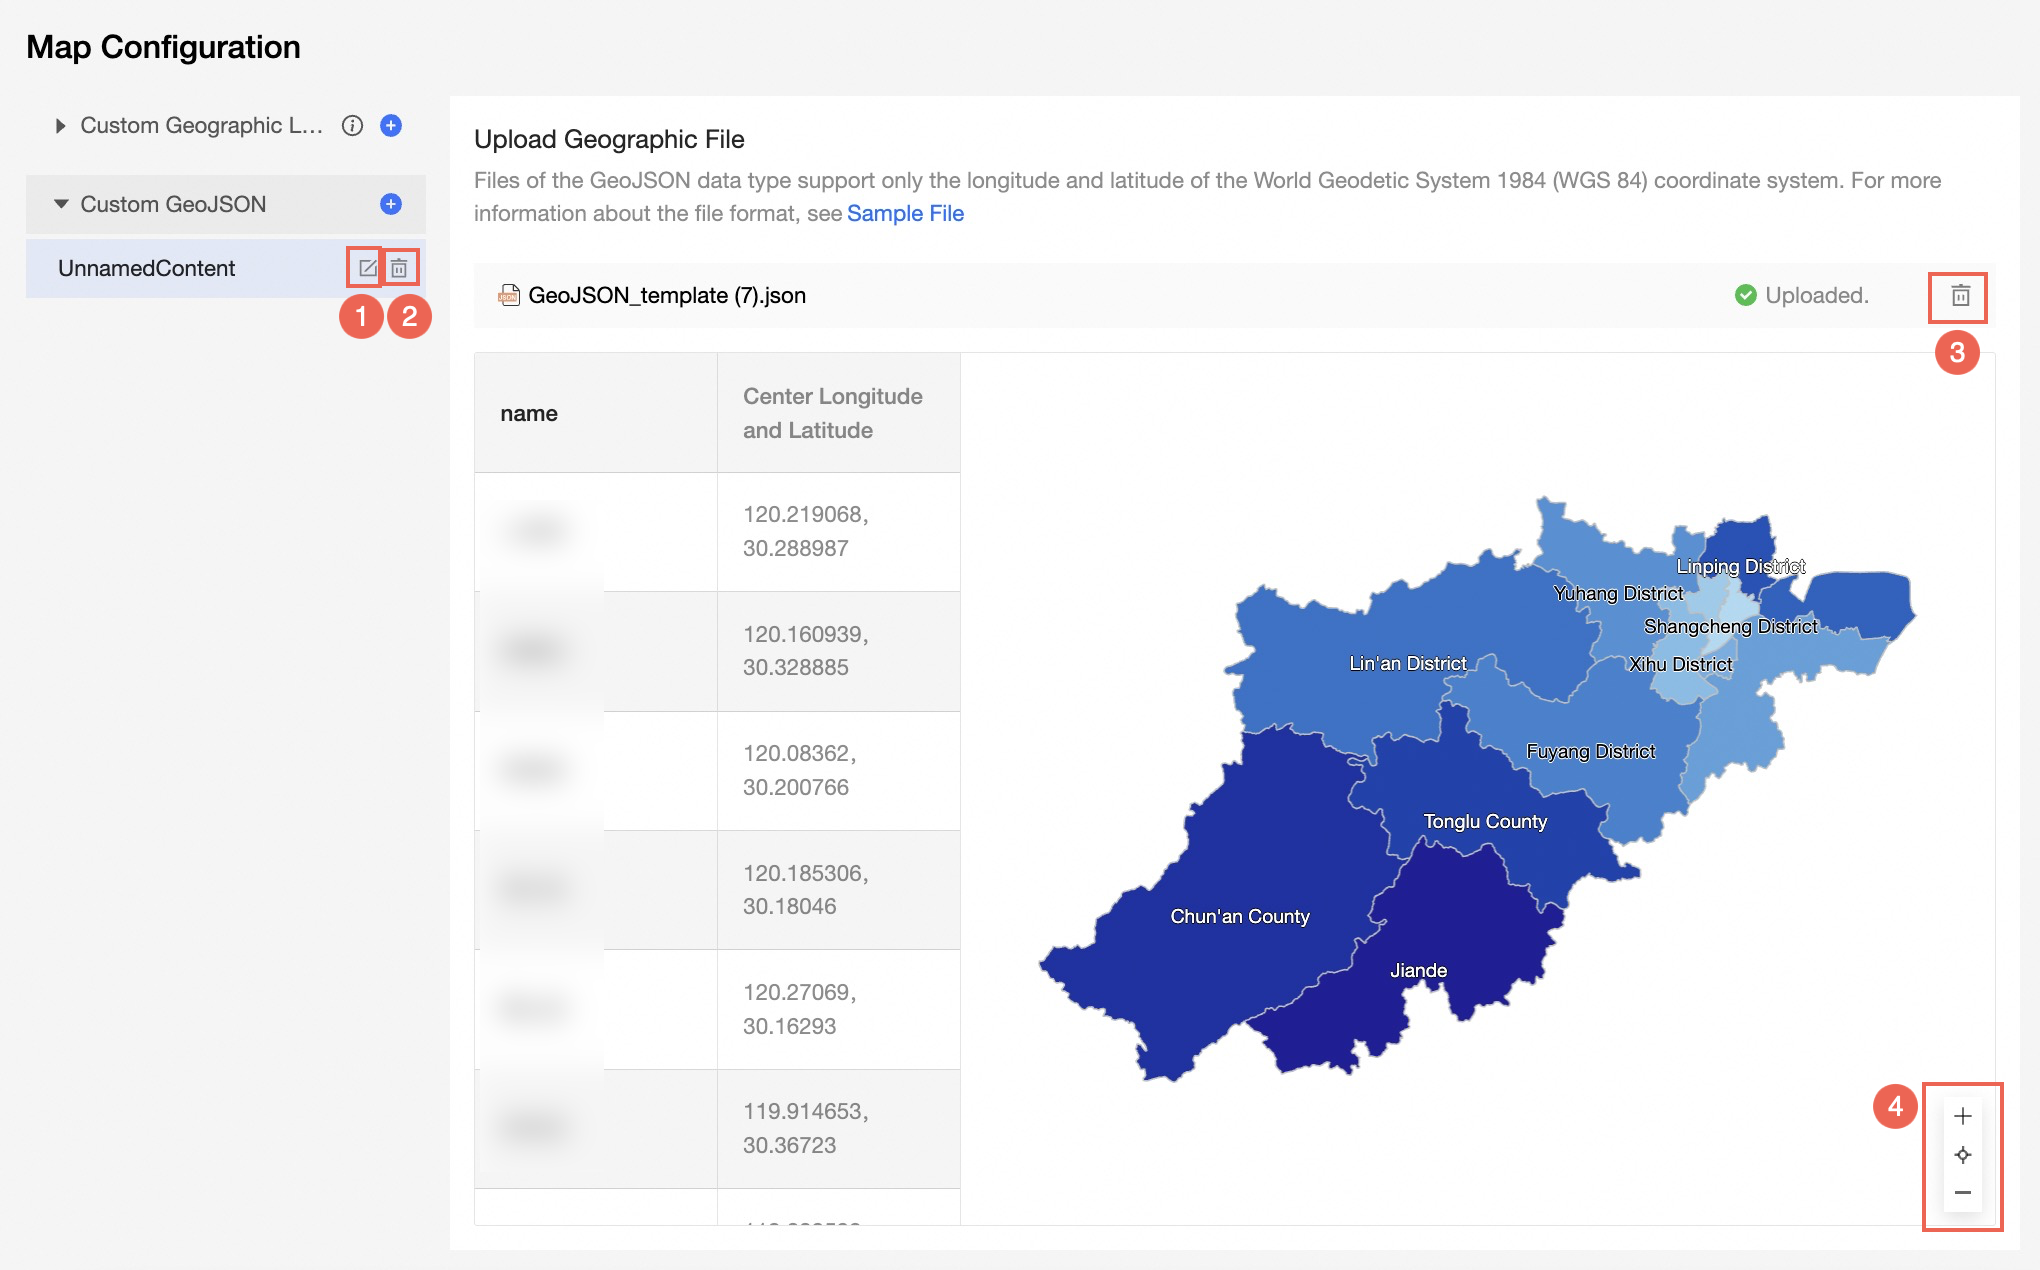
①: Rename a geographic partition.
②: Delete a geographic partition.
③: Delete the geographic information file.
④: Examples of enlarged or reduced geographies.
Convert geographic dimension fields in a dataset
Procedure
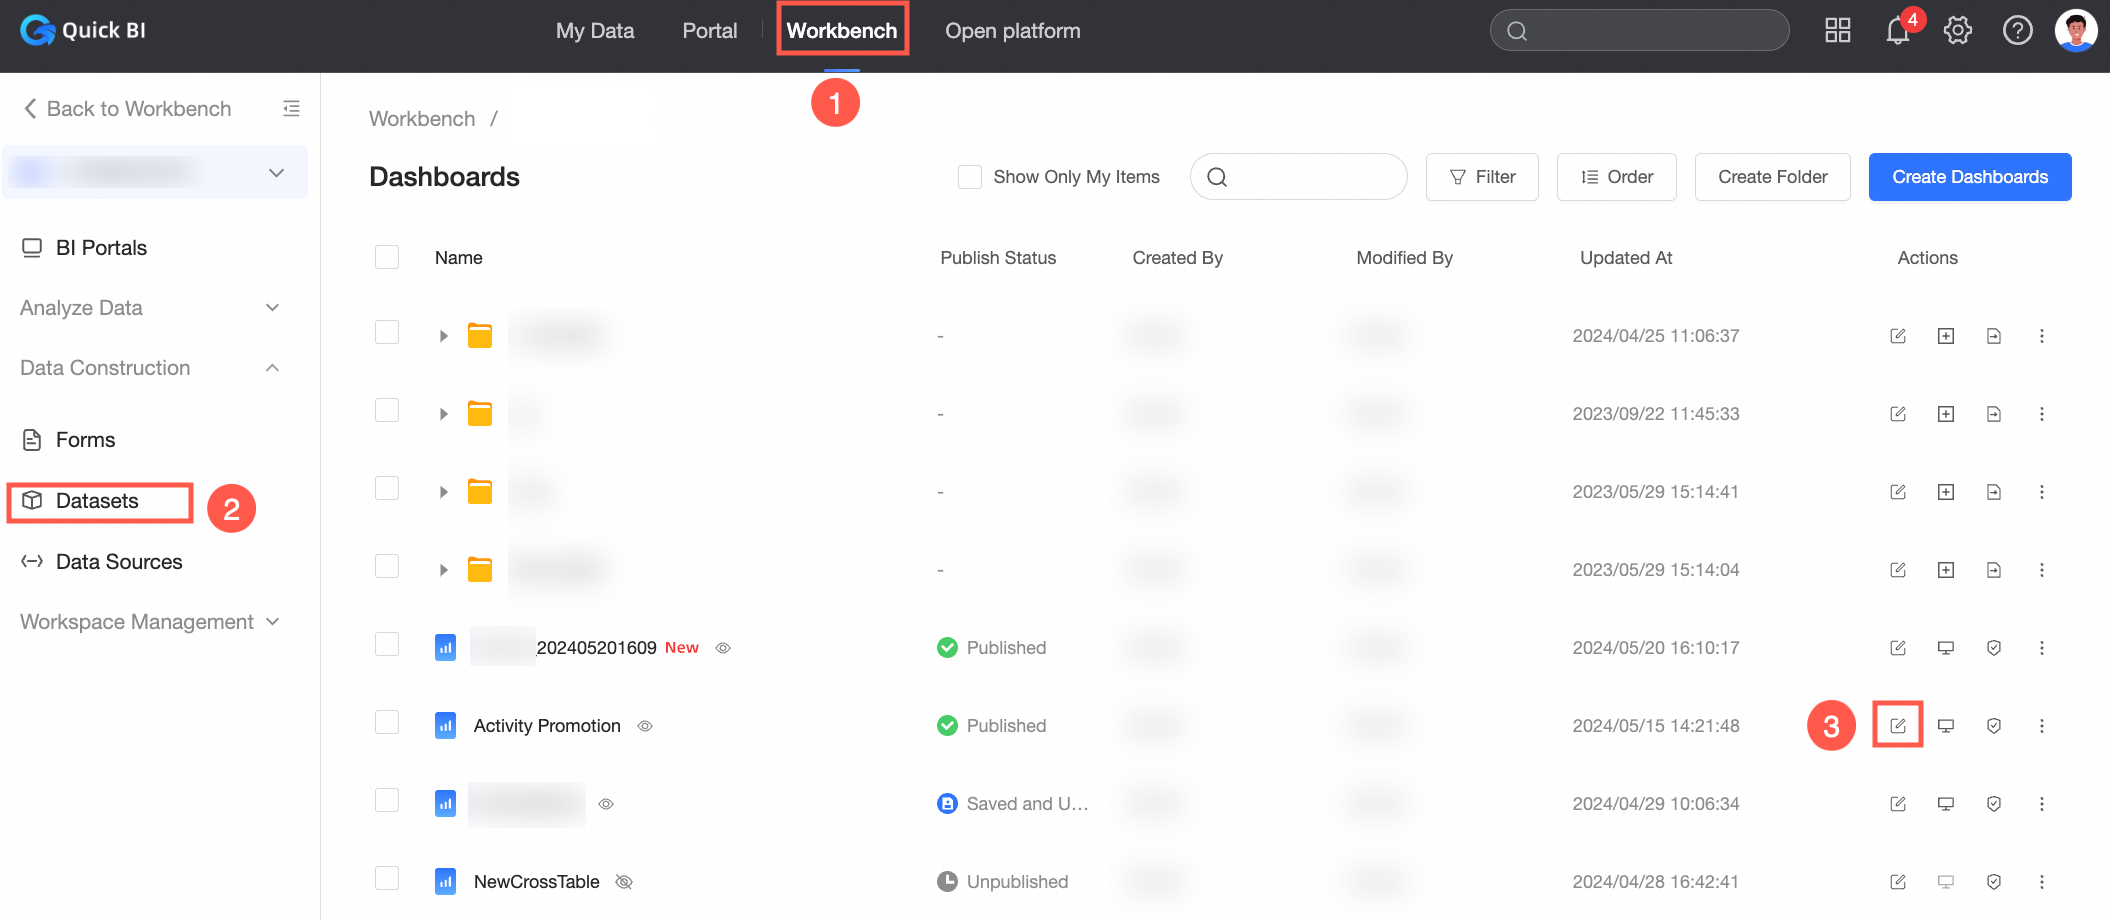
On the Quick BI homepage, follow the instructions in the following figure to go to the dataset editing page.

Change the value of the Region field to Custom GeoJSON. In the dialog box that appears, select Sales Data Distribution by Region.
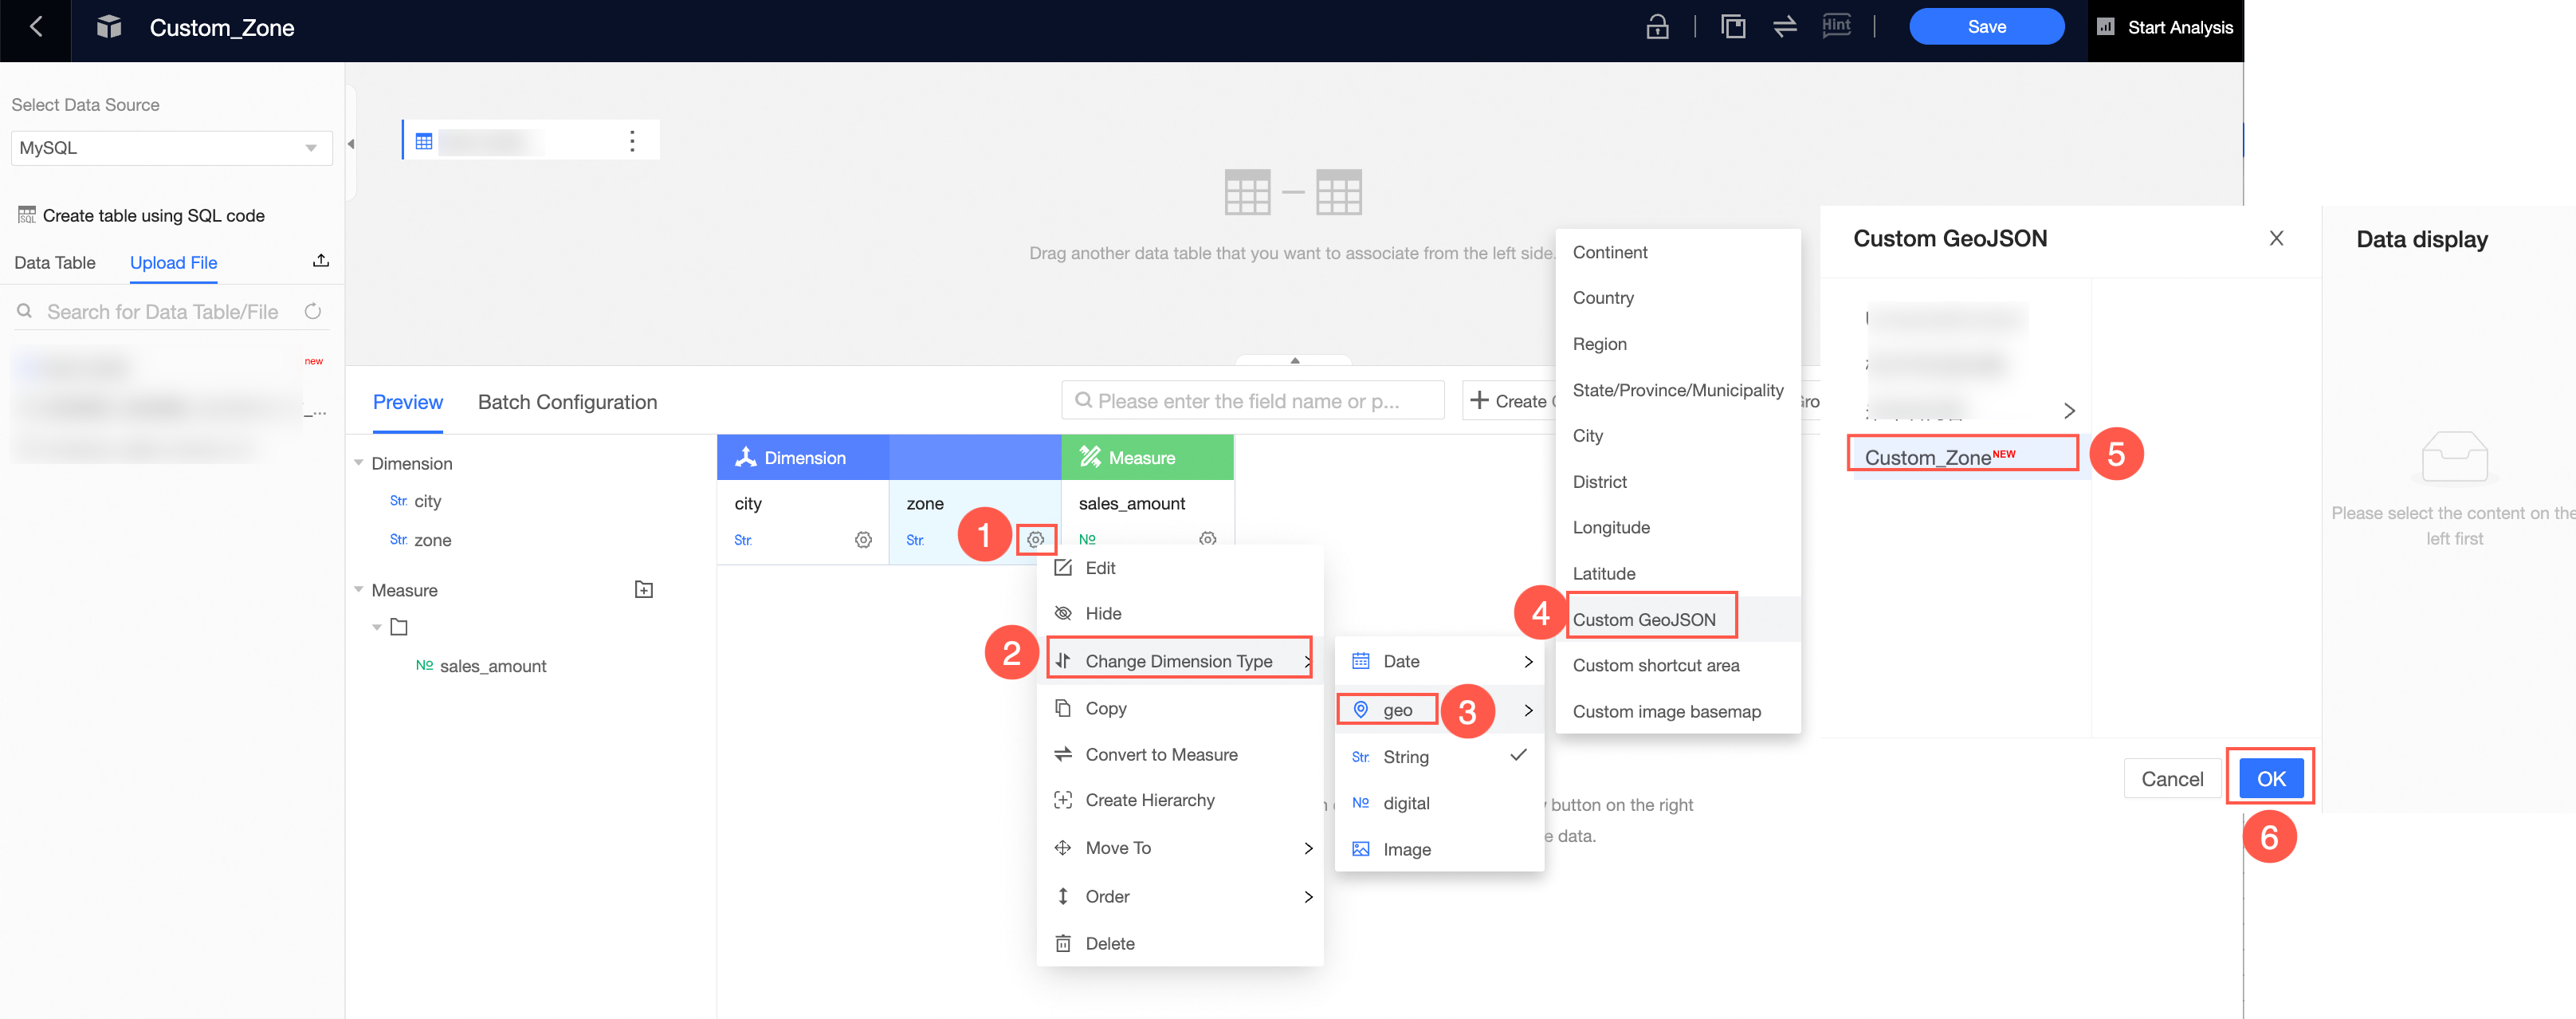
After you edit the dataset, click Save in the upper-right corner of the page to save the dataset.
Display the effect of a custom partition in a map
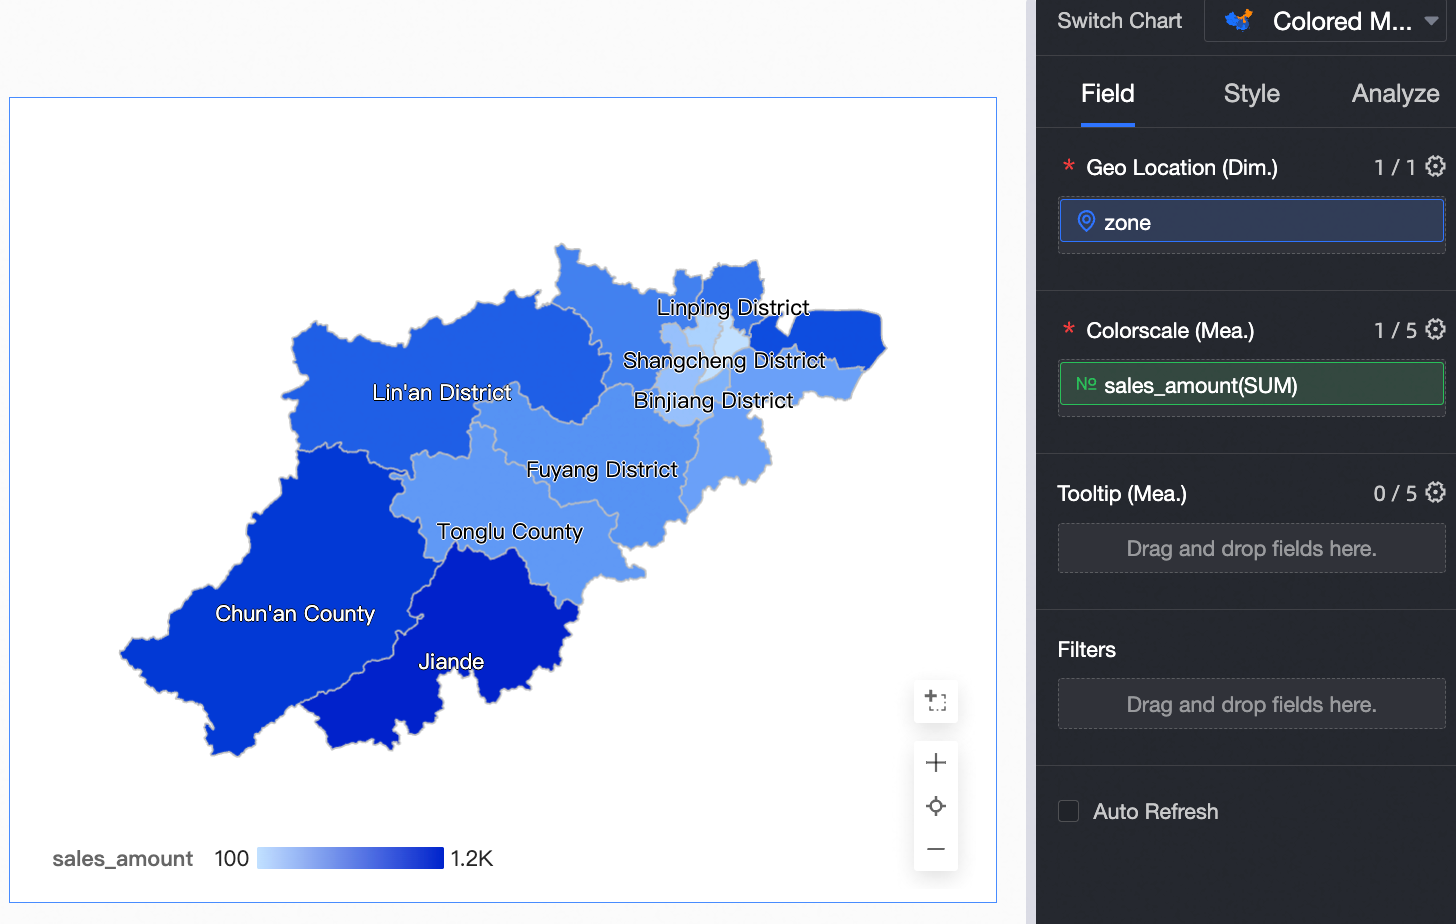
The following uses colored map as an example.
Procedure
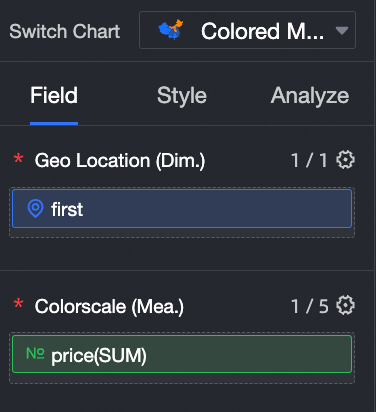
On the Dataset Edit page, click Start Analysis in the upper-right corner and select Create Dashboard.

On the dashboard editing page, create a colored map, drag the custom area to geographic area /dimension, and then drag the sales amount to colorscale /measure. You can view the data under the custom geographic information.
Multi-layer geographic information
Configure a custom geographic location
Log on to the Quick BI console.
The organization administrator follows the instructions shown in the following figure to Create (③), select Multi-level Geographic Information (④), and specify Custom Name (⑤).

Select the target custom partition and follow the procedure to upload the geographic information.
You can click or drag to upload a CSV file. For more information about the format, see Sample files.
If you select File Upload, you need to sign a letter of commitment and agree to start the upload.
After the file is uploaded and parsed, you can confirm it in the display area.
 Note
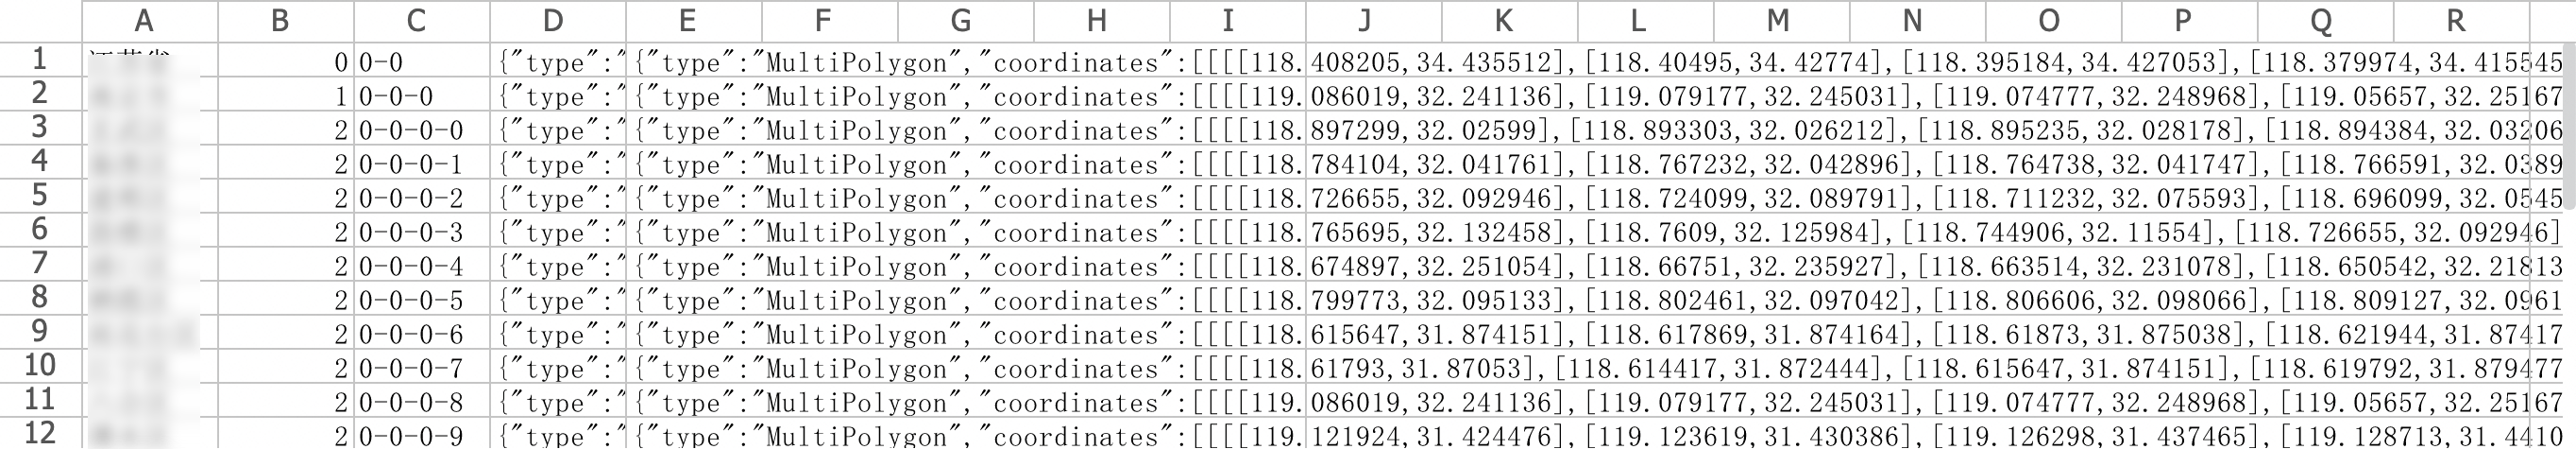
NoteCSV file format:
Block name: Jiangsu Province.
Level: the first level, starting with 0.
Hierarchy index: 0-0 indicates the first block in the first layer, and so on. 0-0 indicates the first block in Nanjing, Jiangsu Province.
Block center point :{"type":"Point","coordinates":[119.486506,32.983991]}
(It is in the single point format defined by the WKT standard. coordinates are the longitude and latitude of the center point of the current block.)
Block fence :{"type":"MultiPolygon","coordinates":[[[118.408205,34.435512]...[118.40495,34.42774],[118.395184,34.427053],[118.379974,34.415545],[118.353203,34.417435],[118.352248,34.422845],[118.320931,34.421342]]]}(The coordinates are the longitude and latitude of the fence of the current block in the Polygone or MultiPolygon format defined by the WKT standard.
When you configure multiple levels of geographic information, you can click the area that you want to drill down in the display area to view the information of the areas at multiple levels.
The following table describes the other operations that you can perform on the Map Configuration page.
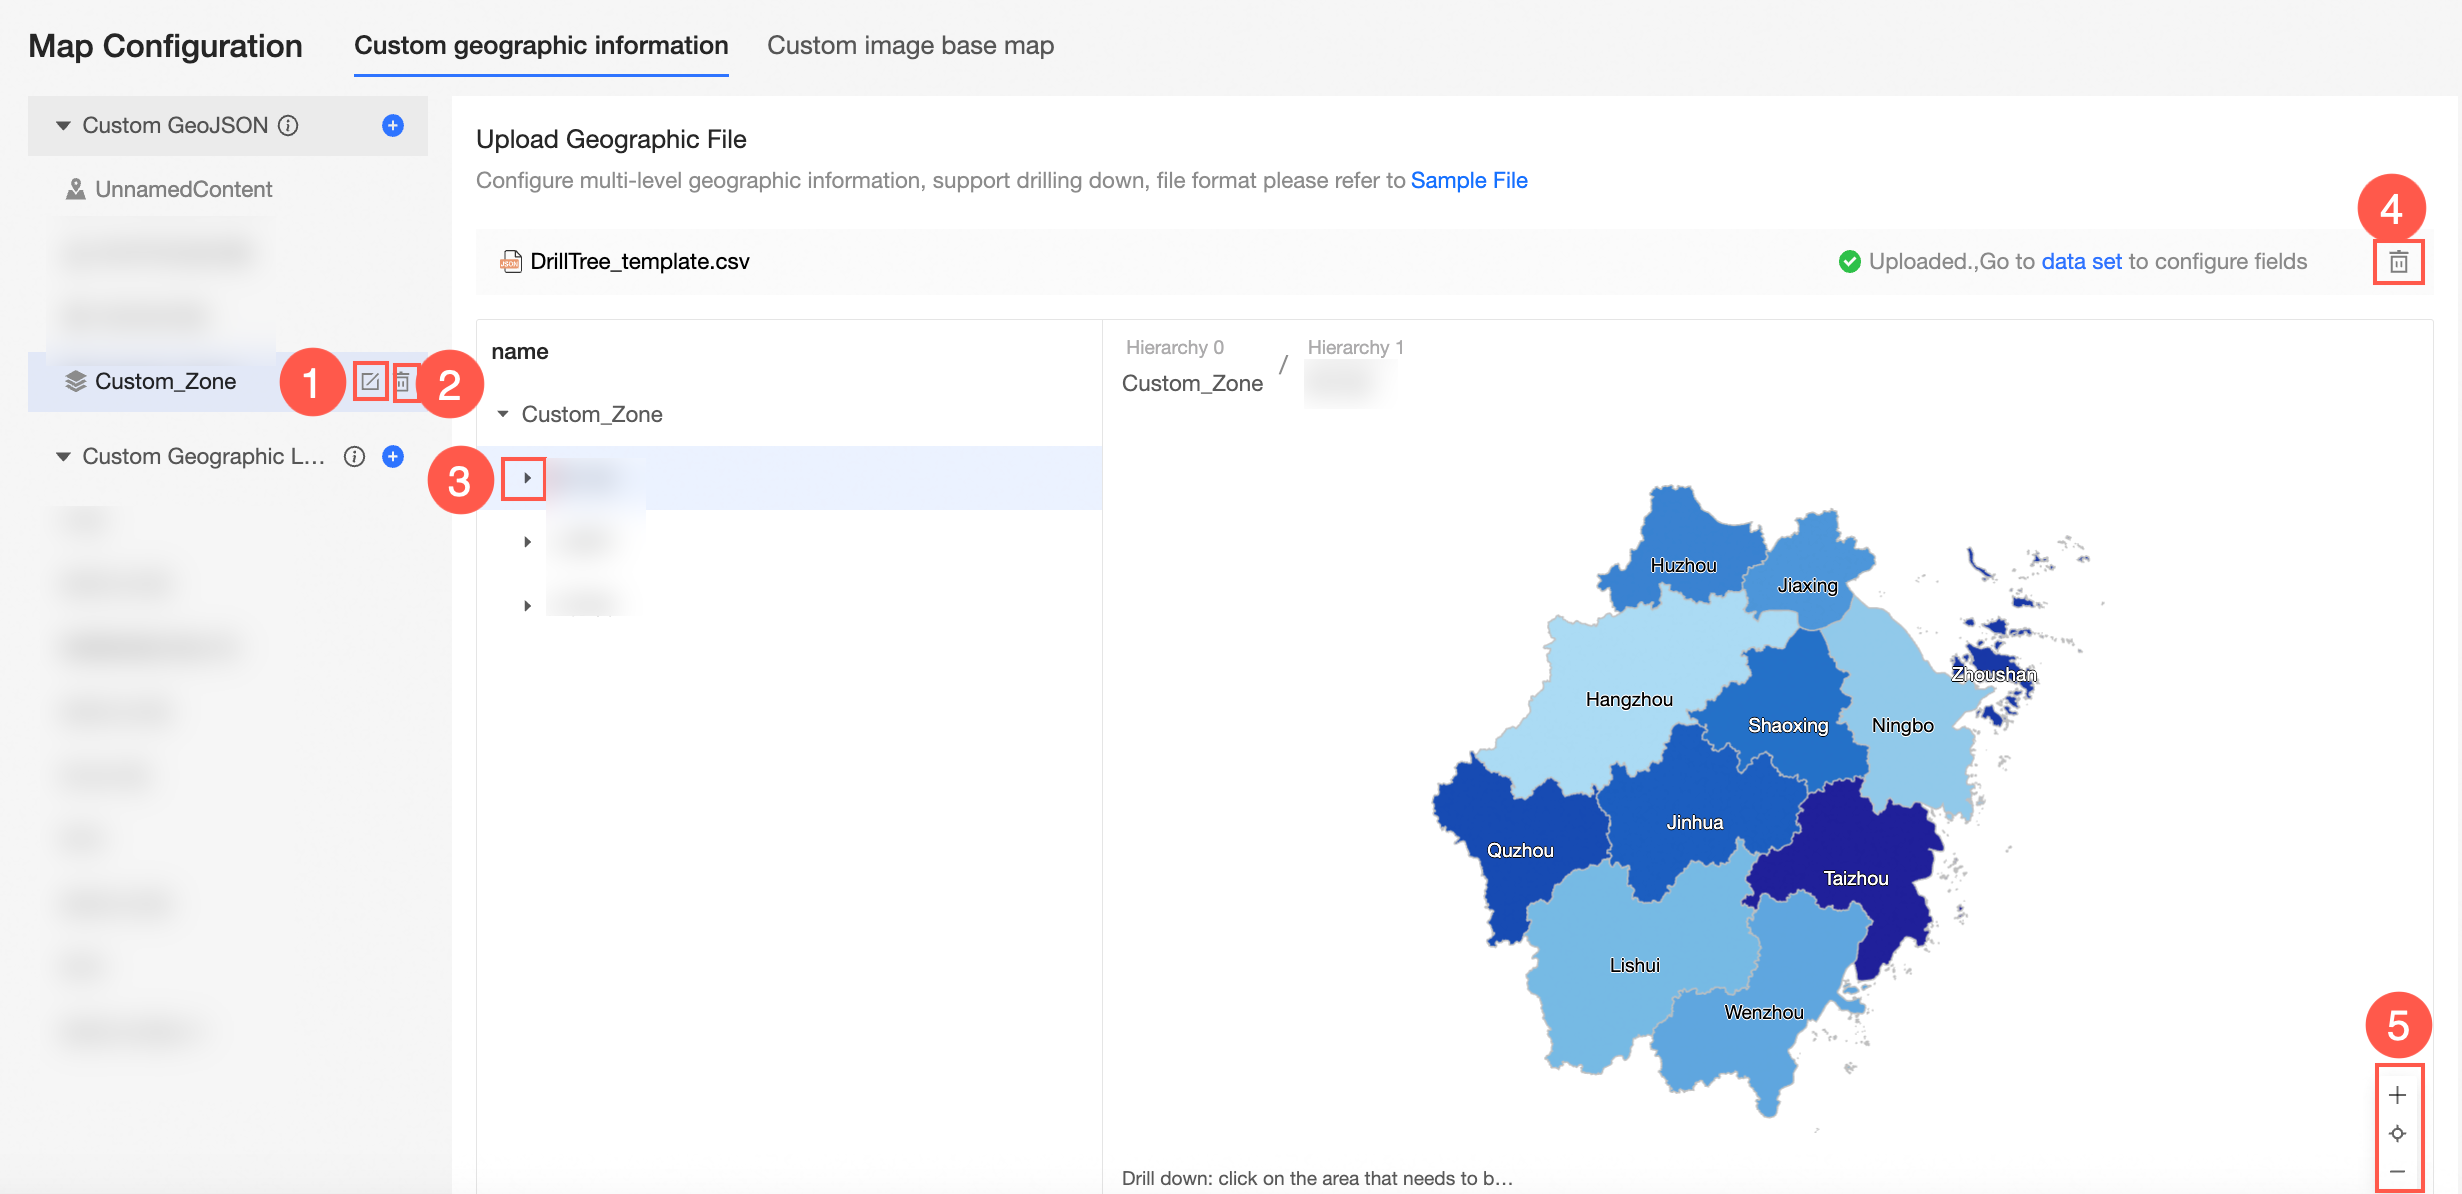
①: Rename a geographic partition.
②: Delete a geographic partition.
③: Expand the node to view the area information of the next layer.
③: Delete the geographic information file.
④: Examples of enlarged or reduced geographies.
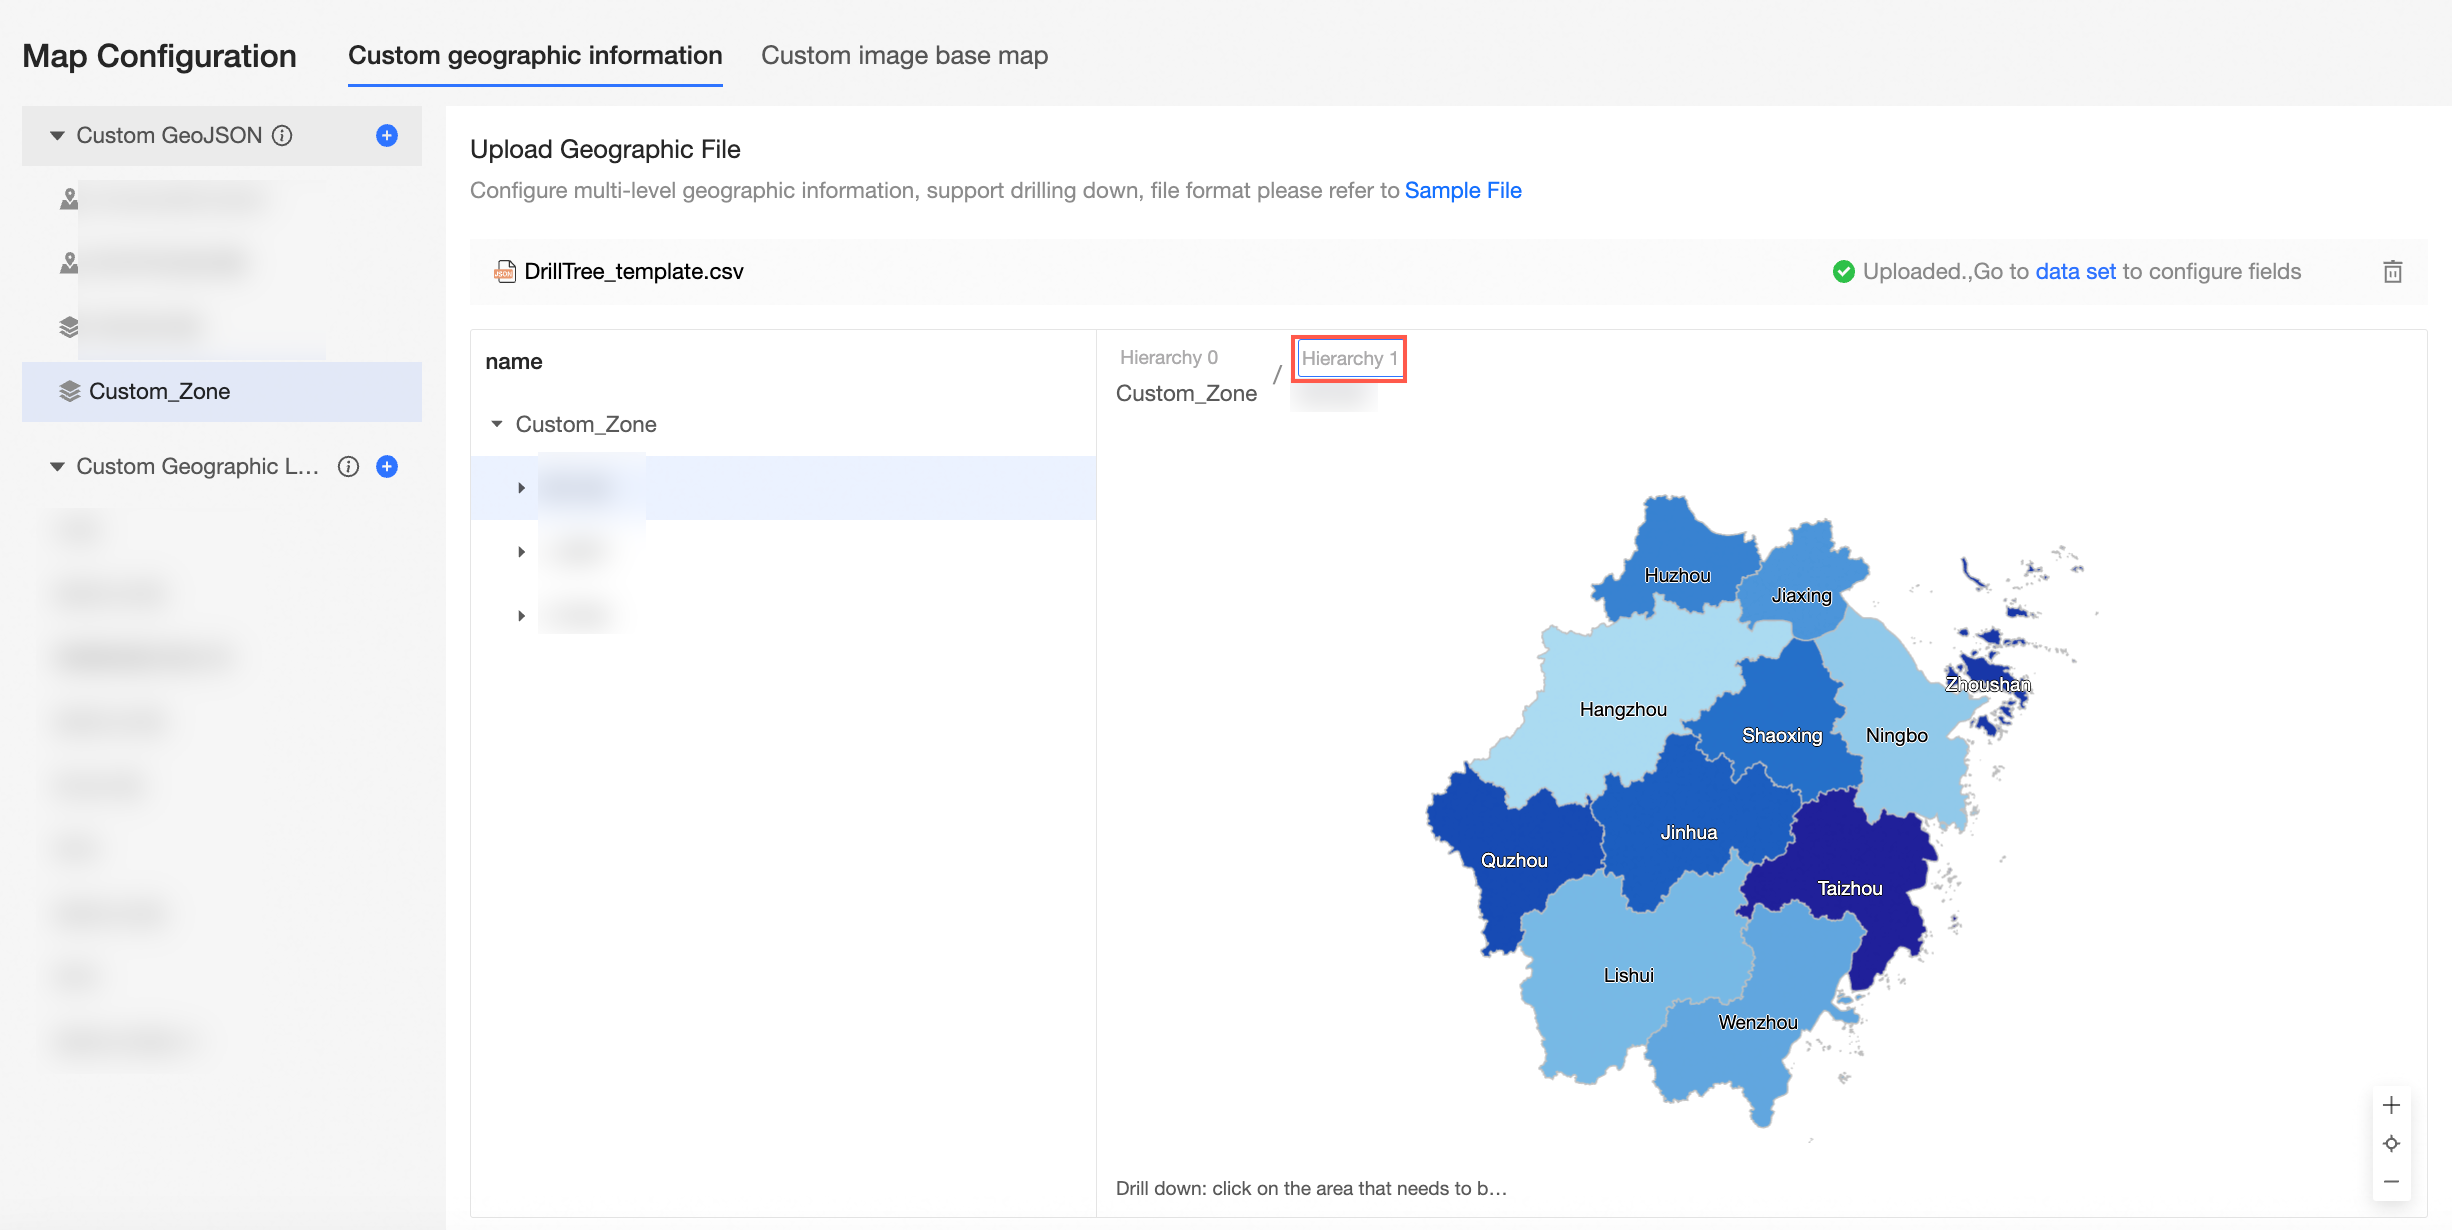
If you want to view the map information of different levels, you can double-click the level name to rename the level.
Change the dimension type of a geographic dimension field in a dataset
Procedure
On the Quick BI homepage, follow the instructions in the following figure to go to the dataset editing page.
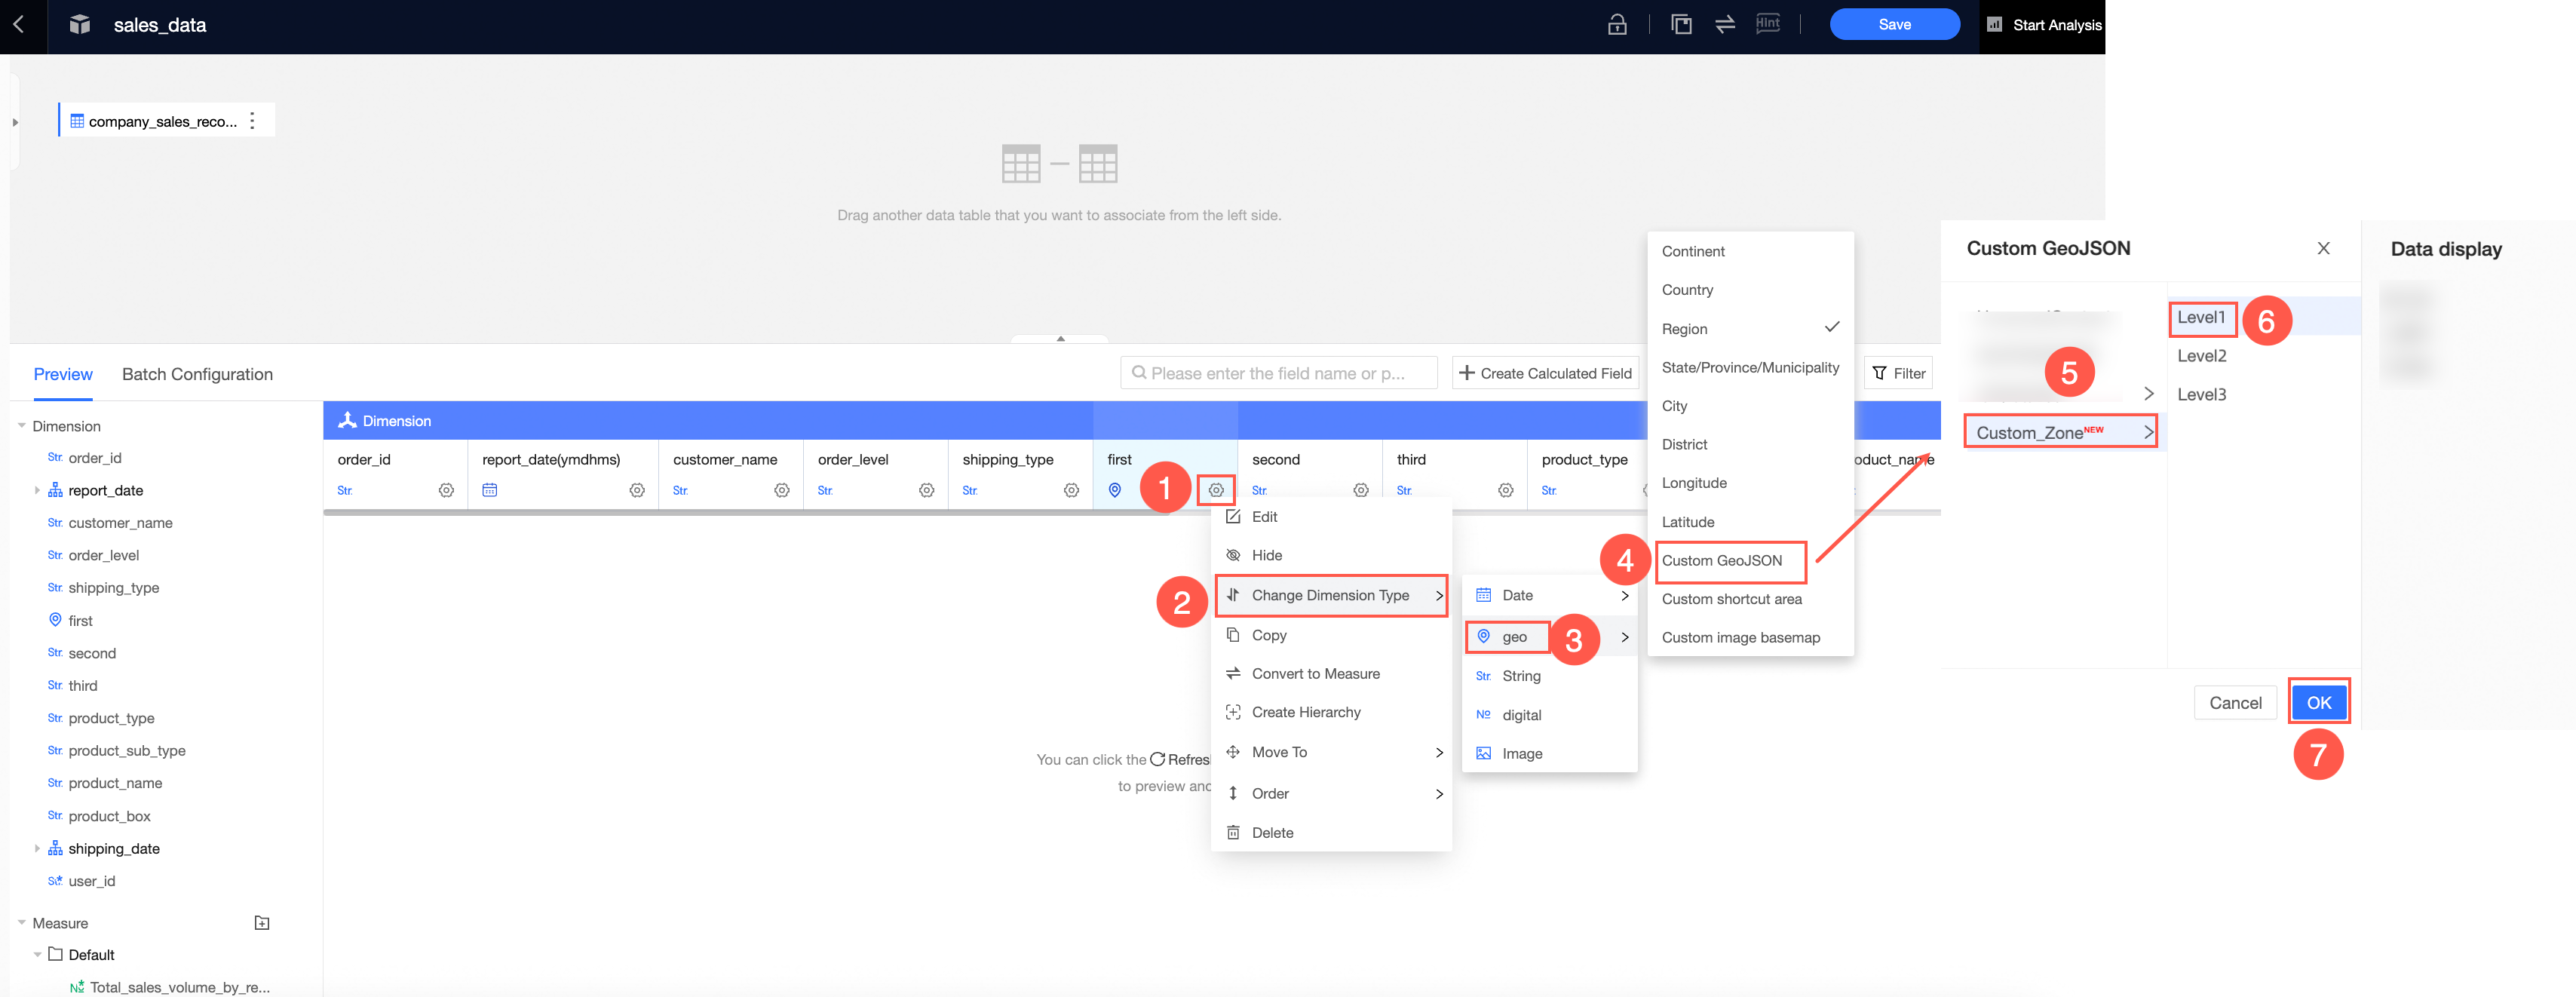
Change the value of the Geo Dimension field to Multi-level Geographic Information field by following the instructions shown in the following figure.
Set the Level 1 field to Level 1 of the multi-layer geographic information. In the right-side navigation pane, click OK.
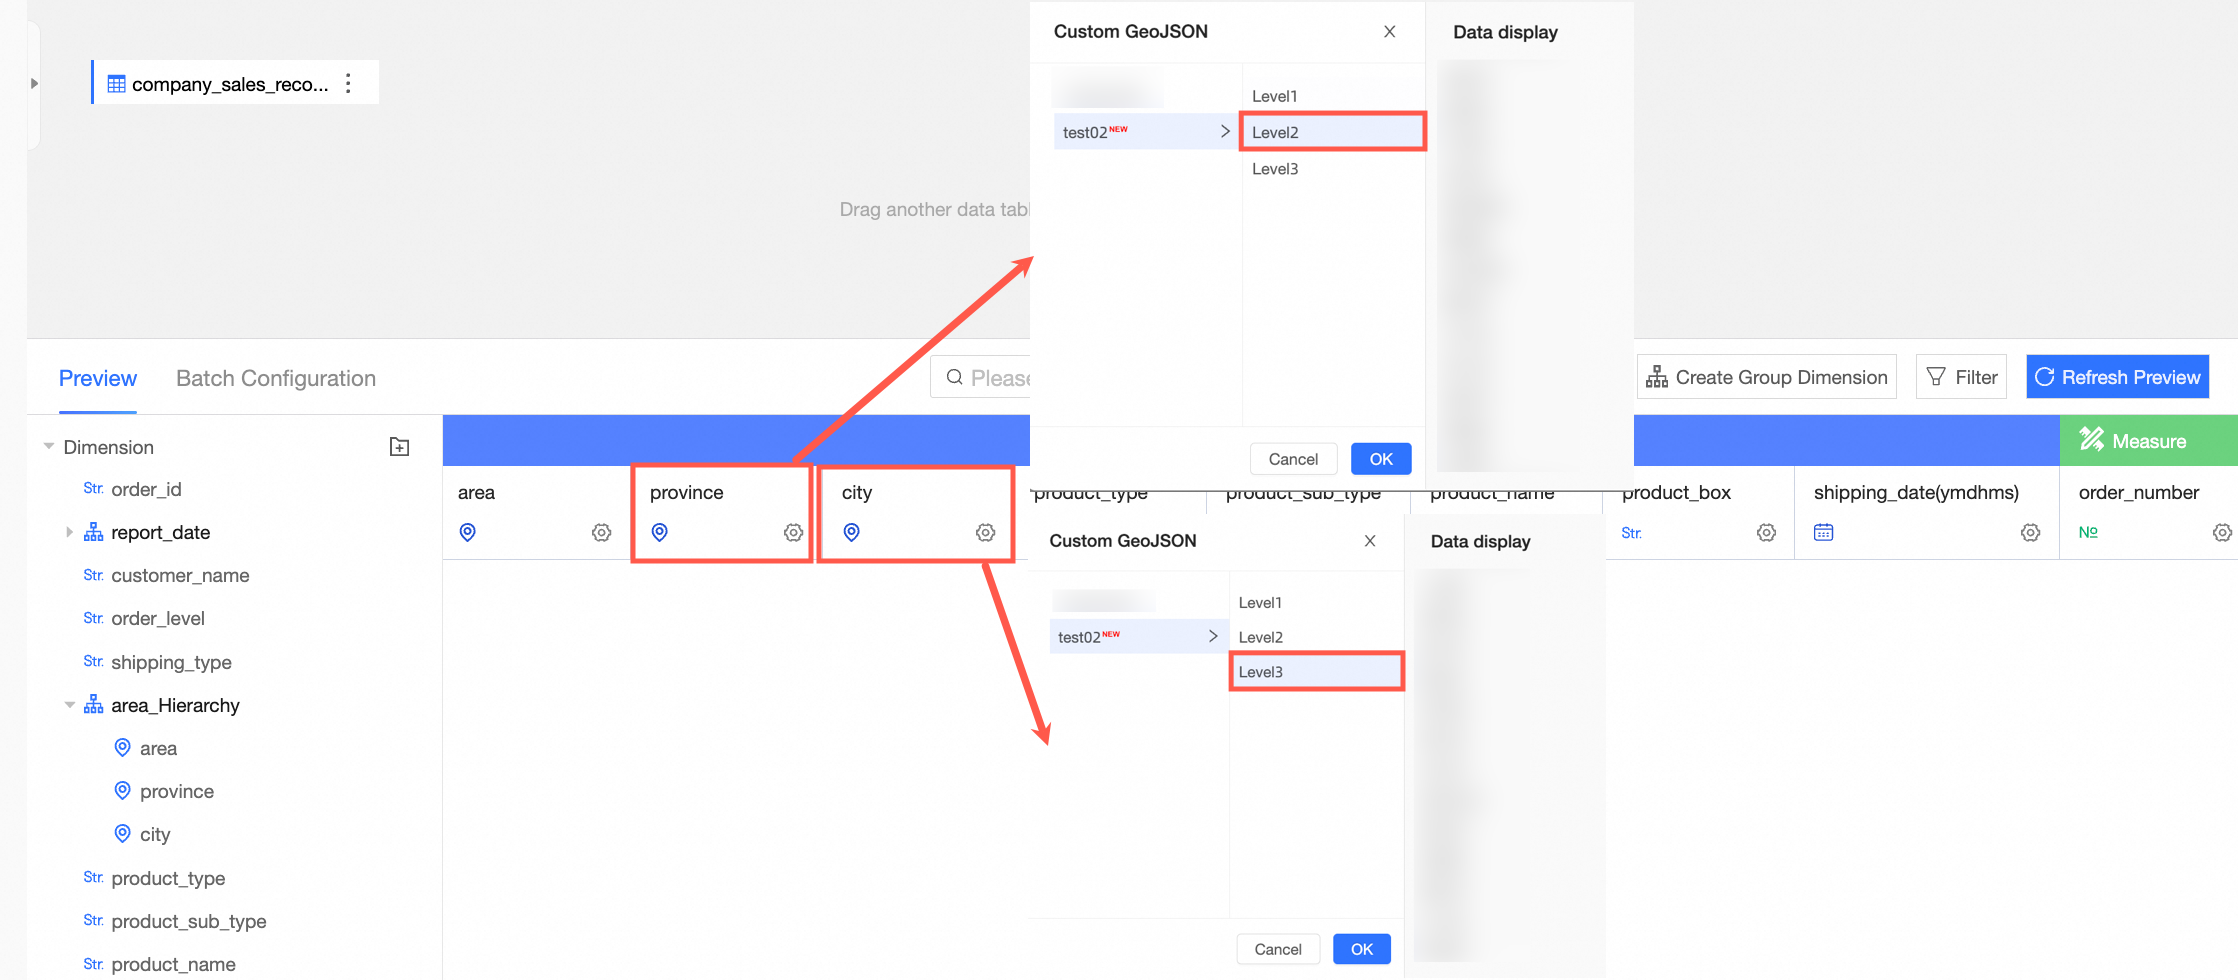
Set Level 2 to Level 2 and Level 3 to Level 3.
After you edit the dataset, click Save in the upper-right corner of the page to save the dataset.
Display the effect of a custom partition in a map
The following uses colored map as an example.
Procedure
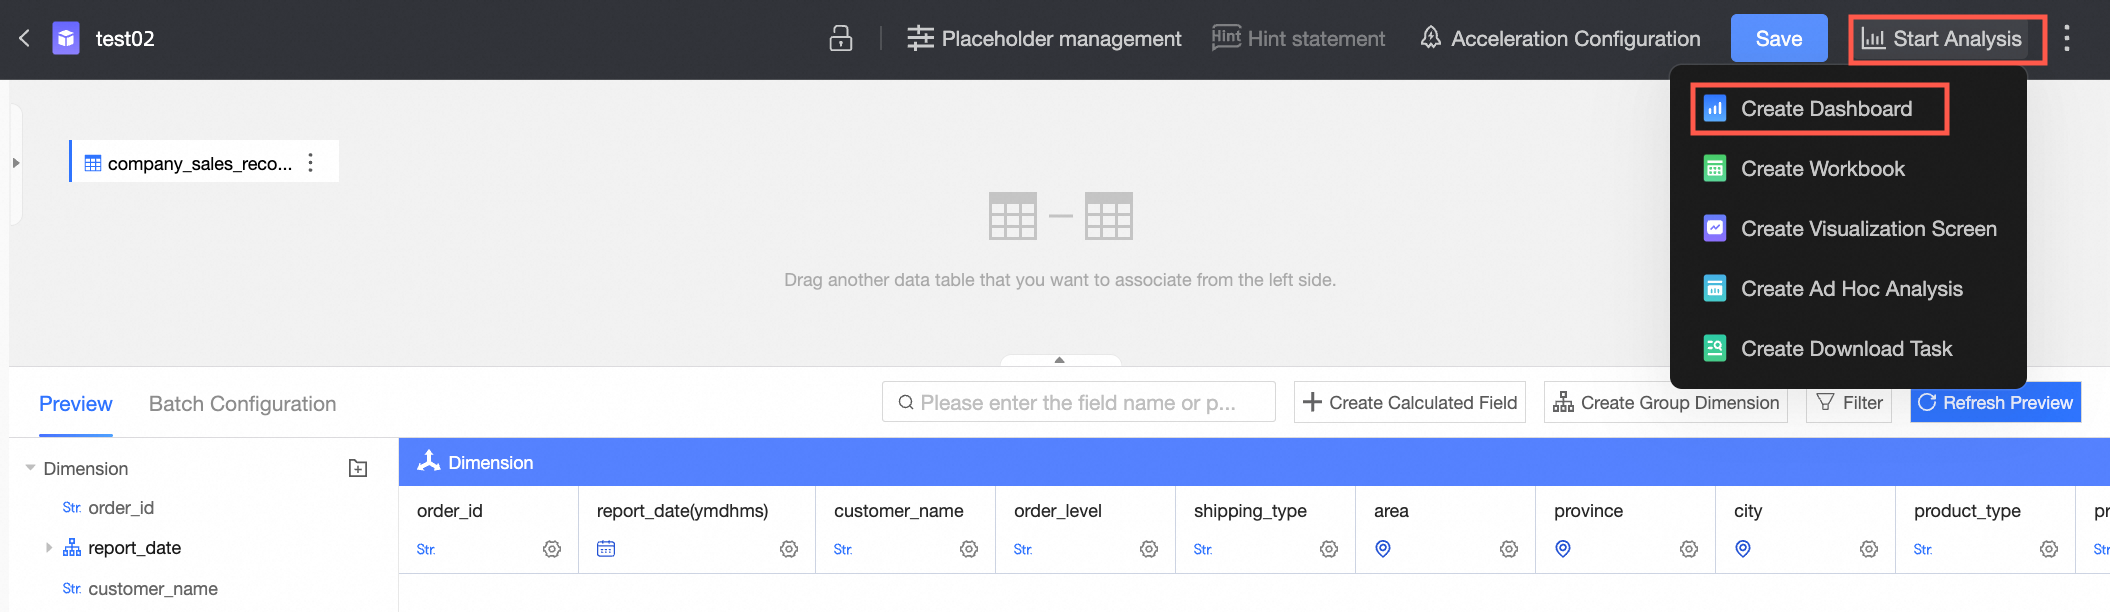
On the dataset editing page, click Start Analysis in the upper-right corner and select Create Dashboard.
On the dashboard editing page, create a colored map, drag the first layer field to Geo Area /Dimension, and drag the Amount field to Colorscale /Measure. You can view the data of the first layer in the custom multi-layer geographic information.
In the Geo Region /Dimension section, click the
 icon on the right side of Level 1 to enable the drill-down feature. Drag the Level 2 and Level 3 dimension fields to the Drill-down /Dimension section.
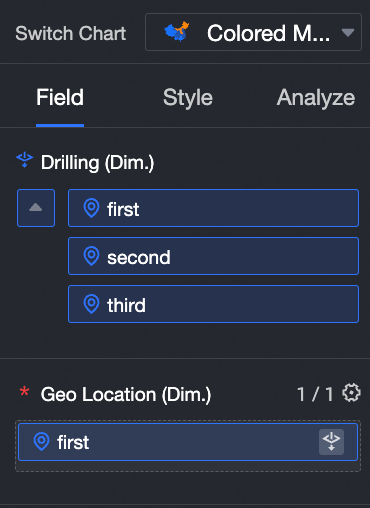
Then, you can drill down in the colored map to view the data at different levels in the custom multi-layer geographic information.