The default geographic locations that are provided in the Quick BI console can no longer meet the business requirements of enterprises to divide business regions in a flexible manner. Quick BI allows organization administrators to configure custom geographic locations based on provinces or municipalities in China. This helps enterprises divide business regions in an efficient manner. This topic describes how to configure a custom geographic location and display the custom geographic location on a map.
Configure a custom geographic lnformation
Log on Quick BI console.
The organization administrator creates (④) and names a custom partition (⑤) according to the instructions in the following figure.

Select the custom geographic location that you created and perform the steps that are shown in the following figure to add business regions to the custom geographic location.

The following table describes the other operations that you can perform on the Map Configuration page.
Parameter | Configuration Items Example |
1. Rename a custom geographic location. |
|
2. Delete a custom geographic location. | |
3. Modify the region name or classification. | |
4. Delete a custom region. | |
5. Zoom in or zoom out the map. |

Change the dimension type of a geographic dimension field in a dataset
On the homepage of the Quick BI console, perform the steps that are shown in the following figure to go to the dataset edit page.

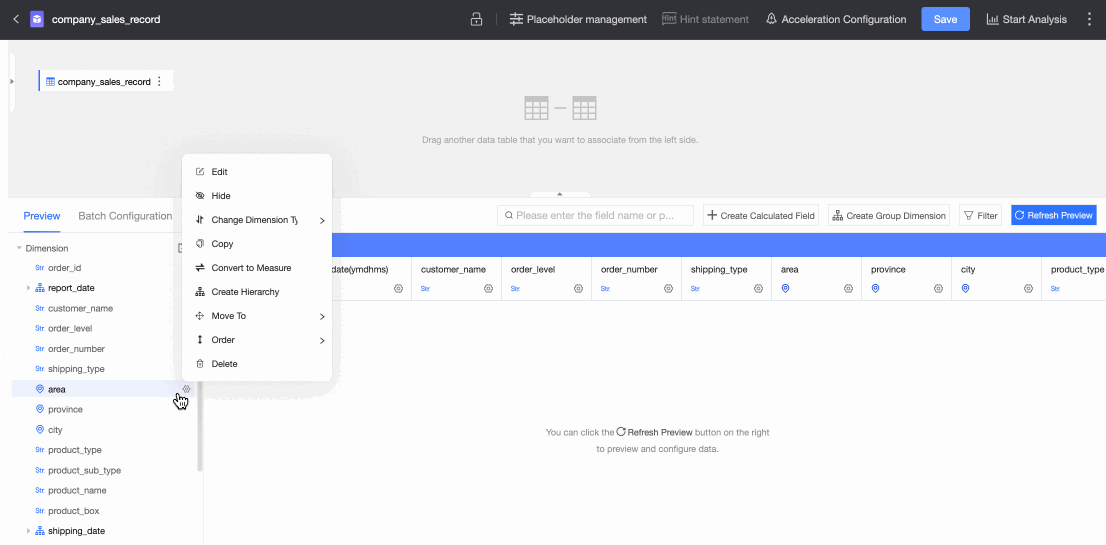
Perform the steps that are shown in the following figure to change the dimension type of a geographic dimension field to Custom Location.

Follow the instructions in the following figure to switch the province geographic dimension field.
You can switch only the geographic fields that need to be referenced in subsequent maps. The following example describes how to switch provinces.

- (Optional)
Create a new hierarchy.
Create a hierarchy for subsequent drilling and analysis of data.
NoteSkip this step if you do not need to analyze the drilling effect.
Click Save in the upper-right corner to save the dataset.
Display a custom geographic location on a map
Custom geographic locations can be displayed on colored maps and bubble maps. The following example displays a custom geographic location on a colored map.
On the dataset editing page, choose in the upper-right corner to create a dashboard.

On the dashboard edit page, perform the steps that are shown in the following figure to create a colored map.
If you add a business region field to the Geo Location (Dim.) section, the business region field is displayed on the map of China. Only data in the business region of the custom geographic location is displayed on the colored map.
You can drill down data in the business region field to view data of provinces or cities in the business region.
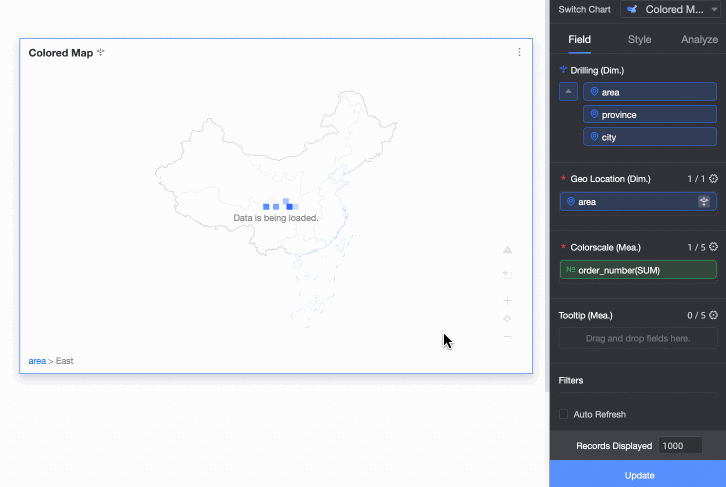
If you add the province field to the Geo Location (Dim.) section, only data of provinces in the business region is displayed on the colored map.

You can configure the Display range parameter on the Style tab to view the data of provinces in the business region.

Limits
Only organization administrators can configure custom geographic locations.
After a custom geographic location is configured, developers and analysts can use the custom geographic location for data analysis and visualization.
Only Quick BI Enterprise Standard and Quick BI Advanced allow you to configure custom geographic locations in workspaces.
Limits on the configuration of custom geographic locations:
You can configure a custom geographic location based on only provinces or municipalities in China.
Custom geographic locations can be displayed only on colored maps and bubble maps.