Supports analysis of the effect of push tasks and displays key item data and task data trends.
Choose Workspace> User Marketing > Reach Marketing > PUSH > Effect Analysis to analyze the marketing effect, as shown in the following figure. In the upper-right corner of the page, filter the effect analysis data of the specified time, specified PUSH account /application. 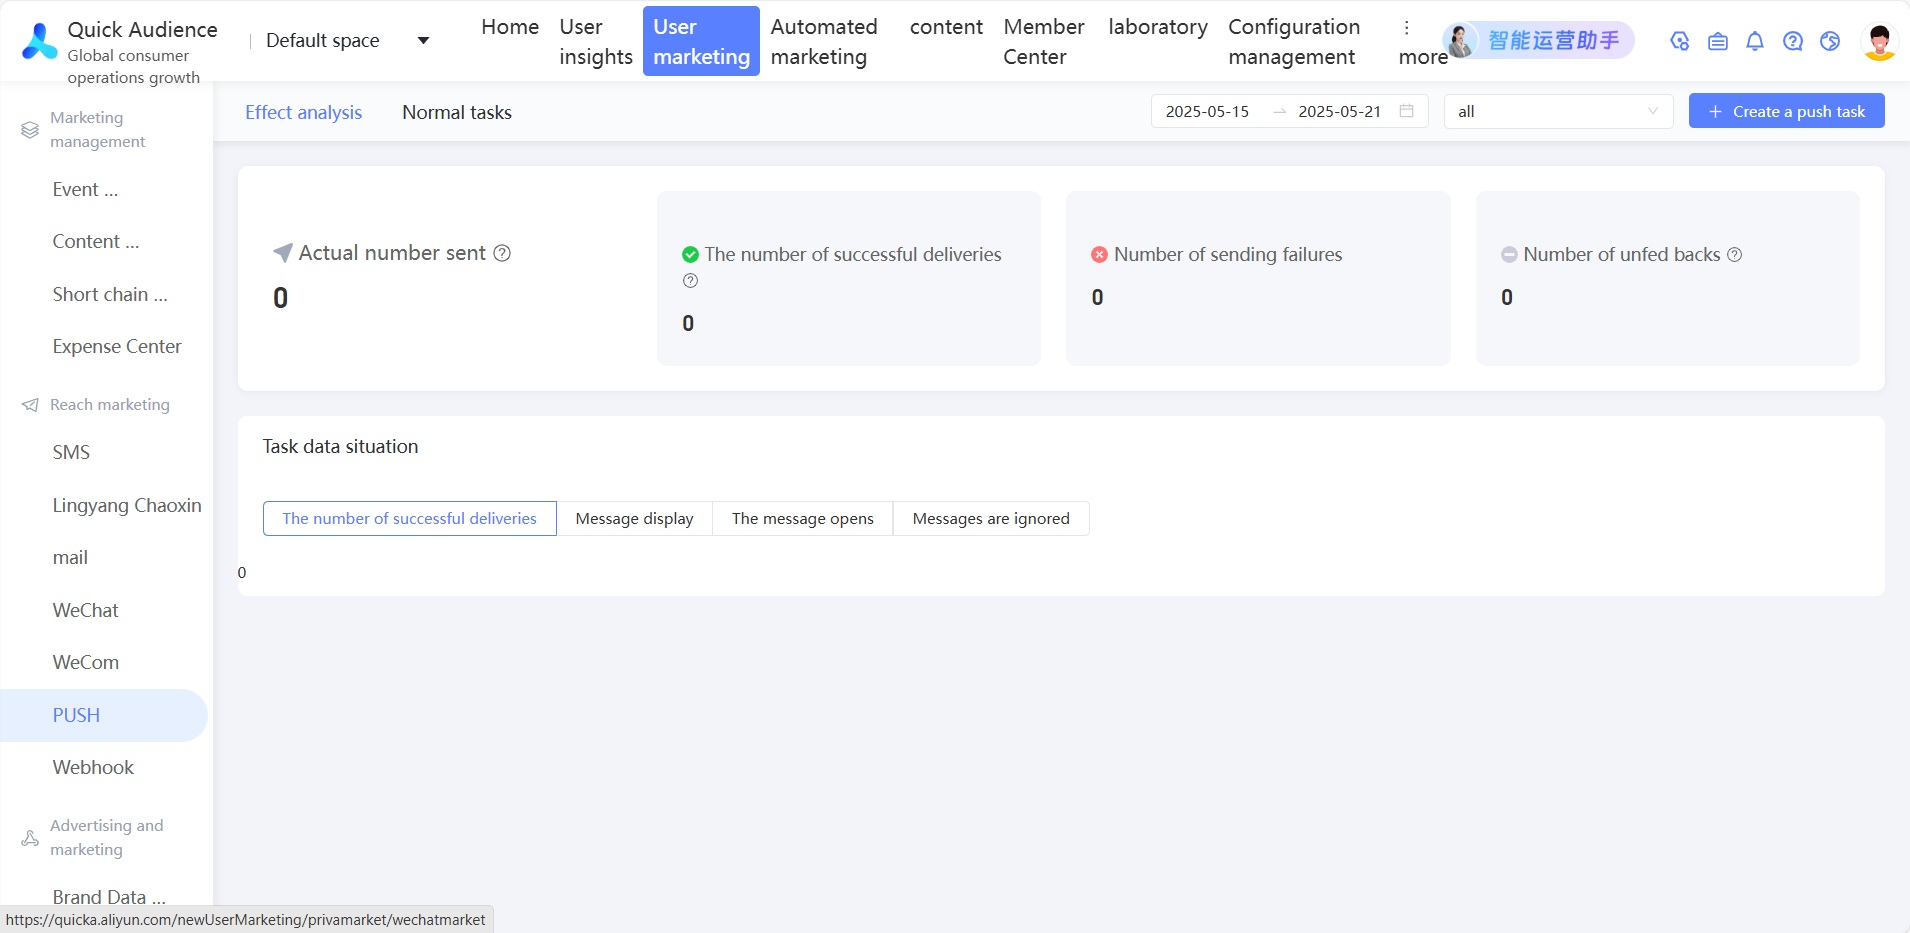
PUSH marketing effect analysis depends on the Umeng PUSH receipt function. You need to activate the Umeng Pro version. Please contact the Umeng side to enable it before creating a PUSH task.
Effect analysis data counts all tasks under the corresponding PUSH account /application created in the new version (V4), without distinguishing between touch marketing and automated marketing.
The page displays the following information:
The number of actually sent messages, the number of successfully sent messages, the number of failed messages, and the number of unreturned messages. The number of displayed messages, opened messages, and ignored messages.
Actual Sent Number: the total number of devices that are actually sent, including the PUSH channel and the vendor channel.
Number of displays: Number of successes-The number of notifications that have been disabled.
Opened: Number of times a user clicked to open a message via the notification bar.
Ignored Count: the number of messages that are closed, excluding the number of notifications that are batch closed.
Task data: the trend charts of the number of successfully sent messages, the number of displayed messages, the number of opened messages, and the number of ignored messages. The charts represent the data of Android and iOS applications in different colors.