Before running a performance test, you need to verify that the virtual user (VU) counts, requests per second (RPS) levels, ramp-up stages, and total duration match your intent. The load preview chart -- also called the stress prediction chart -- shows how Performance Testing Service (PTS) distributes load over time. Use it to validate your configuration without starting an actual test run.
The chart appears next to the Load Settings (or Stress Mode Configuration) section on the test scenario page. It updates automatically when you change any load parameter.
How the chart shape is determined
The chart shape depends on three factors:
| Factor | Options | Effect on chart |
|---|---|---|
| Load mode | VU load mode or RPS load mode | Determines the Y-axis metric (VUs or RPS) |
| Ramp-up pattern | Tiered increment mode or manual adjustment mode | Determines whether the chart shows a step curve or a range band |
| Data exporting | Enabled or disabled per business session | When enabled, the chart splits into a data preparation phase and a scenario performance testing phase |
Choose VU load mode when you want to control the number of concurrent users. Choose RPS load mode when you want to control the request arrival rate regardless of concurrency. For details on configuring these modes, see Configure the stress testing model and level.
VU load mode with tiered increment mode
In tiered increment mode, VUs ramp up from a starting percentage to 100% of the configured maximum, increasing by a fixed increment percentage at each step.
All sessions start together (no data exporting)
When no business session exports cookies, PTS starts all business sessions at the same time.
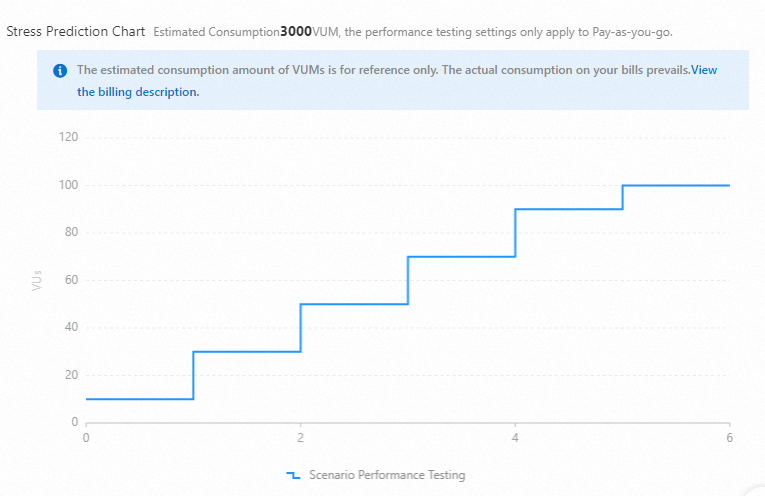
Chart metrics:
| Metric | Description |
|---|---|
| Load level | VUs increase to the maximum in steps, each step adding the configured increment percentage |
| Initial VUs | Sum of initial VUs across all business sessions. Example: two sessions with 5 initial VUs each = 10 initial VUs in the chart |
| Total test duration | Time to complete the entire test, calculated with the formula below |
| Estimated VUM consumption | Estimated VU x Minute (VUM) usage. For reference only -- actual consumption may differ |
Total test duration formula
Total test duration (minutes) = Single load level duration x [(100% - Starting percentage) / Increment percentage + 1]Round up (100% - Starting percentage) / Increment percentage to the nearest integer to get the number of increments.
Example: Single load level duration = 1 min, starting percentage = 10%, increment percentage = 20%.
(100 - 10) / 20 = 4.5 --> round up to 5 increments
Total = 1 x (5 + 1) = 6 minutes
As a quick rule of thumb: each increment step adds one "single load level duration" to the total test time. Count the number of steps (including the final 100% step), then multiply by the step duration.
When business sessions have different durations, the longest session determines the total test duration.
Phased execution (with data exporting)
When a business session exports cookies (for example, to share logon state), PTS runs the test in two phases:
Data preparation -- PTS runs only the exporting session (for example, Business Session 1) until it reaches its maximum VUs. This prepares the data level (logon user level).
Scenario performance testing -- After data preparation completes, PTS starts the remaining sessions.
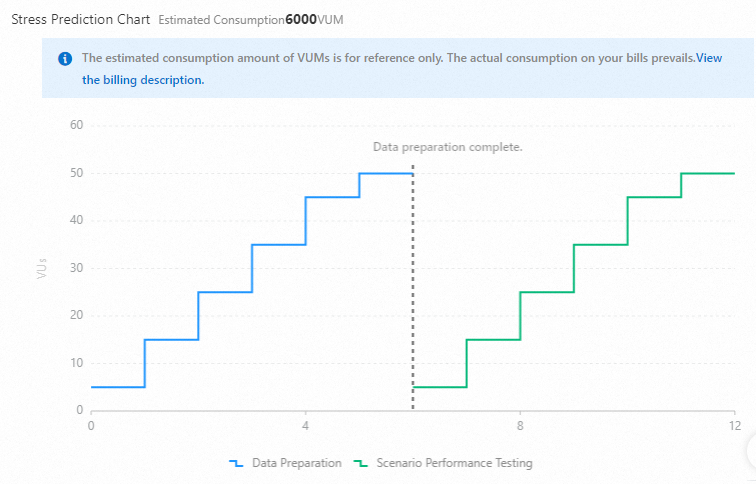
Chart metrics:
| Metric | Description |
|---|---|
| Initial VUs (data preparation) | Initial VUs of the exporting session only. Example: 1 |
| Initial VUs (after data preparation) | Sum of initial VUs in the remaining sessions. Example: Business Session 2 has 2 initial VUs |
| Data preparation completion | The point when the exporting session reaches its maximum VUs (example: 50 VUs) |
In an actual test, data preparation duration depends on the throughput of the exporting business session, not on a fixed timer.
Total test duration formula
Total test duration = Data preparation duration + Test time for remaining sessionsEach part follows the same formula:
Session test time (minutes) = Single load level duration x [(100% - Starting percentage) / Increment percentage + 1]Example: Both the data preparation phase and the scenario testing phase use single load level duration = 2 min, starting percentage = 10%, increment percentage = 20%.
Each phase = 2 x [(100 - 10) / 20 + 1] = 2 x 6 = 12 minutes
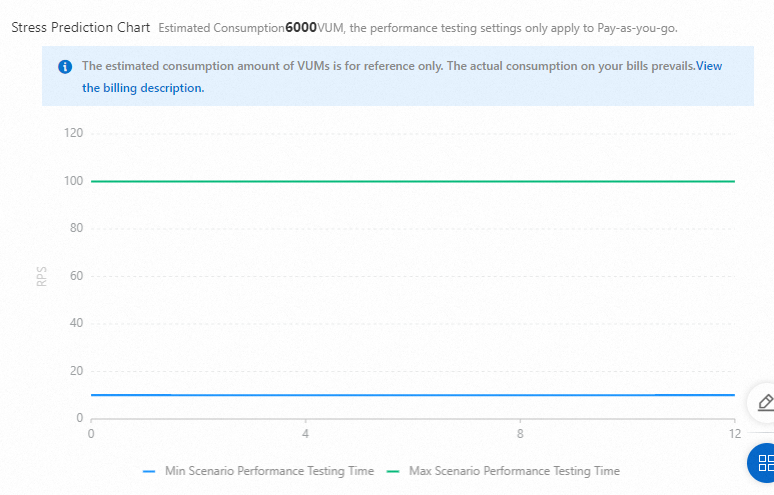
Total = 12 + 12 = 24 minutesRPS load mode with manual adjustment mode
In manual adjustment mode, the load fluctuates between the configured minimum and maximum values throughout the test. The load preview chart shows a range band rather than a step curve.
All sessions start together (no data exporting)
When no business session exports cookies, PTS starts all business sessions at the same time. The load range shown in the chart is the sum of load ranges across all sessions.
Phased execution (with data exporting)
When a business session exports cookies, PTS splits the test into two phases, just as in VU mode.
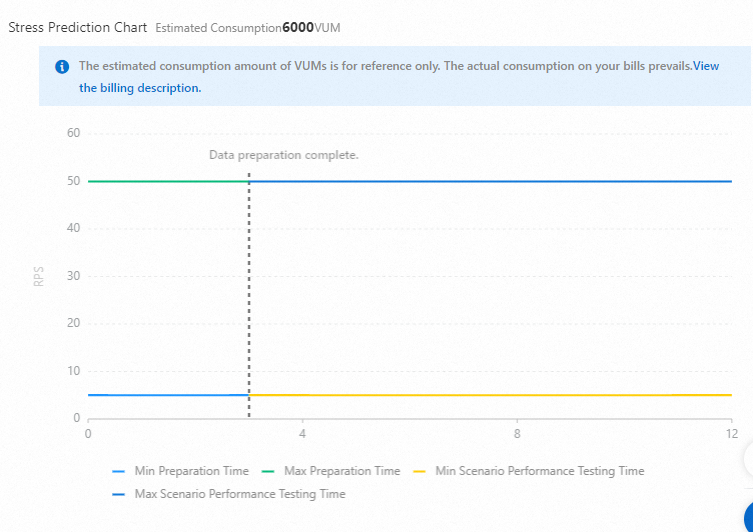
Chart metrics:
| Phase | Load range |
|---|---|
| Before data preparation completes | Total starting RPS to total maximum RPS of all APIs in the exporting session. Example: 2 to 20 RPS |
| After data preparation completes | Total starting RPS to total maximum RPS of all APIs in the remaining sessions. Example: 1 to 10 RPS |
Total test duration
In manual adjustment mode, data preparation is expected to complete within 20% of the exporting session's test duration, with a minimum of 1 minute.
In an actual test, data preparation duration depends on the throughput of the exporting business session.