After a stress test completes, the system automatically collects test data, such as scenario metrics, business details, monitoring data, and API sampling logs, to generate a stress testing report. This topic describes the details of a stress testing report and its key metrics.
Procedure
-
Log on to the PTS console and choose .
-
Find the report you want to view and click View Report in the Actions column.
ImportantThe sampling log data in a stress testing report is retained in the PTS console for 30 days. After this period, the logs are no longer available for viewing. To prevent data loss, promptly export and save your reports locally.
Report details
-
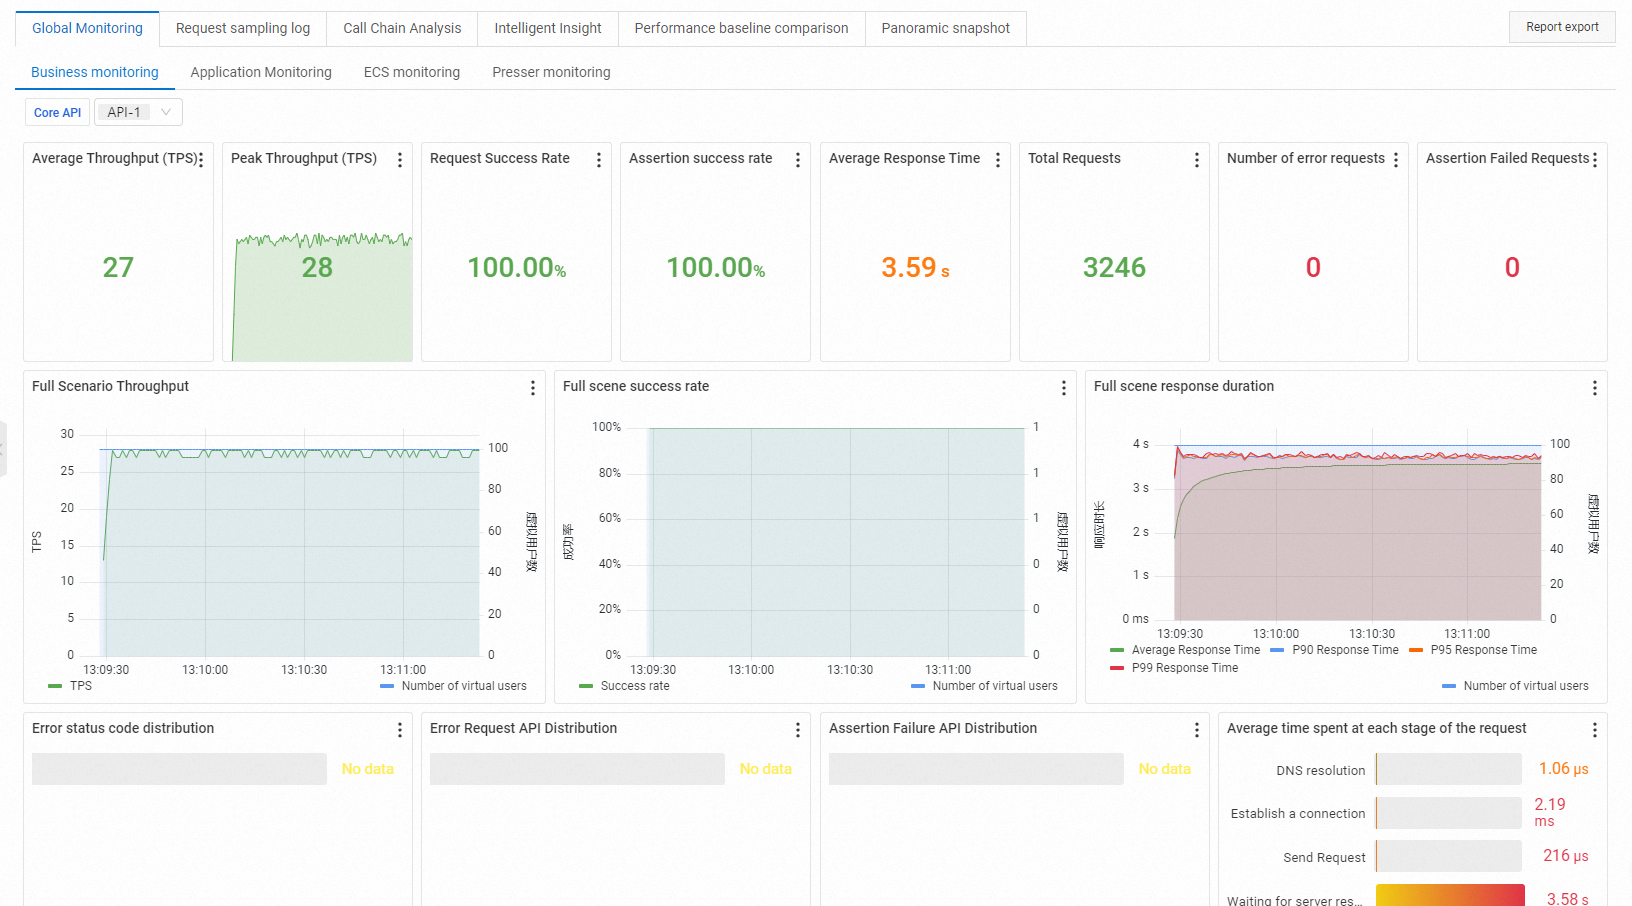
On the report details page, click Global Monitoring > Business Monitoring to view basic test information, an overview of business metrics, and detailed business data. For more information, see Test metrics.
-
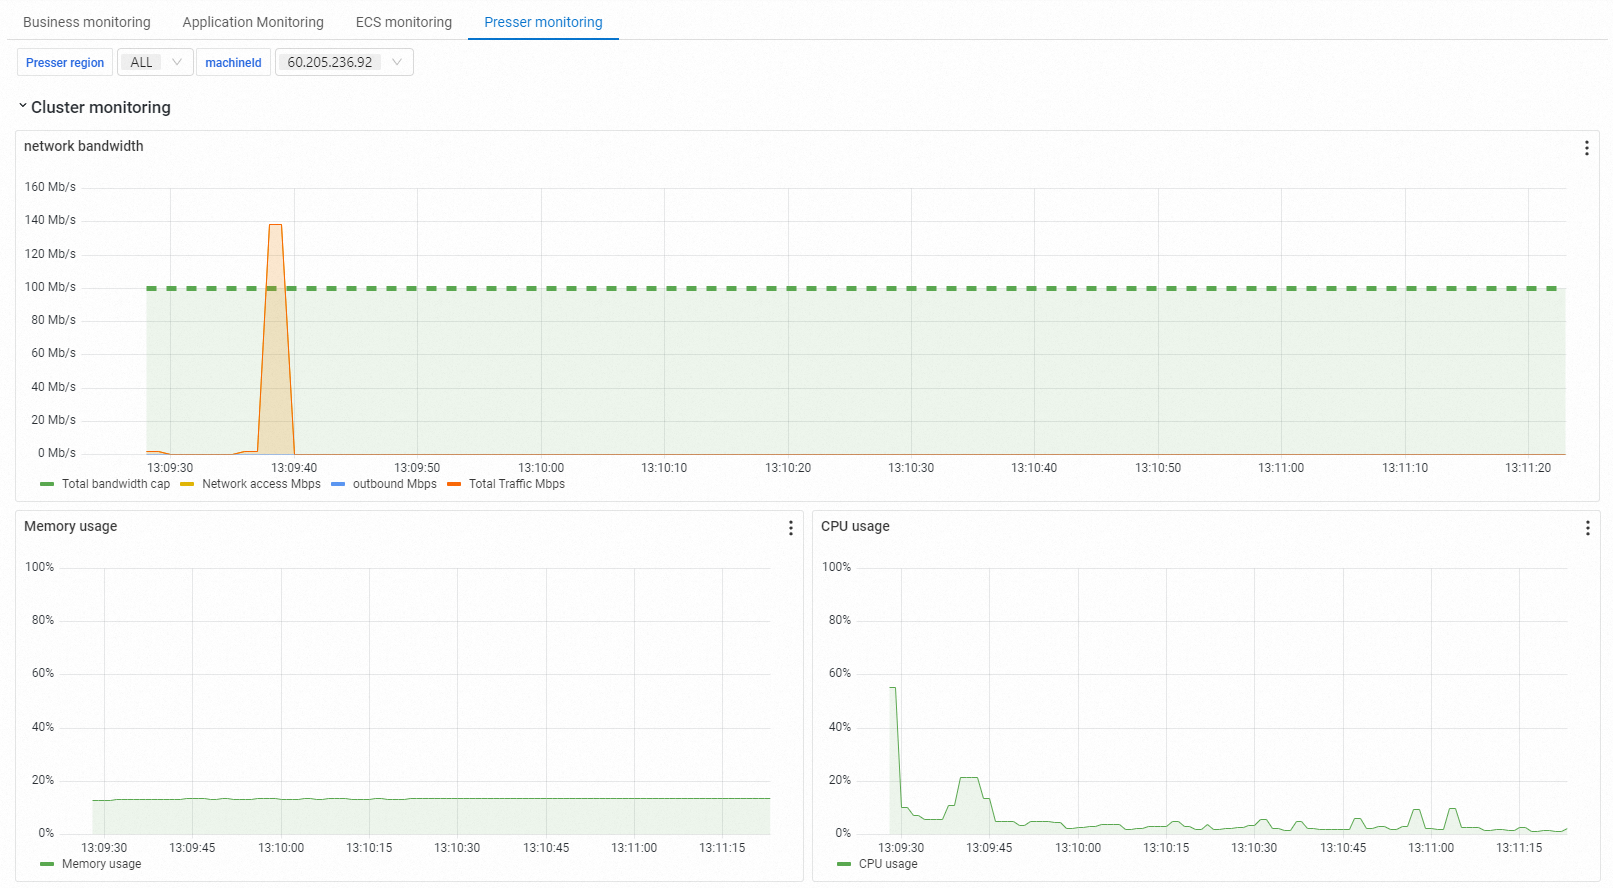
On the report details page, click Global Monitoring > Load Generator Monitoring to view details about the load generators, including their region, network bandwidth, CPU, and memory usage.
-
On the report details page, click the Request Sample Log tab, and then click View Details for a specific request to see its General information and Timing Waterfall chart. You can use the sampling log to quickly identify and locate issues during a stress test or in the final report.
The timing waterfall displays the time distribution for each request in a horizontal bar chart, in five phases: DNS (DNS lookup time), ConnectTime/Reuse (connection establishment time), Request Sent (request sending time), Waiting(TTFB) (time to first byte), and Content Download (response download time). The table below the chart lists the URL, start time, and total duration for each request.
-
On the report details page, click the Insights tab to view a comprehensive scenario analysis.
The analysis area is divided into two panels that display the anomaly detection status. If no issues are found, it displays No anomalies detected.
-
If you configured a baseline when you created the scenario, you can click the Baseline Comparison tab on the report details page. This allows you to compare the current test data against the baseline. For example, if the baseline for average response time (RT) is set to less than 1,000 ms but the actual result is 3,590 ms, the test status is marked as failed.
In addition, if the success rate baseline is greater than 98% for the entire scenario and the actual request success rate is 100%, the baseline status is marked as successful.
-
Compare stress testing reports
PTS allows you to compare stress testing reports from the same scenario, identified by its scenario ID.
-
On the report details page, click the Baseline Comparison tab. On this page, click Select stress testing report to import other stress testing reports from the same scenario.
-
You can compare up to three stress testing reports at a time.
-
-
On the report details page, click the Global Snapshot tab to view the details of your configured scenario. You cannot start a stress test from this tab.
Key metrics
|
Metric |
Description |
|
Request success rate |
The percentage of successful requests across all scenarios during the stress test. |
|
Assertion success rate |
The business success rate across all scenarios during a stress test, based on passed assertions. |
|
Average response time (RT) |
The average response time (RT) for all API calls, measured in milliseconds (ms). |
|
Average throughput (TPS) |
The average transactions per second (TPS) for the scenario during the testing period. |
|
Peak throughput (TPS) |
The maximum TPS recorded for the scenario during the testing period. |
|
Number of failed requests |
The number of requests that failed during the stress test. |
|
Number of failed assertions |
The number of configured assertions that failed. |
|
Total requests |
The total number of requests initiated by PTS during the stress test. |