Managed Service for Prometheus records every alert triggered by your alert rules. Use the Alert page to search and filter historical alerts by name, severity, status, or integration source, then take action -- claim, resolve, block, or reassign alerts directly from the list.
Prerequisites
Before you begin, ensure that you have:
Access to the Managed Service for Prometheus console
Permissions to view and manage alerts
A linked DingTalk identity (required for alert management actions; see Link your DingTalk identity)
Open the alert history page
Log on to the Managed Service for Prometheus console.
In the left-side navigation pane, choose Alert Management > Alert Sending History.
The Alert page lists all historical alerts with their severity level, alert name, current status, and assigned handler.
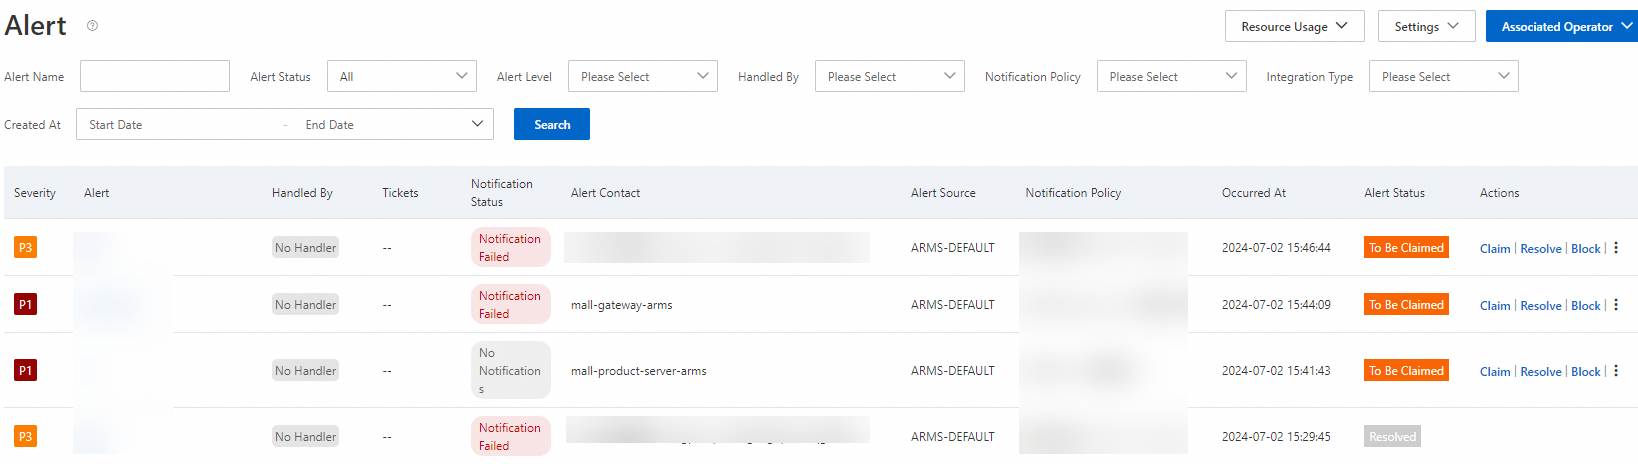
Filter alerts
Narrow down the alert list by specifying one or more filter conditions, then click Search.
| Filter | Description |
|---|---|
| Alert Name | Name of the alert rule that triggered the alert |
| Alert Status | Current status: To Be Claimed, Processing, or Resolved |
| Alert Level | Severity defined in the alert rule: P1, P2, P3, P4, P5, or Default |
| Handled By | User assigned to handle the alert |
| Notification Policy | Notification policy configured for the alert rule |
| Integration Type | Source service that generated the alert event (see Integration type values) |
| Created At | Time range during which the alert was triggered |
Integration type values
Alerts can originate from the following sources:
| Category | Services |
|---|---|
| ARMS | ARMS, ARMS - Browser Monitoring, ARMS - Application Monitoring, ARMS - Application Monitoring eBPF Edition, ARMS - Managed Service for Prometheus, ARMS - Managed Service for OpenTelemetry, ARMS - Synthetic Monitoring, ARMS-Insights, ARMS-Grafana, ARMS - Custom Monitoring |
| Cloud Services | Log Service, CloudMonitor, EventBridge |
| Self-managed | Prometheus, Grafana, Zabbix, SkyWalking, OpenFalcon, Nagios, Custom Integration |
View alert details
Click an alert name to open the Alert Details page. This page shows the alert severity, notification configuration, and current status.
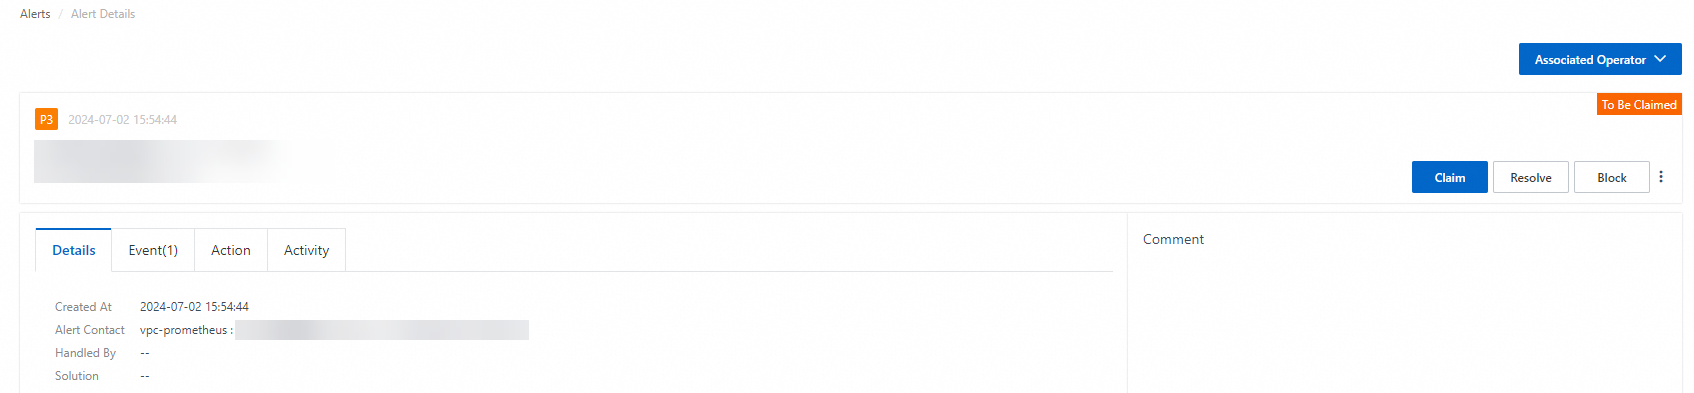
The Alert Details page provides four tabs:
| Tab | What it shows | When to use |
|---|---|---|
| Details | Trigger time, triggering object, assigned handler, and notification recipients | Identify what triggered the alert and who was notified |
| Event | Related alert events with timestamps and statuses. Click an event name to drill into its details. | Trace the sequence of events that led to or followed the alert |
| Action | Operation records for the alert | Audit who took what action and when |
| Activity | Alert logs | Review the full log trail for the alert |
From this page, you can claim, resolve, or block the alert. For all available actions, see Manage alerts.
View alert event details
On the Event tab, click an alert event to open the Event Details panel. This panel displays the event's basic information, monitoring data, and extended fields.
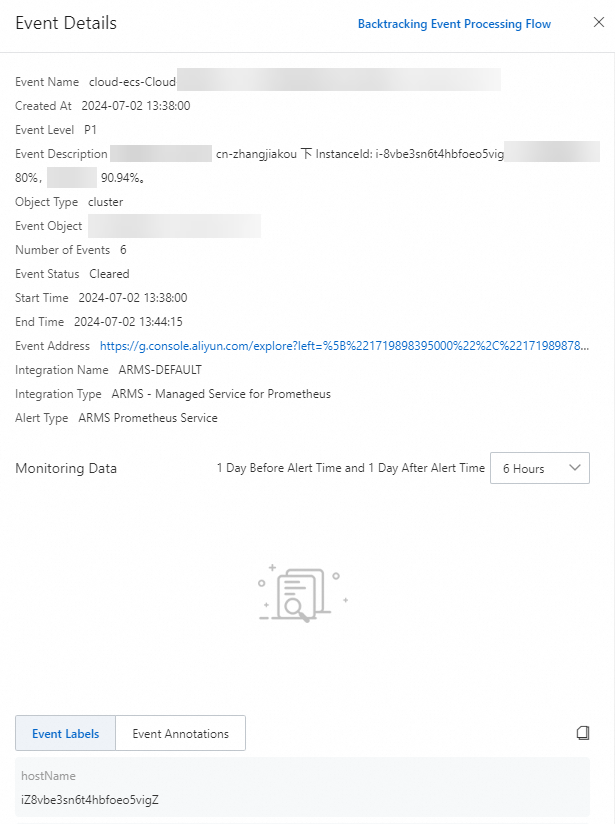
Read the monitoring data chart
The Monitoring Data section shows a time-series chart of the metrics around the time the alert was triggered.
To adjust the time window, use the time range selector in the upper-right corner. Options include 6, 12, or 24 hours before and after the trigger time.
To zoom in on a specific period, drag the pointer across the chart to select a range. Click Reset to return to the original time range.
Manage alerts
Claim, resolve, or block an unresolved alert. You can also assign a handler or change the severity.
Link your DingTalk identity
Multiple users may share an Alibaba Cloud account. DingTalk authentication is required before you manage alerts. Your DingTalk nickname is recorded as the operator name.
On the Alert page, click Associated Operator.
Select Association by Scanning Code from DingTalk, scan the QR code with DingTalk, authenticate your identity, and bind your mobile phone number.
Take action on an alert
On the Alerts page, find the target alert and use the Actions column:
| Action | What it does |
|---|---|
| Claim | Assign the current account as the handler |
| Resolve | Clear the alert |
| Block | Suppress the alert |
 > Specify Alert Handler > Specify Alert Handler | Assign a member from a DingTalk group chat as the handler |
| > Modify Alert Level | Change the alert severity |
| > Push Alerts | Push the alert to a ticket system |