When alert rules fire across your monitored infrastructure, you need a centralized view to investigate what triggered, when, and which resources were affected. Managed Service for Prometheus records every alert event on the Events page. You can filter events by name, status, integration, or object, and drill into individual events to inspect the associated monitoring data.
Prerequisites
Before you begin, make sure that you have:
Access to the Managed Service for Prometheus console
At least one configured alert rule that has generated alert events
Open the Events page
Log in to the Managed Service for Prometheus console.
In the left-side navigation pane, choose Alert Management > Alert Event History.
The Events page lists each alert event with its name, notification policy, quantity, status, object, and the time when the event was generated.
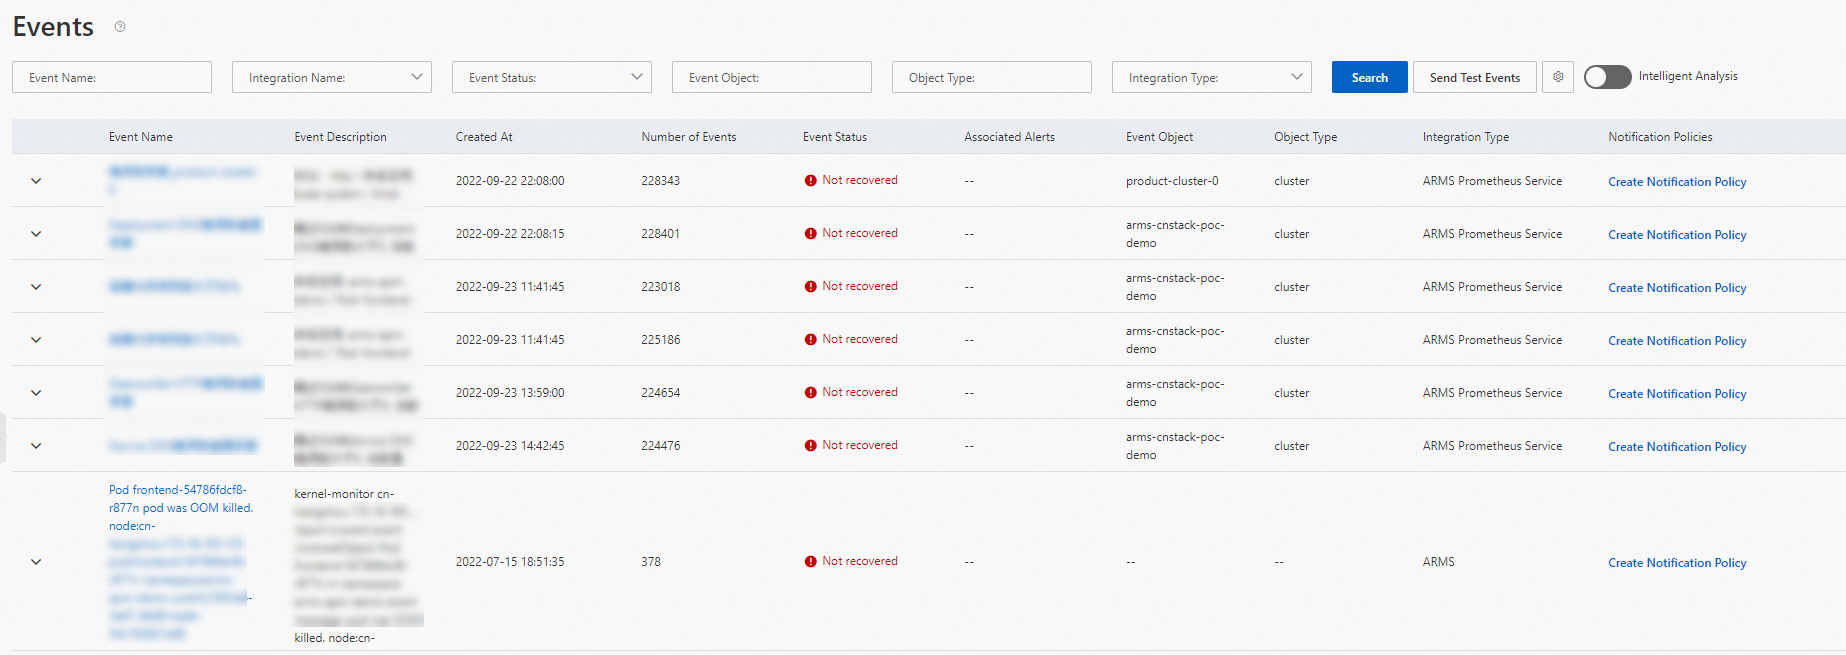
Filter alert events
Specify one or more filter conditions and click Search to narrow down the event list.
| Filter | Description |
|---|---|
| Event Name | The alert rule that generated the events. |
| Integration Name | The service from which alert events originated. |
| Event Status | The current state of alert events. See the event status values described in the following table. |
| Event Object | The monitored resource, such as a monitoring task or cluster, that triggered the events. |
| Object Type | The type of monitored resource that triggered the events. |
| Integration Type | The name of the service from which alert events originated. |
Event status values
| Status | Meaning |
|---|---|
| Not Cleared | The alert fires every time the event is detected. |
| Silence | Within the specified time range, the alert fires only when the event is first detected. Subsequent occurrences are suppressed. |
| Cleared | Within the specified time range, alerts are not generated when the alert event is detected. |
View event details
Click an event name to open the Event Details panel.
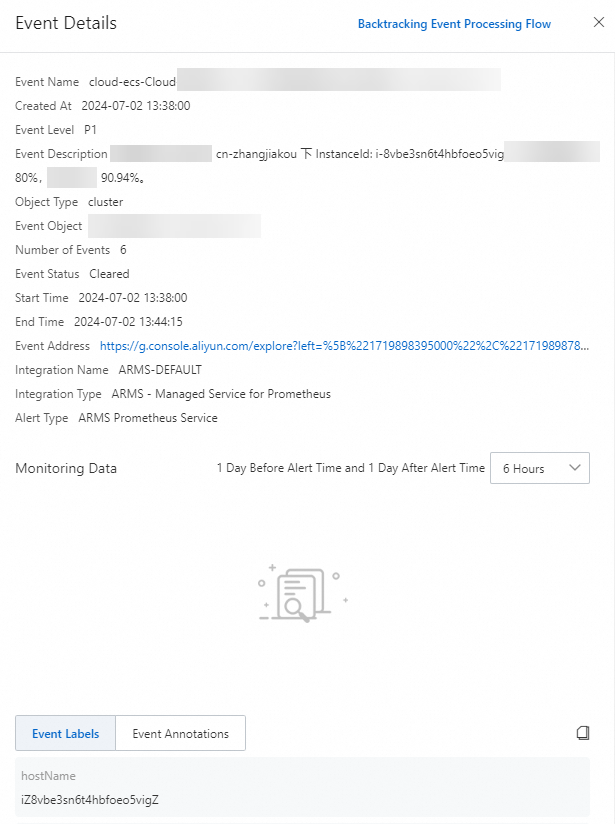
The Monitoring Data section displays a time-series chart of the metrics associated with the alert event. You can analyze the data in two ways:
Adjust the time range: In the upper-right corner of the Monitoring Data section, select the time range from 6 hours, 12 hours, or 24 hours before the alert trigger time to 6 hours, 12 hours, or 24 hours after the alert trigger time.
Zoom in on a specific period: Drag across the chart to select a time range. Click Reset to return to the original view.
Send a test event
To verify that an integration receives alert events correctly, click Send Test Event in the upper-right corner of the Events page. In the dialog box that appears, set the following parameters and submit the test:
| Parameter | Description |
|---|---|
| Integration Name | The integration to which the test event is sent. |
| Event Content | The content of the test alert event. |