This topic describes how to upgrade monitoring components integrated with Application Real-Time Monitoring Service (ARMS), and how to access upgraded dashboards, alert rules, and metrics.
Prerequisites
Managed Service for Prometheus is activated.
The monitoring components are integrated with ARMS.
Upgrade a monitoring component
Existing data remains intact and unaffected during the upgrade.
Log on to the Managed Service for Prometheus console. In the left-side navigation pane, click Integration Management.
On the Integrated Environments tab, click the target environment.
The following uses a container environment as an example.
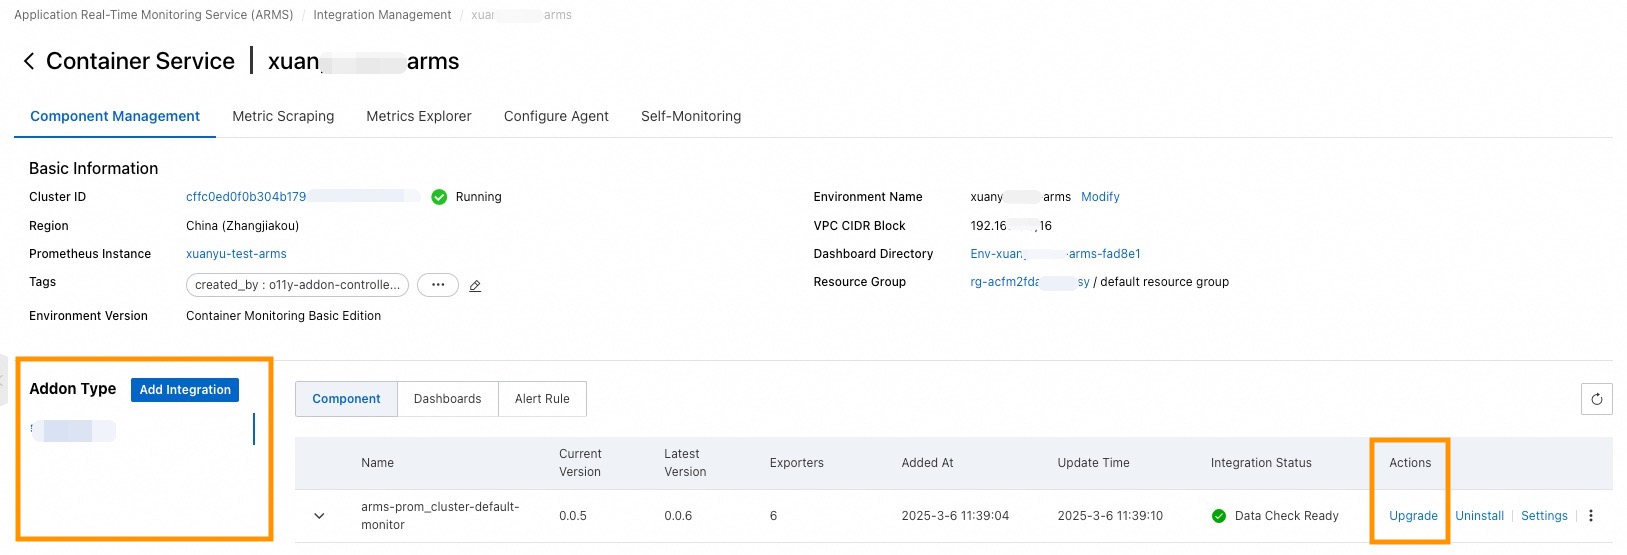
On the Component Management tab, click the component you want to upgrade in the lower-left corner. Then, click Upgrade in the Actions column on the right and upgrade it as prompted.

A message indicating successful upgrade will appear.
View information after the upgrade
You can view:
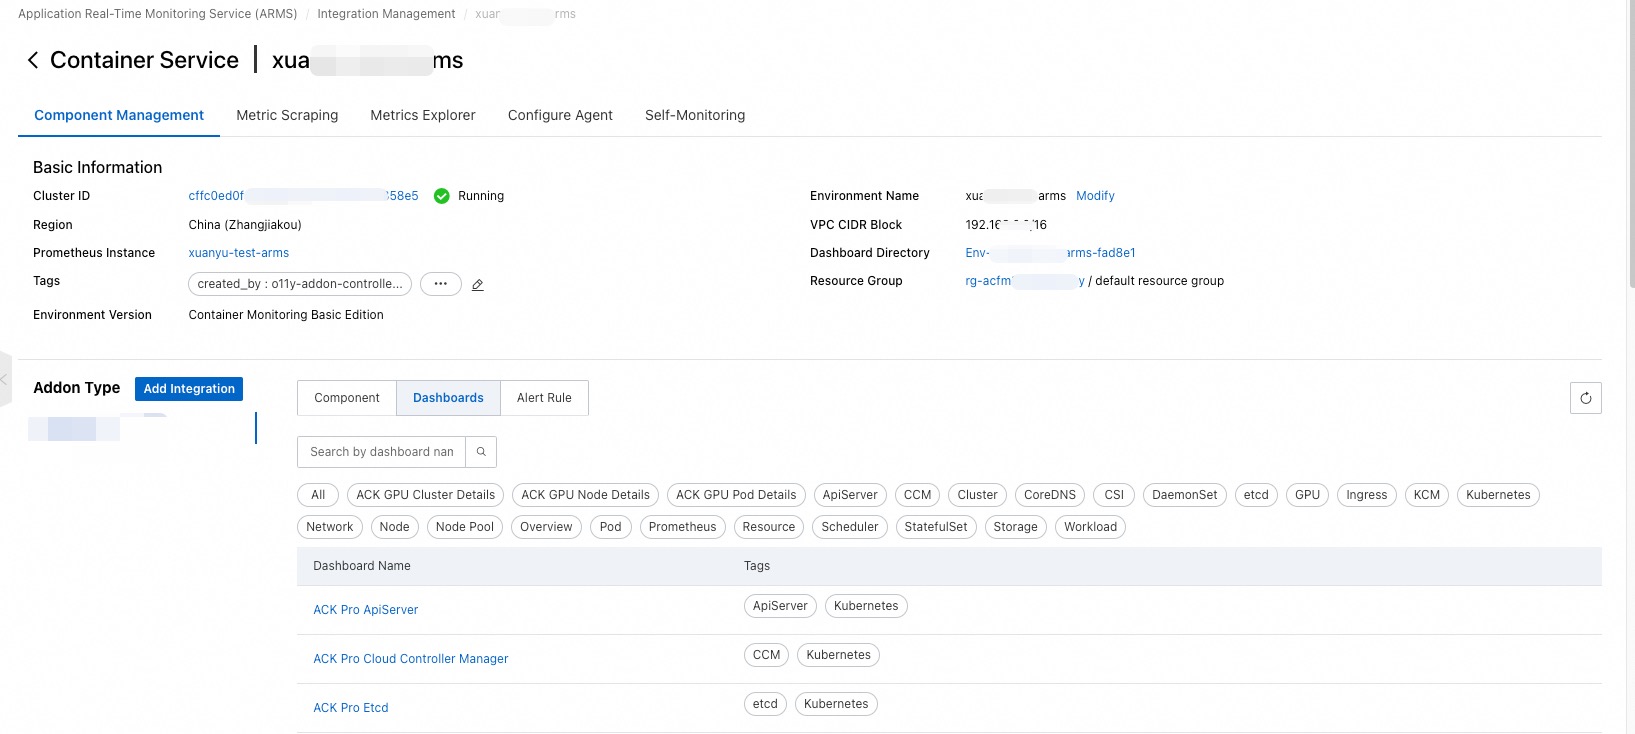
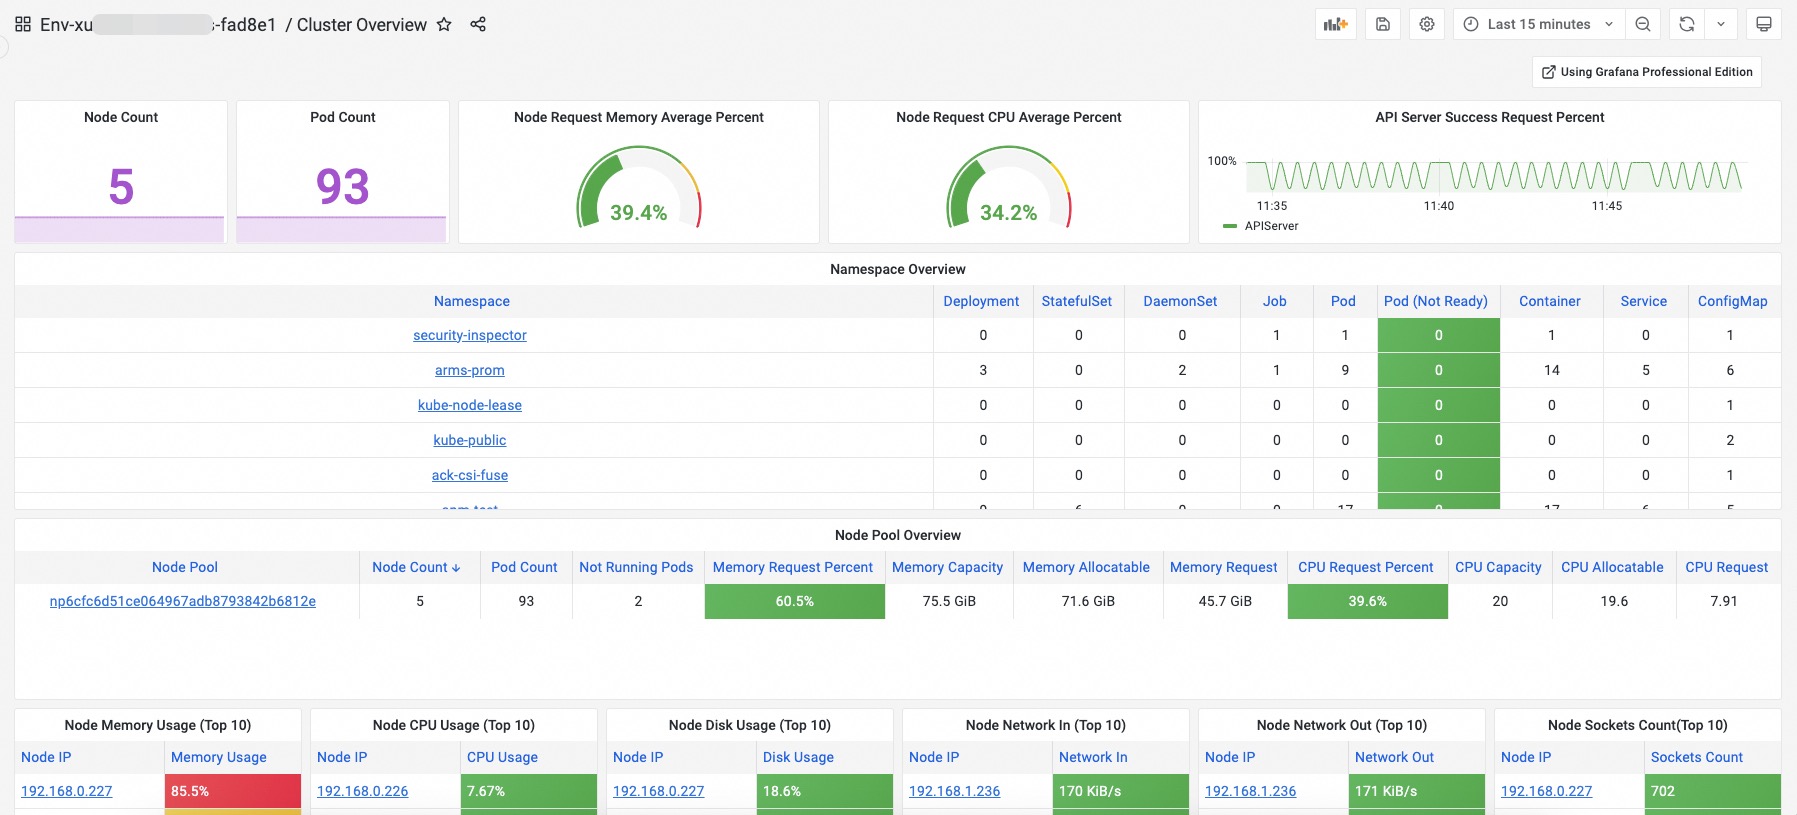
Upgraded dashboards on the Dashboards tab of Component Management


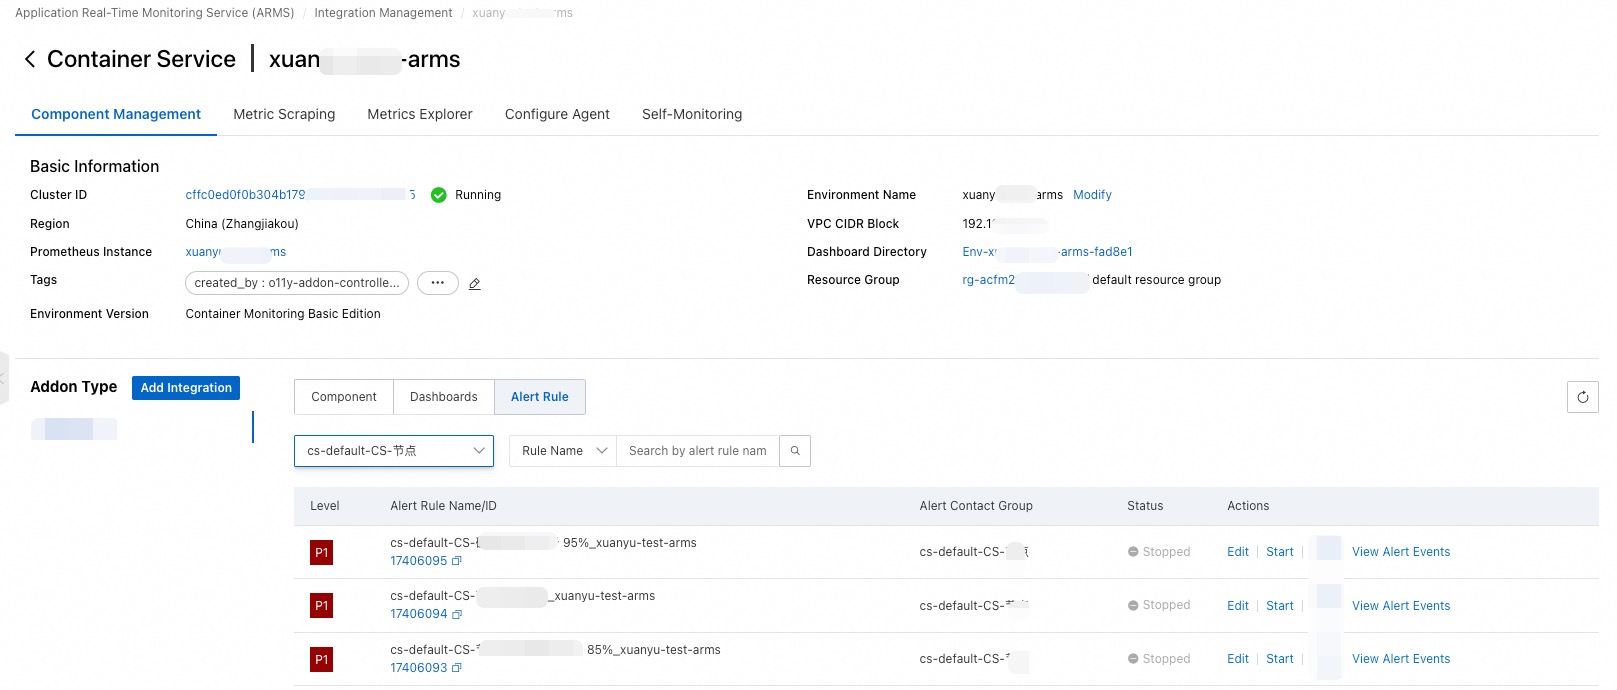
Upgraded alert rules on the Alert Rule tab of Component Management

Upgraded metrics on the Metric Scraping tab

Related steps
Upgrade the ack-arms-prometheus component
After upgrading a monitoring component in a container environment, you'll need to upgrade the ack-arms-prometheus component.
Log on to the Container Service for Kubernetes (ACK) console. In the cluster list, click the target cluster.
In the left-side navigation pane, choose .
On the page that appears, click the Logs and Monitoring tab. Then, check if a new version is available for the ack-arms-prometheus component. If so, click Upgrade.
Upgrade a managed agent
To upgrade a managed agent, take the following steps:
Log on to the Managed Service for Prometheus console.
In the left-side navigation pane, click Integration Management.
On the Integrated Environments tab, click Cloud Service Region. Then, click the environment containing your target agent.
On the page that appears, check if a new version is available for the agent on the Configure Agent tab. If so, click Upgrade.
