Micrometer is an open-source metrics instrumentation library for JVM-based applications. Spring Boot uses Micrometer to expose application and JVM metrics in Prometheus format through Spring Boot Actuator. By connecting Micrometer to Managed Service for Prometheus, you can scrape these metrics automatically and visualize them on built-in dashboards without managing your own Prometheus server.
This guide walks you through adding Micrometer dependencies to a Spring Boot application, connecting it to Managed Service for Prometheus, and viewing metrics on dashboards.
Prerequisites
Before you begin, make sure you have:
A Java application built with Spring Boot 2.x
A deployment target: a Container Service for Kubernetes (ACK) cluster or an Elastic Compute Service (ECS) instance
Access to the Managed Service for Prometheus console
Step 1: Add dependencies and configure the application
This guide uses a Spring Boot 2.x application with Maven as an example. If your project uses Gradle, adapt the dependency declarations accordingly.
Add the Spring Boot Actuator dependency
In the pom.xml file of your project, add the Spring Boot Actuator dependency:
<dependency>
    <groupId>org.springframework.boot</groupId>
    <artifactId>spring-boot-starter-actuator</artifactId>
    <version><x.y.z></version>
</dependency>Replace <x.y.z> with the version that matches your Spring Boot release. If you use the Spring Boot BOM for dependency management, omit the <version> element. To look up the latest version, visit the Alibaba Cloud repository.
Add the Micrometer Prometheus registry
Add the Micrometer Prometheus registry to pom.xml. This dependency enables your application to expose metrics in Prometheus format.
<dependency>
    <groupId>io.micrometer</groupId>
    <artifactId>micrometer-registry-prometheus</artifactId>
    <version><x.y.z></version>
</dependency>If you use the Spring Boot BOM, omit the <version> element. To look up the latest version, visit the Alibaba Cloud repository.
Add Micrometer JVM Extras for process-level metrics
Spring Boot Actuator auto-configures standard JVM metrics (memory, garbage collection, threads, and classloading) out of the box. To collect additional process-level metrics such as resident set size (RSS) and file descriptors from /proc, add the Micrometer JVM Extras library:
<dependency>
    <groupId>io.github.mweirauch</groupId>
    <artifactId>micrometer-jvm-extras</artifactId>
    <version>0.2.2</version>
</dependency>
Then register the metric beans in your Spring configuration:
@Bean
public MeterBinder processMemoryMetrics() {
    return new ProcessMemoryMetrics();
}

@Bean
public MeterBinder processThreadMetrics() {
    return new ProcessThreadMetrics();
}
Configure the Actuator endpoint
In application.properties, expose the Prometheus metrics endpoint:
management.server.port=8080
management.endpoints.web.exposure.include=health,prometheus
Replace 8080 with the port you want Actuator to listen on. The prometheus value exposes the /actuator/prometheus endpoint that Managed Service for Prometheus scrapes. Add other endpoint names as needed (for example, info, metrics).
Deploy and verify
Deploy the application to your ACK cluster or ECS instance.
Verify that the metrics endpoint is accessible: The response contains Prometheus-format metrics, including lines such as
jvm_memory_used_bytes,process_cpu_usage, and any custom metrics you defined.curl http://localhost:8080/actuator/prometheus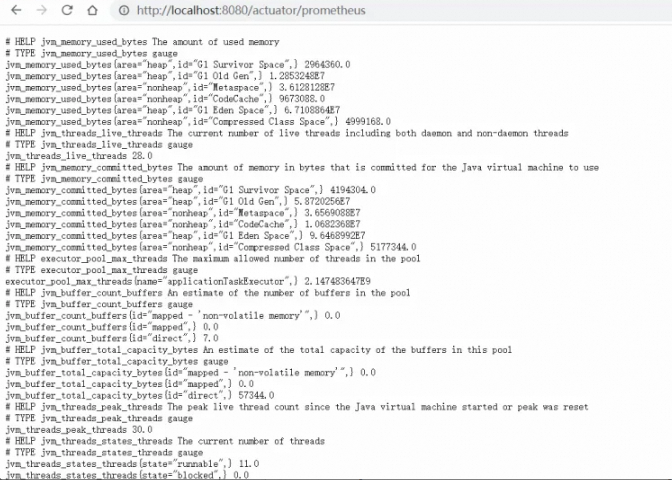
Step 2: Set up the Micrometer integration
After the application exposes metrics, configure Managed Service for Prometheus to scrape them.
Log on to the Cloud Monitor console.
In the left-side navigation pane, click Integration Center.
Search for and select the Micrometer component.

On the Start Integration tab of the MicroMeter panel, configure the following parameters, and then click OK.
Parameter Description Select the environment type The environment where the application runs. Select Kubernetes Environment or ECS(VPC). Select a Kubernetes cluster The ACK cluster that hosts the application. This parameter appears only when you select Kubernetes Environment. Labels Labels of the pod where Micrometer runs. Use descriptive labels to identify the target pods. Service Port The port that the application listens on. The default value is auto-filled. Metrics Collection Path The endpoint path that exposes metrics. The default value is auto-filled. Use HTTPS to Collect Data Whether to scrape metrics over HTTPS instead of HTTP. Disabled by default. Metric Scrape interval (unit/second) How often to scrape metrics, in seconds. Default: 30.
Step 3: View dashboards
In the left-side navigation pane, click Integration Management.
On the Integrated Environments tab, click the name of the environment.

On the Component Management tab, in the Addon Type section, click MicroMeter, and then click Dashboards.
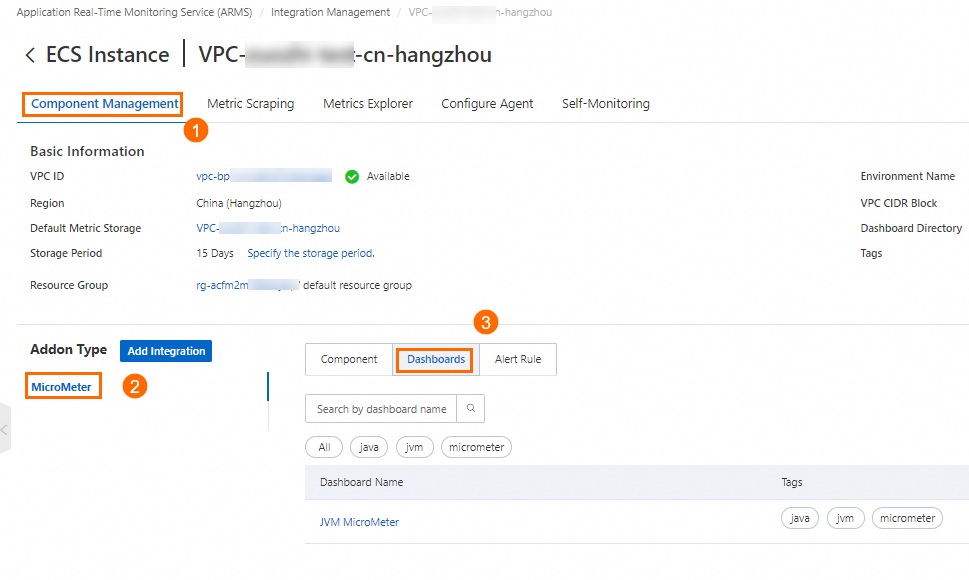
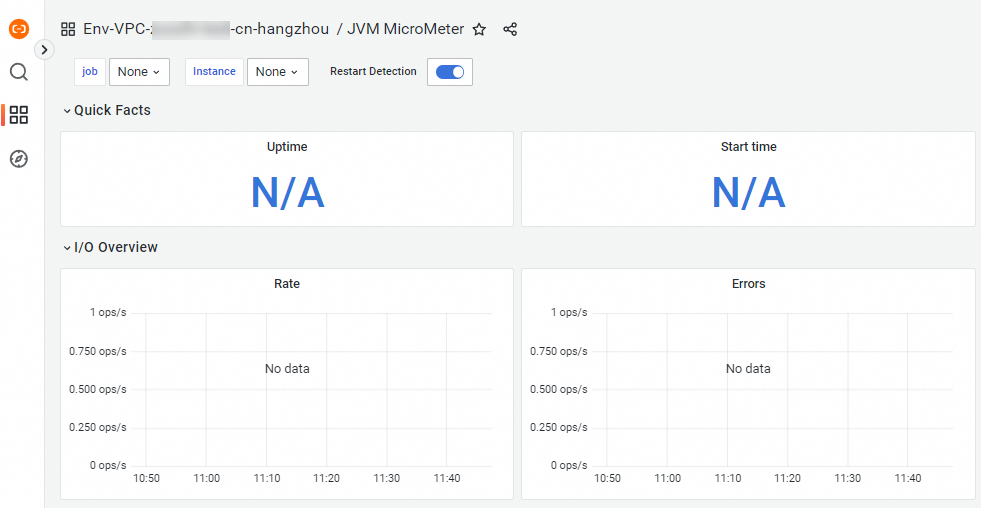
Click a dashboard name to open it.
Step 4: Configure alert rules
Default alert rules are included with the Micrometer integration. To view or customize them:
On the Component Management tab, in the Addon Type section, click MicroMeter, and then click Alert Rule.
Review the default alert rules. To create custom rules based on your requirements, see Create an alert rule for a Prometheus instance.
Troubleshooting
If metrics do not appear on the dashboards, check the following:
Endpoint accessibility: Run
curl http://<host>:<port>/actuator/prometheusfrom within the deployment environment. If the response is empty or returns an error, verify that the Actuator dependency is added and the endpoint is exposed inapplication.properties.Port and path mismatch: Confirm that the Service Port and Metrics Collection Path values in the integration configuration match the values in
application.properties.Network connectivity: Make sure that the Prometheus scraper can reach the application. In a Kubernetes environment, verify that the pod labels in the integration configuration match the actual pod labels. In an ECS environment, check security group rules and firewall settings.
Debug logging: To enable debug-level logging for the Micrometer Prometheus registry, add the following to
application.properties: Check the application logs for scrape-related errors.logging.level.io.micrometer.prometheus=DEBUG