Managed Service for Prometheus exposes HTTP API URLs that let you query monitoring data from outside the Alibaba Cloud console. Two common use cases:
Self-managed Grafana: Add the HTTP API URL as a Prometheus data source to visualize metrics in your own Grafana instance.
Custom applications: Call the Prometheus-compatible HTTP API directly to retrieve metrics programmatically.
Authentication
Managed Service for Prometheus supports two instance versions, each with a different authentication method.
| Instance version | Authentication method | Credentials |
|---|---|---|
| Prometheus V1 | Token-based (optional) | Authentication token generated in the console |
| Prometheus V2 | Basic auth (required) | AccessKey ID and AccessKey secret of your account, and the associated RAM user must have AliyunPrometheusMetricReadAccess or AliyunCloudMonitorFullAccess permission |
For Prometheus V2, data access requires both an AccessKey ID and AccessKey secret of your account, and the associated RAM user must have the AliyunPrometheusMetricReadAccess or AliyunCloudMonitorFullAccess system permission.
Prerequisites
Before you begin, make sure that you have:
A connected Prometheus instance. For setup instructions, see:
(For Grafana) A self-managed Grafana instance with administrator access
(For Prometheus V2) An AccessKey pair for your account, and the associated RAM user must have the required permissions
Get the HTTP API URL
Log on to the CloudMonitor console.
In the left-side navigation pane, choose Managed Service for Prometheus > Instances.
In the top navigation bar, select the region where your Prometheus instance resides.
Find your Prometheus instance, and then click Settings in the Actions column.
On the Settings tab, copy the HTTP API URL.
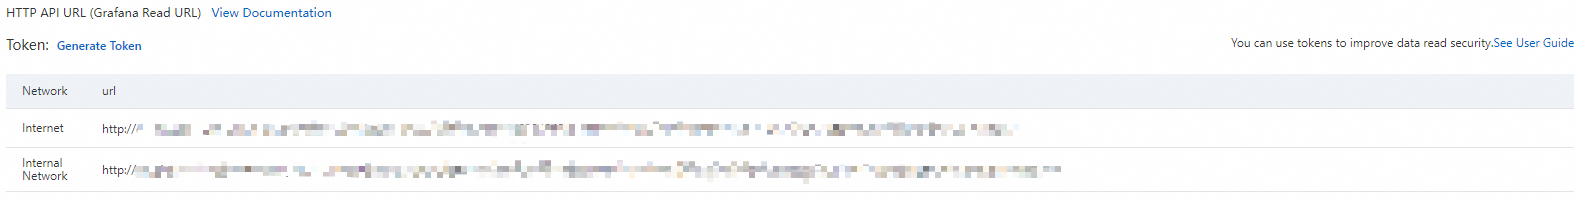
Use the public URL if your Grafana instance or application is outside the Alibaba Cloud internal network.
Use the internal URL if your Grafana instance or application runs within the same Alibaba Cloud region and can access internal endpoints.
(Prometheus V1 only) Click Generate Token to create an authentication token. Save this token for later use.
For a Prometheus V1 instance, after you generate a token, you must include it when configuring the Grafana data source. Without the token, Grafana cannot read monitoring data from the instance.
Configure a self-managed Grafana data source
Add the data source
Log on to your Grafana instance as an administrator.
Go to Connections > Data sources.
This menu is visible only to Grafana administrators. In Grafana 8 and earlier, go to Configuration > Data sources. The Connections menu is available in Grafana 9 and later.
Click + Add data source, and then select Prometheus.
In the Name field, enter a descriptive name for the data source.
In the Prometheus server URL field (under the HTTP section), paste the HTTP API URL you copied earlier.
Configure authentication
Follow the steps for your Prometheus instance version.
Prometheus V1
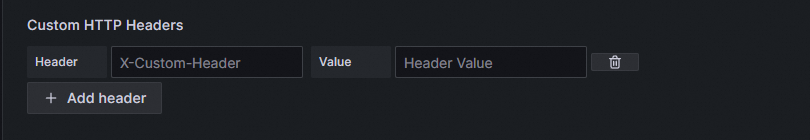
If you generated a token, add it as a custom HTTP header:
In the Custom HTTP Headers section, click + Add header.
Set Header to
Authorization.Set Value to the authentication token.
Prometheus V2
Turn on Basic auth.
Set User to your AccessKey ID.
Set Password to your AccessKey secret.

Save and test
Click Save & test. A success message confirms that Grafana can reach the Prometheus data source.
Verify the data source in Grafana
In Grafana, go to Dashboards and click New > New dashboard.
Click + Add visualization and select the data source you configured.
On the Edit Panel page, open the Query tab. In section A, enter a metric name in the Metrics field (for example,
arms_prometheus_target_interval_length_seconds_sum) and configure any Label filters as needed.Click Run queries.
If a chart renders with metric data, the data source is working. If no chart appears, check whether the API URL or token is valid and whether the data source has monitoring data. For additional help, see Troubleshooting.
Query the HTTP API programmatically
The following examples use the /api/v1/query endpoint for instant queries. For range queries (/api/v1/query_range), series metadata, and other endpoints, see the Prometheus HTTP API reference.
Prometheus V1
curl -G '<your-http-api-url>/api/v1/query' \
  -H 'Authorization: <your-token>' \
  -H 'Accept: application/json' \
  --data-urlencode 'query=arms_prometheus_target_interval_length_seconds_sum' \
  --data-urlencode 'time=1635302655' \
  --data-urlencode 'timeout=1000'
Replace the following placeholders with actual values:
| Placeholder | Description | Example |
|---|---|---|
<your-http-api-url> | The HTTP API URL from the Settings tab | https://cn-hangzhou.arms.aliyuncs.com/... |
<your-token> | The authentication token generated in the console | eyJhbGciOi... |
Prometheus V2
curl -G '<your-http-api-url>/api/v1/query' \
  -u '<your-accesskey-id>:<your-accesskey-secret>' \
  -H 'Accept: application/json' \
  --data-urlencode 'query=arms_prometheus_target_interval_length_seconds_sum' \
  --data-urlencode 'time=1635302655' \
  --data-urlencode 'timeout=1000'
Replace the following placeholders with actual values:
| Placeholder | Description | Example |
|---|---|---|
<your-http-api-url> | The HTTP API URL from the Settings tab | https://cn-hangzhou.arms.aliyuncs.com/... |
<your-accesskey-id> | The AccessKey ID of your account | LTAI5tXxx... |
<your-accesskey-secret> | The AccessKey secret of your account | xXxXxXx... |
The-uflag encodes the AccessKey ID and AccessKey secret as a Base64Authorization: Basicheader automatically.
Query parameters
| Parameter | Required | Description |
|---|---|---|
query | Yes | A PromQL expression to evaluate |
time | No | Evaluation timestamp (Unix timestamp or RFC 3339). Defaults to the current server time |
timeout | No | Evaluation timeout in milliseconds |
Troubleshooting
| Symptom | Possible cause | Solution |
|---|---|---|
| HTTP 401 Unauthorized | Invalid or missing credentials | Verify the token (V1) or AccessKey pair (V2). Regenerate if expired. |
| HTTP 403 Forbidden | Insufficient permissions | Grant the RAM user AliyunPrometheusMetricReadAccess or AliyunCloudMonitorFullAccess. |
| Connection timeout | Network unreachable | If Grafana runs outside Alibaba Cloud, use the public HTTP API URL. If it runs inside the same region, use the internal URL. |
| No data in Grafana chart | No ingested data for the queried metric | Confirm that the Prometheus instance is actively scraping targets and the metric name is correct. |
Related topics
Prometheus HTTP API reference -- Full API documentation for query endpoints including range queries (
/api/v1/query_range), label queries, and series metadataCreate a Grafana dashboard -- Build dashboards with the connected data source