This topic describes how to use the Pushgateway feature provided by Managed Service for Prometheus to push metric data.
Overview
If the Prometheus server cannot pull data from your data source on a regular basis (for example, in an environment where no stable network connection is available), you can use Pushgateway to push data. After metric data is sent from your data source to Pushgateway, the Prometheus server periodically obtains the metric data. To implement this, perform the following steps:
Obtain the Pushgateway endpoint: Obtain the Pushgateway endpoint in the Managed Service for Prometheus console.
Report data: You can run the curl command or use an open source Pushgateway SDK to push metric data. This ensures that metric data can be collected and monitored by Managed Service for Prometheus in a timely and reliable manner.
Configure data protection (optional): The standard Pushgateway protocol does not contain content related to data protection. The Pushgateway SDK provides only basic authentication and does not provide more advanced and general authentication. This means that any client can push data once it obtains the Pushgateway endpoint. To ensure data security, you can obtain a token in the Managed Service for Prometheus console to implement the standard JSON web token (JWT) authentication protocol.

Prerequisites
A Prometheus instance is created. For more information, see the following topics:
Step 1: Obtain the Pushgateway endpoint
Log on to the Cloud Monitor console. In the left navigation pane, choose . The Instances page appears.
In the upper part of the instance list, select the region where your Prometheus instance resides. Click Settings in the Actions column of the instance.
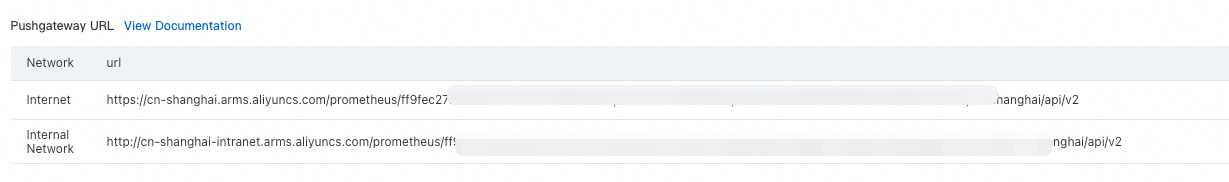
On the Settings tab, obtain the public URL in the Pushgateway URL section.
Step 2: Report data
Prometheus V1
Use an open source Pushgateway SDK to push metric data
Only the Text Format and Protobuf Delimited specifications are supported. The Protobuf Text, Protobuf Compact Text, and OpenMetrics specifications are not supported. By default, the Pushgateway SDK is used with Protobuf Delimited.
The
Helpfield in the metadata does not support Chinese characters. If Chinese characters are passed, data reporting fails.
This topic describes how to use Pushgateway SDK for Go and Pushgateway SDK for Java to push metric data.
Pushgateway SDK for Go:
completionTime := prometheus.NewGauge(prometheus.GaugeOpts{
    Name: "db_backup_last_completion_timestamp_seconds",
    Help: "The timestamp of the last successful completion of a DB backup.",
})
completionTime.SetToCurrentTime()
url :   = "https://cn-hangzhou.arms.aliyuncs.com/prometheus/52b12ea9cf4bb9e35****/16727530178****/1df8lj***/cn-hangzhou/api/v2"
pusher := push.New(url, "test").
    Collector(completionTime).Client(http.DefaultClient).
    Grouping("key1", "test1").Grouping("key2", "dfdf/sdsd/").
    Format(expfmt.FmtProtoDelim)
if err := pusher.Push(); err != nil {
    fmt.Println("Could not push completion time to PushGateway: ", err)
}
Pushgateway SDK for Java:
CollectorRegistry registry = new CollectorRegistry();
Gauge duration = Gauge.build()
        .name("my_batch_job_duration_seconds").help("Duration of my batch job in seconds.").register(registry);
Gauge.Timer durationTimer = duration.startTimer();
try {
    // Your code here.

    // This is only added to the registry after success,
    // so that a previous success in the Pushgateway isn't overwritten on failure.
    Gauge lastSuccess = Gauge.build()
            .name("my_batch_job_last_success").help("Last time my batch job succeeded, in unixtime.").register(registry);
    lastSuccess.setToCurrentTime();
} finally {
    durationTimer.setDuration();
    PushGateway pg = new PushGateway(new URL("https://cn-hangzhou.arms.aliyuncs.com/prometheus/52b12ea9cf4bb9e35****/16727530178****/1df8lj***/cn-hangzhou/api/v2"));
    pg.pushAdd(registry, "my_batch_job");
}When you use an open source Pushgateway SDK, enter the Pushgateway endpoint obtained from the Managed Service for Prometheus console. The system automatically creates a suffix similar to
/metrics/job/<JOB_NAME>{/<LABEL_NAME>/<LABEL_VALUE>}. If you are not using an open source Pushgateway SDK, you must manually create the suffix. Otherwise, a 404 error is returned.If you need to push metric data to a cluster that is shared by multiple tenants and monitored by Managed Service for Prometheus, attach the
tenant_userid=****tag to the metrics. The tag value is used to distinguish the relationships between the metrics. Set the tag value to the ID of the Alibaba Cloud account to which the metrics belong.
Run the curl command to push metric data
Requests of the application/x-www-form-urlencoded type are not supported. In the curl command, you must add a header to specify Content-Type: text/plain; version=0.0.4; charset=utf-8.
echo "some_metric 3.14" | curl -H "Content-Type: text/plain; version=0.0.4; charset=utf-8" --data-binary @- https://cn-hangzhou.arms.aliyuncs.com/prometheus/51bbea9ck41b9e35****/16727530178****/1df8lj***/cn-hangzhou/api/v2/metrics/job/job_name/label_key_1/label_value_1/label_key_2/label_value_2You can append multiple labels to the end of the URL, but you need to pay attention to the overall length of the URL.
Replace
job_namein the URL with the actual job name.
Configure data protection (optional)
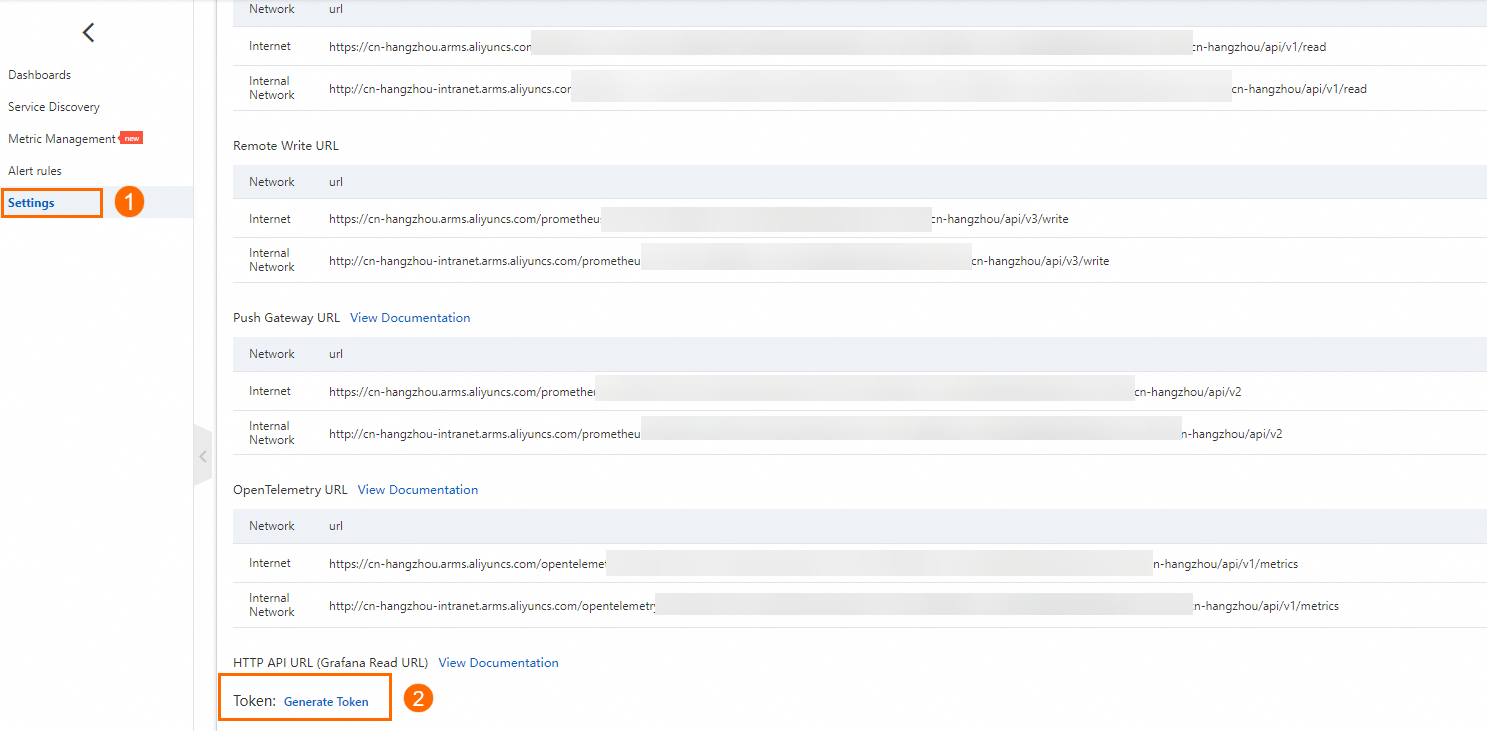
Obtain a token: In the left-side navigation pane, click Settings. On the Settings tab, click Generate Token in the Token section.
Pass the token: After a token is generated, you can view the value of the token. You can use one of the following methods to pass the token:
Method 1: Add the token to the request header of the client request. Then, you can push metric data. Otherwise, the system rejects data writes. The following figure shows how to add the token to the request header of the client request.

Method 2: The Pushgateway SDK supports only basic authentication and does not support JWT authentication. If you want to use the Pushgateway SDK and implement advanced authentication at the same time, you can use the BasicAuth interface and set the Password field to the token value. The service side is compatible with the authentication method. Method 1 may increase your development cost. In this example, Pushgateway SDK for Go is used.
pusher := push.New(url, "test").
        Collector(completionTime).Client(http.DefaultClient).
        Grouping("key1", "test1").Grouping("key2", "dfdf/sdsd/").
        .BasicAuth("admin", "Token value").
        Format(expfmt.FmtProtoDelim)
Prometheus V2
1. Grant a RAM user read and write permissions on Cloud Monitor
If your Prometheus instance is created by using an Alibaba Cloud account and you want to use the AccessKey ID and AccessKey secret of a Resource Access Management (RAM) user to perform remote read and write operations, you must first grant the RAM user read and write permissions on Cloud Monitor.
Log on to the RAM console as a RAM administrator or with an Alibaba Cloud account. In the left navigation pane, choose .
On the Permission page, click Grant Permission. In the panel that appears, set the parameters listed in the following table.
Parameter
Description
Resource Scope
Set this parameter based on your business requirements.
Principal
The RAM user.
Policy
Select AliyunPrometheusMetricWriteAccess or AliyunCloudMonitorFullAccess.
Click Grant permissions, and click Close.
2. Push data
Use an open source Pushgateway SDK to push metric data
Only the Text Format and Protobuf Delimited specifications are supported. The Protobuf Text, Protobuf Compact Text, and OpenMetrics specifications are not supported. By default, the Pushgateway SDK is used with Protobuf Delimited.
The
Helpfield in the metadata does not support Chinese characters. If Chinese characters are passed, data reporting fails.
This topic describes how to use Pushgateway SDK for Go and Pushgateway SDK for Java to push metric data.
Pushgateway SDK for Go:
completionTime := prometheus.NewGauge(prometheus.GaugeOpts{
    Name: "db_backup_last_completion_timestamp_seconds",
    Help: "The timestamp of the last successful completion of a DB backup.",
})
completionTime.SetToCurrentTime()
url :   = "https://k8s-log-c8b5d0a212ffa41cxxxx.cn-hangzhou.log.aliyuncs.com/prometheus/k8s-log-c8b5d0a212ffa41c0a5xxxx/aliyun-prom-c8b5d0a212ffa41c0xxxx/api/v1/pushgateway"
pusher := push.New(url, "test").
    Collector(completionTime).Client(http.DefaultClient).
    Grouping("key1", "test1").Grouping("key2", "dfdf/sdsd/").
    BasicAuth("ak", "sk").
    Format(expfmt.FmtProtoDelim)
if err := pusher.Push(); err != nil {
    fmt.Println("Could not push completion time to PushGateway: ", err)
}
Pushgateway SDK for Java:
CollectorRegistry registry = new CollectorRegistry();
Gauge duration = Gauge.build()
        .name("my_batch_job_duration_seconds").help("Duration of my batch job in seconds.").register(registry);
Gauge.Timer durationTimer = duration.startTimer();
try {
    // Your code here.

    // This is only added to the registry after success,
    // so that a previous success in the Pushgateway isn't overwritten on failure.
    Gauge lastSuccess = Gauge.build()
            .name("my_batch_job_last_success").help("Last time my batch job succeeded, in unixtime.").register(registry);
    lastSuccess.setToCurrentTime();
} finally {
    durationTimer.setDuration();
    PushGateway pg = new PushGateway(new URL("https://k8s-log-c8b5d0a212ffa41cxxxx.cn-hangzhou.log.aliyuncs.com/prometheus/k8s-log-c8b5d0a212ffa41c0a5xxxx/aliyun-prom-c8b5d0a212ffa41c0xxxx/api/v1/pushgateway"));
    pg.setConnectionFactory(new BasicAuthHttpConnectionFactory("ak", "sk"));
    pg.pushAdd(registry, "my_batch_job");
}When you use an open source Pushgateway SDK, enter the Pushgateway endpoint obtained from the Managed Service for Prometheus console. The system automatically creates a suffix similar to
/metrics/job/<JOB_NAME>{/<LABEL_NAME>/<LABEL_VALUE>}. If you are not using an open source Pushgateway SDK, you must manually create the suffix. Otherwise, a 404 error is returned.If you need to push metric data to a cluster that is shared by multiple tenants and monitored by Managed Service for Prometheus, attach the
tenant_userid=****tag to the metrics. The tag value is used to distinguish the relationships between the metrics. Set the tag value to the ID of the Alibaba Cloud account to which the metrics belong.The API supports Security Token Service (STS) authentication. In this case, the
PasswordinBasicAuthis in the{AccessKey Secret}${STS Token}format.
Run the curl command to push metric data
Requests of the application/x-www-form-urlencoded type are not supported. In the curl command, you must add a header to specify Content-Type: text/plain; version=0.0.4; charset=utf-8.
echo "some_metric 3.14" | curl -H "Content-Type: text/plain; version=0.0.4; charset=utf-8" --data-binary @- https://cn-hangzhou.arms.aliyuncs.com/prometheus/51bbea9ck41b9e35****/16727530178****/1df8lj***/cn-hangzhou/api/v2/metrics/job/job_name/label_key_1/label_value_1/label_key_2/label_value_2You can append multiple labels to the end of the URL, but you need to pay attention to the overall length of the URL.
Replace
job_namein the URL with the actual job name.
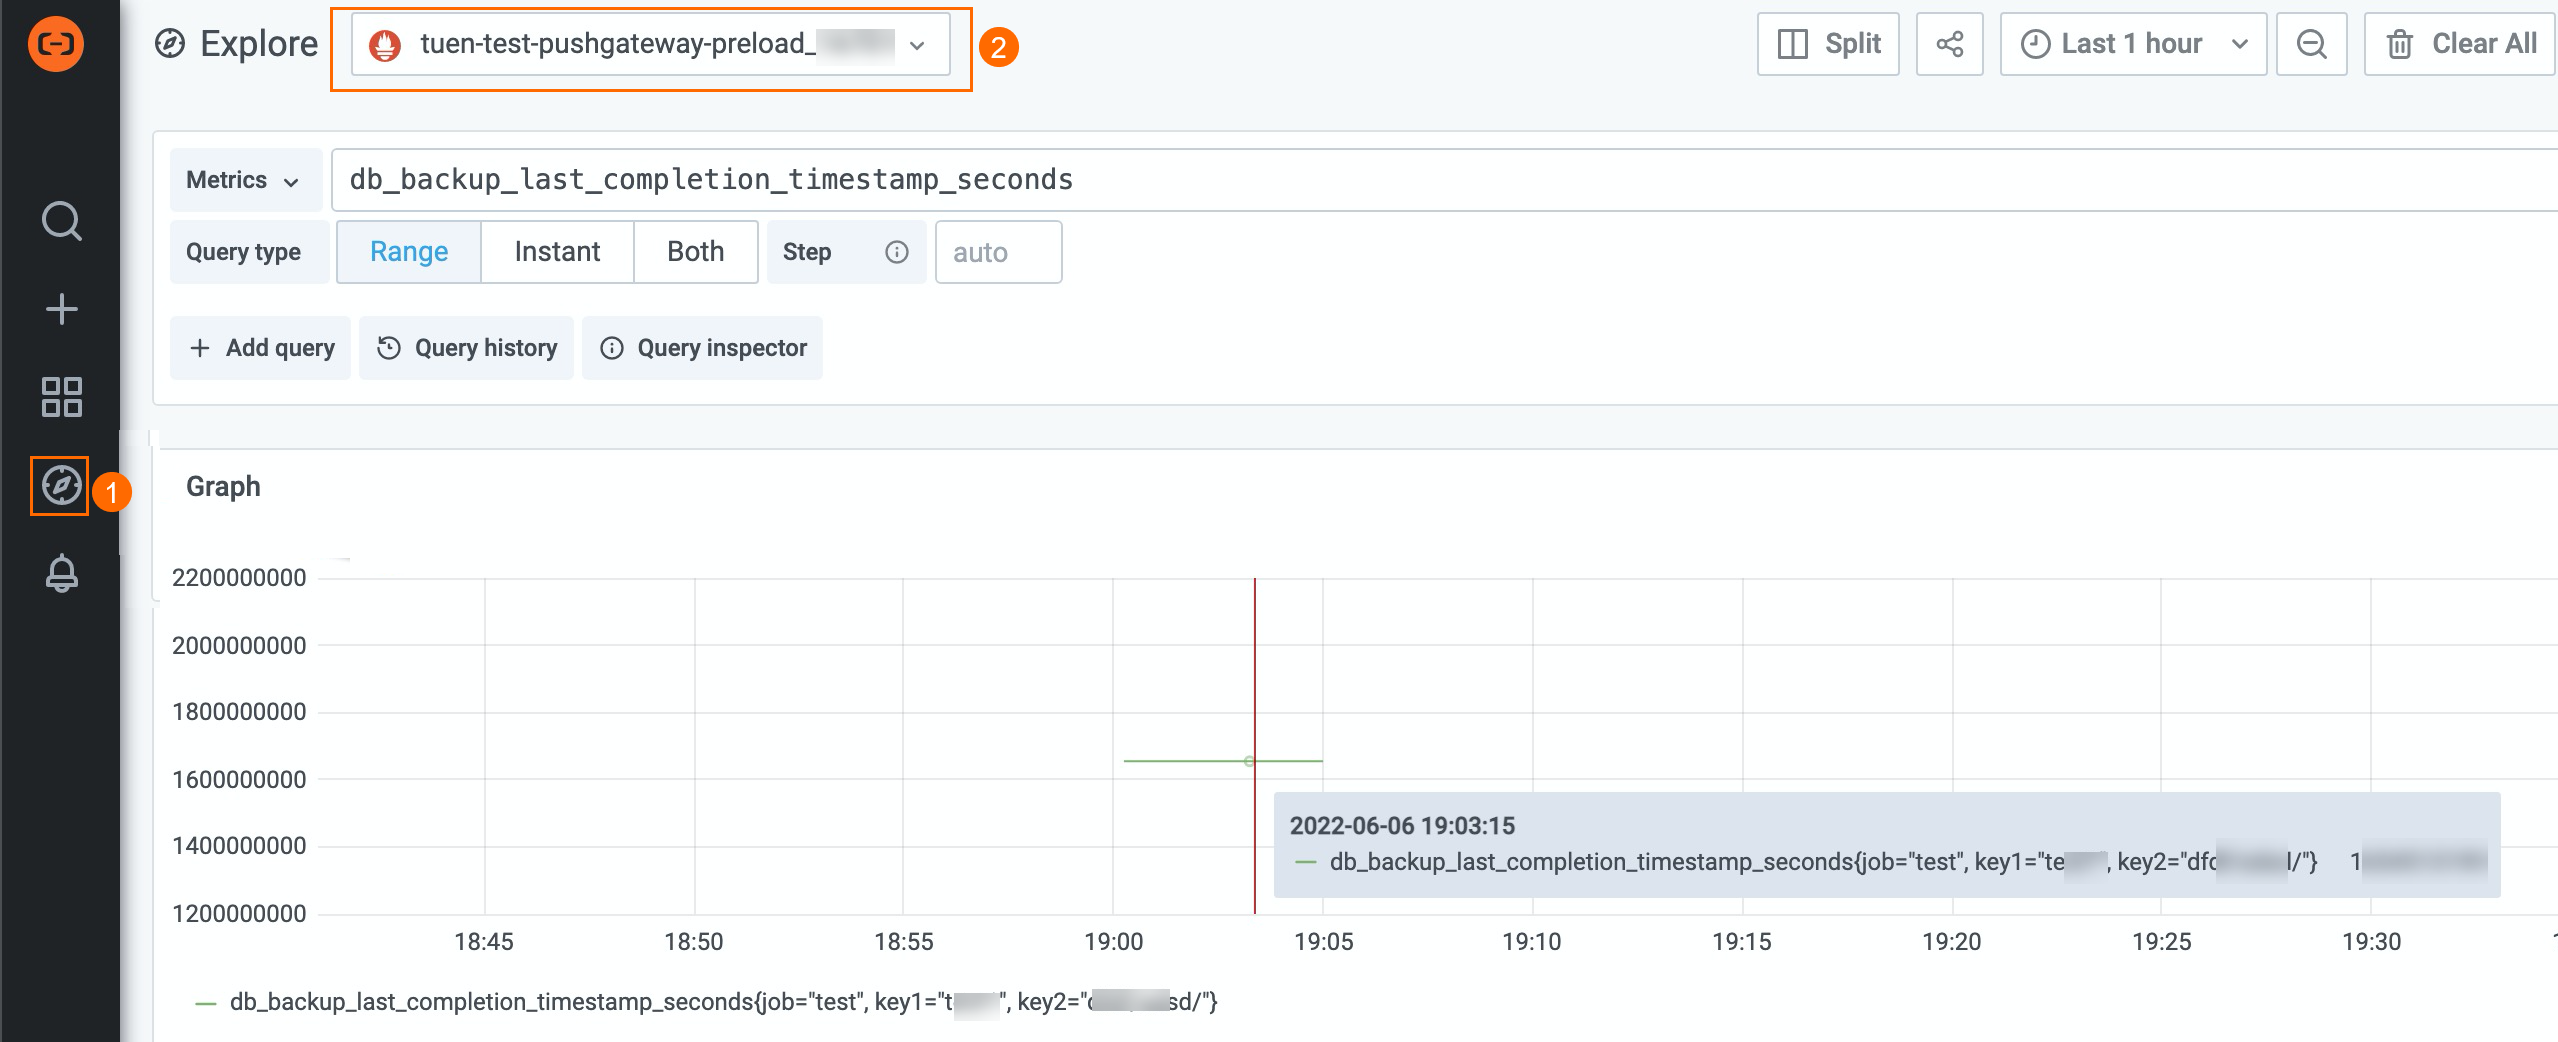
Verify the result
You can use Grafana to check whether metric data is pushed.
Go to the ApiServer dashboard: In the left-side navigation pane, click Dashboards. On the Dashboards page, click ApiServer.
View data on the Explore page: In the left-side navigation pane, move the pointer over the
 icon (1 in the figure) and click Explore. On the Explore page, select your resource from the Explore drop-down list (2 in the figure) to check whether metric data is pushed.