This topic describes how to create and manage alert rules in Alibaba Cloud Managed Service for Prometheus.
Background information
A PrometheusRule is the Custom Resource Definition (CRD) used to manage alerts in Prometheus Operator. A PrometheusRule defines a set of Prometheus alert rules or recording rules. In a Kubernetes cluster with Prometheus Operator installed, you can create a PrometheusRule to create alert rules. As an implementation of Monitoring as Code (MaC), PrometheusRule is suitable for building GitOps R&D and O&M systems.
In Managed Service for Prometheus, you can also use a PrometheusRule to create and manage alert rules. Managed Service for Prometheus allows you to manage alerts for Prometheus instances on an interactive and visualized interface. You can also create and manage alerts by using PrometheusRule in Prometheus Operator.
Usage notes
Managed Service for Prometheus supports the following methods for creating and manage alert rules:
Method 1: Import a PrometheusRule as an alert rule template to create or update multiple alerts in a visualized manner. This method is suitable for users who are accustomed to using graphical user interfaces (GUIs). You can efficiently manage a large number of alert rules in the Managed Service for Prometheus console. For more information, see Method 1: Import a PrometheusRule as an alert rule template.
Method 2: Enable the Prometheus agent to automatically synchronize PrometheusRule rules. This way, you can use open source alert configurations. This method is suitable for users who are accustomed to building open source MaC-based O&M systems. For more information, see Method 2: Enable the Prometheus agent to synchronize PrometheusRule alert rules.
By default, Managed Service for Prometheus does not read PrometheusRule rules from Kubernetes clusters. You can use one of the preceding methods to create and manage alert rules based on your business requirements.
Method 1: Import a PrometheusRule as an alert rule template
Benefits
Managed Service for Prometheus provides alert rule templates to increase the efficiency of alert configurations in multiple regions and clusters. For more information, see Create and manage an alert rule template. An alert rule template can be repeatedly applied to different clusters worldwide. This greatly reduces the alert configuration workload and improves the configuration efficiency.
Managed Service for Prometheus allows you to import a PrometheusRule as an alert template and then apply the alert template to multiple clusters. This way, you do not need to create PrometheusRule for each cluster. To import a PrometheusRule as an alert rule template, perform the following steps:
Procedure
Log on to the Managed Service for Prometheus console.
In the left-side navigation pane, click Alert Rule Template.
On the Prometheus Alert Rule Templates page, click Import Templates.
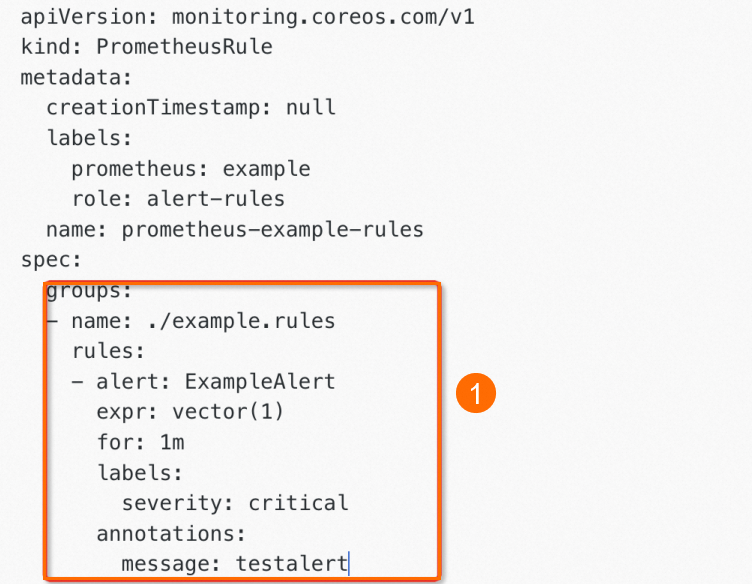
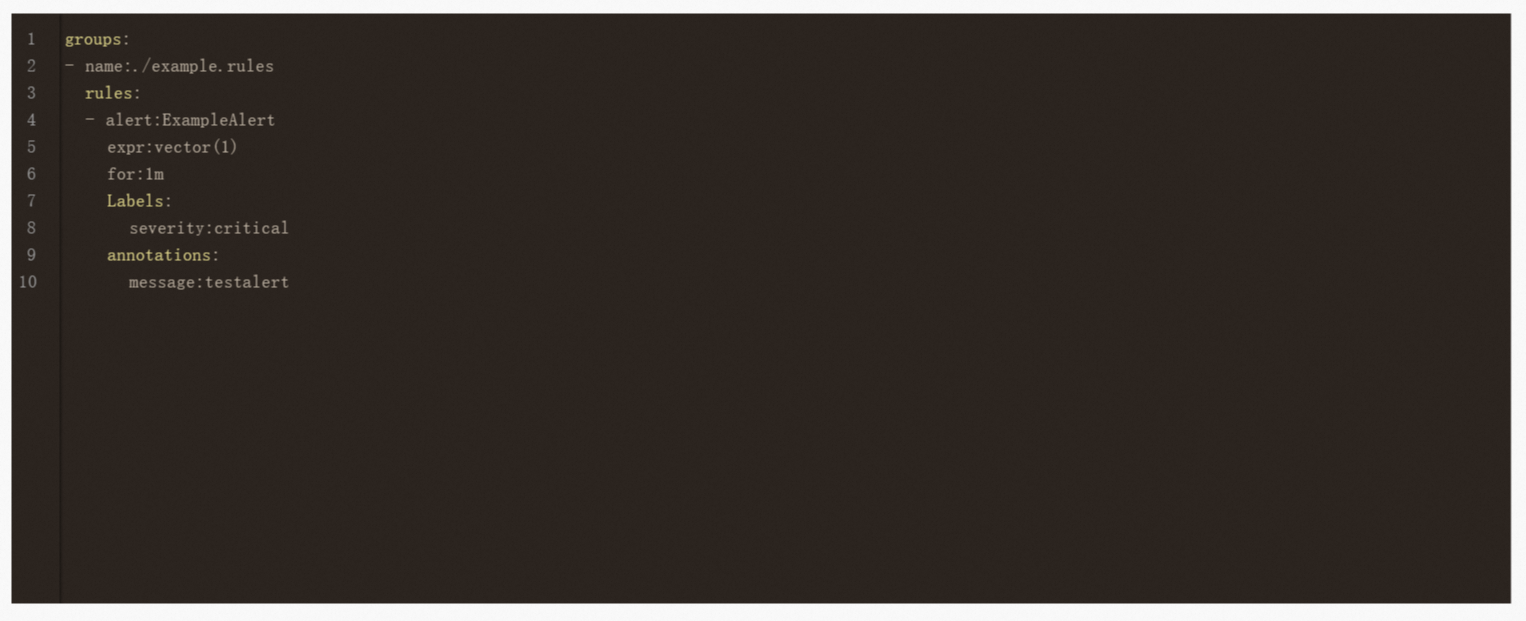
In the Import dialog box, paste the spec content of the PrometheusRule, and then click Import Alert Rule Template.
The following figure shows the spec content (Icon 1) in the sample PrometheusRule.

Paste the preceding spec content (Icon 1) to the Import dialog box, and then click Import Alert Rule Template, as shown in the following figure.

After the alert rule template is imported, you must click Apply Templates on the Prometheus Alert Rule Templates page to apply the template to multiple Prometheus instances.
Method 2: Enable the Prometheus agent to synchronize PrometheusRule alert rules
Scenarios
You want to use MaC to configure alert rules in systems such as GitOps.
Use PrometheusRule to create alert rules for Container Service for Kubernetes (ACK) clusters monitored in Managed Service for Prometheus. In this case, you need to set the alert parameter of the Prometheus agent to true.
Procedure
Log on to the ACK console. In the navigation pane on the left, click Clusters.
On the Clusters page, find the cluster that you want to manage and click Applications in the Actions column.
On the Deployments page, select arms-prom from the Namespace drop-down list. Find the Deployment whose name starts with arms-prometheus in the Name column, for example, arms-prometheus-ack-arms-prometheus. Then, click Edit in the Actions column.

In the Lifecycle section of the Edit page, set the Parameter field of the Start parameter. In the Parameter field, enter
--alert=true. Then, in the upper-right corner of the Edit page, click Update.
After the Prometheus agent is updated, wait for 3 to 5 minutes. Then, on the View Alert Rules page in the Managed Service for Prometheus console, all alerts are in the Running state.
If PrometheusRule is enabled for your cluster, we recommend that you do not modify the synchronized alert rules in the Managed Service for Prometheus console. This often results in unexpected consequences. For example, you may be unable to modify an alert rule name or delete an alert rule. The MaC mechanism may also be compromised. In this case, the modified rules cannot be synchronized to external O&M systems such as GitOps.
What to do next
After you enable the alert option of the Prometheus agent, Managed Service for Prometheus creates a set of built-in alert rules in the arms-prom namespace, as shown in the following figure. For more information about the built-in alert rules, see Description of alert rules.
You can modify the defaultAlert parameter to disable the built-in alert rules of the Prometheus agent. Perform the following steps:
Managed Service for Prometheus provides the defaultAlert parameter that allows you to specify whether Managed Service for Prometheus automatically creates default alert rules. If this parameter is set to true, Managed Service for Prometheus automatically creates default alert rules. If this parameter is set to false, Managed Service for Prometheus does not automatically create default alert rules.
Set the
defaultAlertparameter of the Prometheus agent tofalse.Log on to the ACK console. In the navigation pane on the left, click Clusters.
On the Clusters page, find the cluster that you want to manage and click Applications in the Actions column.
On the Deployments page, select arms-prom from the Namespace drop-down list. Find the Deployment whose name starts with arms-prom in the Name column. Then, click Edit (Icon: 2) in the Actions column.
In the Lifecycle section of the Edit page, set the Parameter field of the Start parameter. In the Parameter field, enter
--defaultAlert=false. Then, in the upper-right corner of the Edit page, click Update.
NoteAfter the Prometheus agent is updated, wait for 3 to 5 minutes. Managed Service for Prometheus no longer creates default alert rules for the cluster.
Optional: Delete a default alert rule.
Log on to the Managed Service for Prometheus console.
In the left-side navigation pane, click Instances.
Click the name of the Prometheus instance that monitors the Kubernetes cluster.
In the left-side navigation pane, click Alert rules. On the Prometheus Alert Rules page, find the alert rule that you want to delete and click Delete in the Actions column. In the message that appears, click OK.