This topic describes how to configure Micrometer for a Java application and use Alibaba Cloud Managed Service for Prometheus to monitor the application.
Prerequisite
A Java application is created.
Step 1: Configure Micrometer for the application
A Spring Boot 2.x application is used as an example.
In the pom.xml file of the project where the Java application resides, add the dependency of Spring Boot Actuator.
<dependency> <groupId>org.springframework.boot</groupId> <artifactId>spring-boot-starter-actuator</artifactId> <verson>x.y.x</version> </dependency>NoteTo obtain the latest Maven project version, visit the Alibaba Cloud repository.
Configure Spring Boot Actuator and add related configurations to the application.properties file to expose the port and endpoint that provide the monitoring data.
management.server.port=8080
management.endpoints.web.exposure.include=xxx, prometheus
Add the Micrometer dependency to the pom.xml file of the Maven project.
<dependency> <groupId>io.micrometer</groupId> <artifactId>micrometer-registry-prometheus</artifactId> <version>x.y.z</version> </dependency>NoteTo obtain the latest Maven project version, visit the Alibaba Cloud repository.
Add the Micrometer JVM Extras dependency to the pom.xml file.
<dependency> <groupId>io.github.mweirauch</groupId> <artifactId>micrometer-jvm-extras</artifactId> <version>0.2.2</version> </dependency>NoteTo obtain the latest Maven project version, visit the Alibaba Cloud repository.
Configure Micrometer JVM Extras. Add the following Spring beans to expose memory and thread metrics.
/* With Spring */
@Bean
public MeterBinder processMemoryMetrics() {
    return new ProcessMemoryMetrics();
}

@Bean
public MeterBinder processThreadMetrics() {
    return new ProcessThreadMetrics();
}
Deploy the application in an Alibaba Cloud Container Service for Kubernetes (ACK) cluster or an Elastic Compute Service (ECS) instance.
Then, access the endpoint that provides the monitoring data and check whether the metrics are exposed. Sample endpoint:
http://localhost:8080/actuator/prometheus. Port 8080 is used as an example. Replace port 8080 with the port number configured in the application.properties file.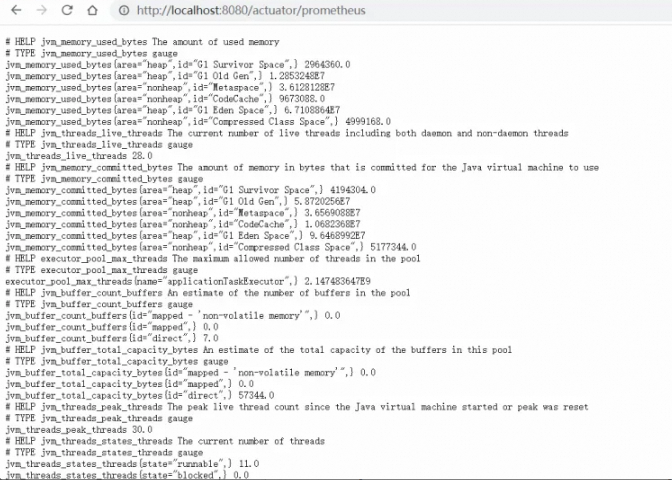
Step 2: Enable the Micrometer component
Log on to the Managed Service for Prometheus console. In the left-side navigation pane, click Integration Center. On the page that appears, search for the Micrometer component.

On the Start Integration tab of the MicroMeter panel, configure the parameters and click OK.
Parameter
Description
Select the environment type
The environment in which the application is deployed. Valid values:
Kubernetes Environment
ECS(VPC)
Select a Kubernetes cluster
The ACK cluster in which the application is deployed. The parameter is available if the application is deployed in an ACK cluster.
Labels
The labels of the pod where Micrometer is deployed. We recommend that you use meaningful labels.
Service Port
The port of the application. The default port number is automatically filled in.
Metrics Collection Path
The endpoint that exposes the metrics. The default endpoint is automatically filled in.
Use HTTPS to Collect Data
By default, metric data is collected through the HTTP protocol. If you want to use HTTPS, turn on the switch.
Metric Scrape interval (unit/second)
The interval at which metric data is collected. Default value: 30.
Step 3: View the dashboards
Log on to the Managed Service for Prometheus console. In the left-side navigation pane, click Integration Management. On the Integrated Environments tab of the Integration Management page, click the name of the environment.

In the Addon Type section of the Component Management tab, click MicroMeter. Then, click Dashboards to view all the dashboard names.
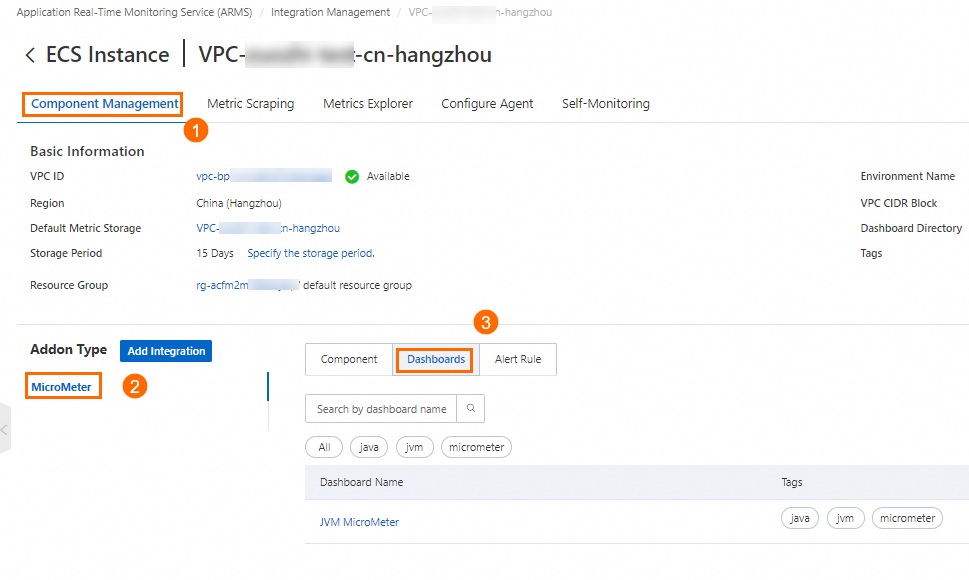
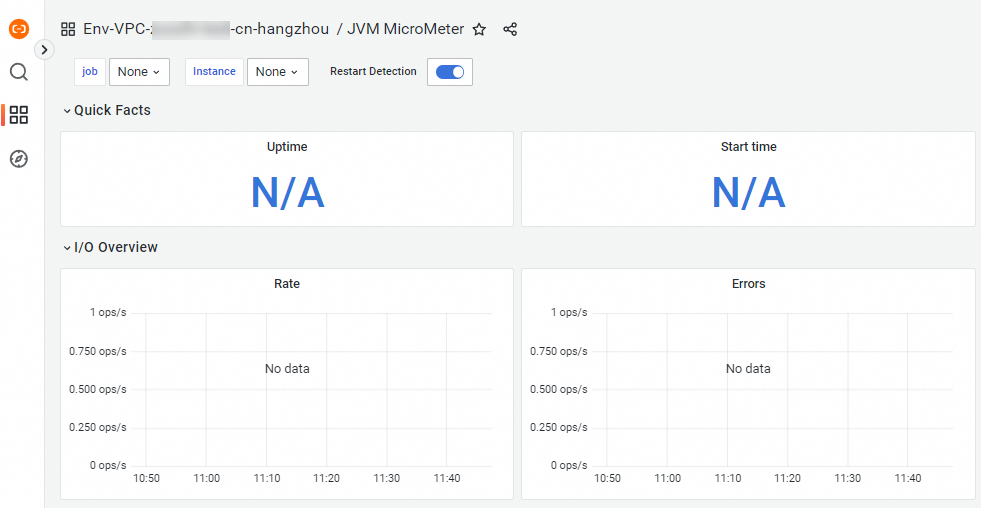
Click the name of a dashboard.
Step 4: Configure alerting
In the Addon Type section of the Component Management tab, click MicroMeter. Then, click Alert Rule to view all the default alert rules.
You can create alert rules based on your business requirements. For information about how to create Prometheus alert rules, see Create an alert rule for a Prometheus instance.