Alibaba Cloud Managed Service for Prometheus allows you to use the Node Exporter to collect metrics from an Elastic Compute Service (ECS) instance that runs Linux or Windows, and use the Process Exporter to collect monitoring data of the processes. You can also collect custom metrics that are configured in text files.
Prerequisites
Managed Service for Prometheus is activated. For more information, see Instance billing.
An ECS instance is created. For more information, see Create and manage an ECS instance by using the ECS console (express version).
Alibaba Cloud Resource Center is activated. For more information, see Activate Resource Center.
Benefits
Managed Service for Prometheus provides an efficient and easy-to-manage monitoring solution for ECS instances. This solution meets the needs for observability and automated management in modern cloud computing environments.
The host monitoring solution provided by Managed Service for Prometheus allows you to integrate ECS instances, servers in self-managed data centers, and servers from third-party cloud service providers into Managed Service for Prometheus for monitoring. The host monitoring feature can automatically install different types of open source exporters and issue collection configurations for your ECS instances. Managed Prometheus agents can be used for automatic data collection. The collected data are stored and displayed and alert rules are managed in a centralized manner. The automatic service discovery mechanism does not apply to third-party hosts. If you use a third-party host, you must manually install an Alibaba Cloud data collection agent when you integrate the third-party host into Managed Service for Prometheus. This way, monitoring data can be sent to Managed Service for Prometheus for storage.
Benefit | Description |
Host discovery in seconds |
|
Exporter installation in seconds |
|
Metric collection in seconds |
After you create an ECS instance, the ECS instance can be included in the monitoring system within 30 to 60 seconds. The interval at which all metrics of ECS instances are monitored can be flexibly adjusted from 1 to 60 seconds. This helps implement all-around monitoring of ECS instances within seconds. |
Serverless agents |
|
Smart metric tags |
|
Ultra-large-scale data collection and storage |
|
Comprehensive monitoring data from upstream and downstream applications |
|
Process-level monitoring |
|
Grafana dashboards |
|
Step 1: Integrate the ECS instances
Log on to the ARMS console. In the left-side navigation pane, click Integration Center.
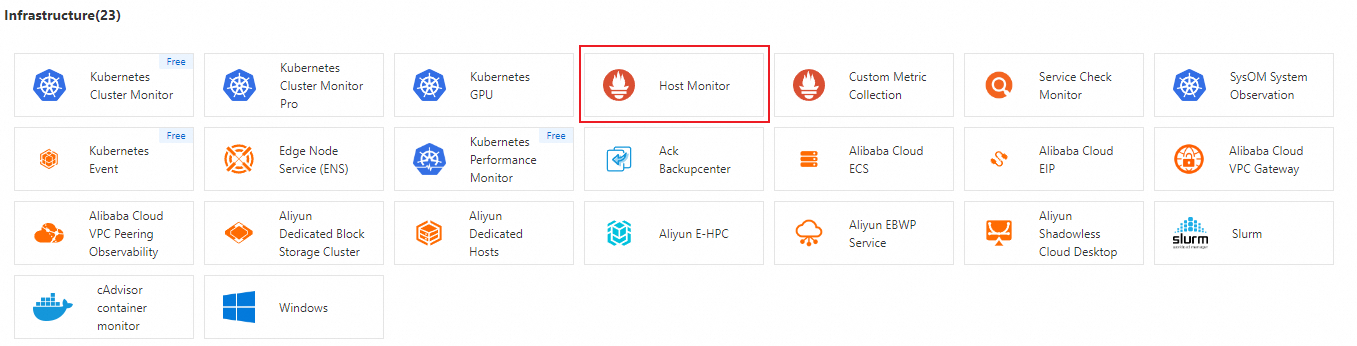
In the left-side navigation pane of the Integration Center page, click Infrastructure and then click Host Monitor.
 Note
NoteManaged Service for Prometheus relies on Resource Center to obtain the data of resources such as virtual private clouds (VPCs) and ECS instances within the current Alibaba Cloud account. If you have not activated Resource Center, you must activate it as prompted. For more information, see Activate Resource Center.
The activation of Resource Center is an asynchronous operation. If the ARMS console still prompts that Resource Center is still not activated, wait for 10 to 20 seconds and then click Redetect again.
In the panel that appears, select a VPC and specify the parameters in the Configuration Information section. The following table describes the parameters.
Parameter
Description
NodeExporter Installation Mode
Automatic Installation(recommended): Managed Service for Prometheus automatically installs the Node Exporter for the ECS instance that you select.
Self Installation: You must manually install the Node Exporter.
Host Service Discovery Mode
Stain Label Selection: the blacklist mode. Specify the ECS instances that you do not want to integrate into Managed Service for Prometheus. The data of ECS instances that are not matched is collected.
Unconditional: Collect metrics from all ECS instances in the VPC.
Tag Label Selection: the whitelist mode. Specify the ECS instances that you want to integrate into Managed Service for Prometheus. The data of ECS instances that are not matched is not collected.
IP CIDR: Specify a CIDR block. If the IP address of an ECS instance is matched, the data of the instance is collected. If you specify the CIDR block of the VPC, the data of all ECS instances in the current VPC is collected.
Instance ID: Specify the IDs of ECS instances that you want to integrate. Separate multiple instance IDs with commas (,).
ECS Stain Label
Each taint consists of a key and a value. You can configure multiple taints.
Collect TextFile
Specify a text file from which metrics are collected.
Collect Process Status Metrics
By default, the process data of each ECS instance is collected.
Node-Exporter Service Port
Default value: 9100.
Metric Scrape interval (unit/second)
The interval at which data is collected. Unit: seconds. Default value: 15.
Security Groups Are Automatically Configured
By default, the switch is turned on.
Custom ECS Tag Injection
An ECS tag key for automatically injecting the corresponding key-value pair into Managed Service for Prometheus metrics.
Click OK. Wait for about 1 to 2 minutes before the ECS instance metrics are integrated.
If no data is displayed in the dashboards after the integration is complete, make sure that the security groups of the ECS instances allow inbound access to the 9100 and 9256 ports from the 100.64.0.0/10 and 192.168.0.0/18 CIDR blocks. For more information, see Search for security groups. 9100 is the default port of each Node Exporter and 9256 is the default port of each Process Exporter. You can adjust the specific ports based on your needs.
Step 2: View the dashboards
In the left-side navigation pane, click Integration Management.
On the Integrated Environments tab of the Integration Management page, click ECS Instance.
On the ECS Instance tab, click the name of the environment instance.
In the Addon Type section of the Component Management tab, click Dashboards to view the built-in Grafana dashboard.
Step 3: Configure alerting
Log on to the Managed Service for Prometheus console. In the left-side navigation pane, click Integration Management.
On the Integrated Environments tab of the Integration Management page, click ECS Instance.
On the ECS Instance tab, click the name of the environment instance.
In the Addon Type section of the Component Management tab, click Alert Rule to view the built-in alert rules.
The built-in alert rules generate alert events without sending alert notifications. If you want to send alert notifications by using emails or other channels, click Edit to configure the notification methods. On the Edit Prometheus Alert Rules page, you can specify custom alert thresholds, duration, and alert content. For more information, see Create an alert rule for a Prometheus instance.
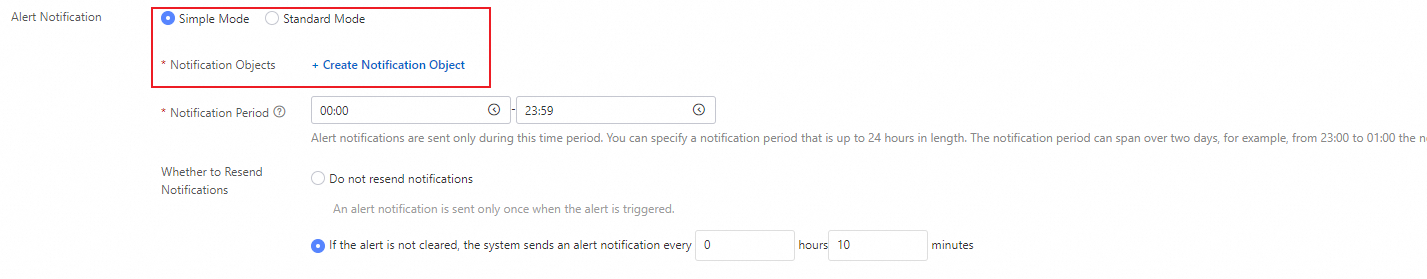
If you set the Alert Notification parameter to Simple Mode, you can configure the contacts that receive alert notifications and the notification period, and specify whether alert notifications are repeatedly sent.