You can connect Spring Boot applications to Managed Service for Prometheus for continuous health and performance monitoring. This topic describes how to quickly set up this integration.
Background information
Traditional SSM-based MVC applications require extensive configuration, where a minor error can cause failures. Spring Boot solves this with auto-configuration: if the necessary JAR packages are present, Spring Boot automatically configures the application. You can also replace auto-configuration classes with custom configurations to rapidly build enterprise-grade applications.
A comprehensive monitoring system for Spring Boot applications typically consists of the following key components.
Collect monitoring data
The most common methods for collecting monitoring data are the push and pull models. The Prometheus monitoring ecosystem is a prime example of a pull-based system. Managed Service for Prometheus is a typical pull-based system. Applications and infrastructure expose monitoring data through an OpenMetrics-compliant interface, and Managed Service for Prometheus periodically scrapes this data for long-term storage.
OpenMetrics is a cloud-native, highly scalable metric protocol that defines the standard for reporting cloud-native metrics at scale. It supports both text representation and Protocol Buffers. The text-based format is more common and is the default protocol that Managed Service for Prometheus uses for data scraping. The following example shows the metric representation format based on OpenMetrics.
# TYPE acme_http_router_request_seconds summary
# UNIT acme_http_router_request_seconds seconds
# HELP acme_http_router_request_seconds Latency though all of ACME's HTTP request router.
acme_http_router_request_seconds_sum{path="/api/v1",method="GET"} 9036.32
acme_http_router_request_seconds_count{path="/api/v1",method="GET"} 807283.0
acme_http_router_request_seconds_created{path="/api/v1",method="GET"} 1605281325.0
acme_http_router_request_seconds_sum{path="/api/v2",method="POST"} 479.3
acme_http_router_request_seconds_count{path="/api/v2",method="POST"} 34.0
acme_http_router_request_seconds_created{path="/api/v2",method="POST"} 1605281325.0
# TYPE go_goroutines gauge
# HELP go_goroutines Number of goroutines that currently exist.
go_goroutines 69
# TYPE process_cpu_seconds counter
# UNIT process_cpu_seconds seconds
# HELP process_cpu_seconds Total user and system CPU time spent in seconds.
process_cpu_seconds_total 4.20072246e+06
# EOFThe data model for a metric is defined by a metric name and a set of key-value pairs called labels. Data points with the same metric name and labels belong to the same time series. For example, acme_http_router_request_seconds_sum{path="/api/v1",method="GET"} represents a data sample for the metric named acme_http_router_request_seconds_sum, with a method label whose value is GET. Each sample contains a Float64 value and a millisecond-precision UNIX timestamp. Over time, these collected samples form the dynamic lines on a graph.
Most infrastructure components in the cloud-native ecosystem can expose metrics in the OpenMetrics text format. For components that do not natively support this, the Prometheus community provides a rich collection of Prometheus Exporters. These components (or Exporters) respond to periodic scraping requests from Managed Service for Prometheus to record their operational status in Managed Service for Prometheus for subsequent analysis. You can also use the multi-language SDKs from Managed Service for Prometheus to instrument your code, integrating your own business metrics into the Prometheus ecosystem.
Data visualization and analysis
After collecting application and infrastructure metrics, you can query, analyze, and compare multi-dimensional data to understand system state. Grafana, a leading open-source data visualization tool, offers a wide range of chart types and templates. Managed Service for Prometheus provides a fully managed Grafana service for querying, analyzing, and visualizing your monitoring data.
Timely alerting and incident management
When a service is at risk of failure, the monitoring system must notify administrators promptly so they can resolve issues or prevent them proactively, minimizing business impact. By analyzing different metrics and historical data, administrators can identify and resolve root causes.
Integration process overview
For Spring Boot applications, the community provides the Spring Boot Actuator framework, which simplifies code instrumentation, metric collection, and output for Java developers. Starting with Spring Boot 2.0, Actuator was rebuilt on Micrometer, providing more powerful and flexible monitoring capabilities. Micrometer is a metrics facade, analogous to SLF4J for logging. By using Micrometer, applications can connect to various monitoring systems, such as AppOptics, Datadog, Elastic, InfluxDB, and Managed Service for Prometheus.
When mapping metrics from Java applications, Micrometer uses the following semantics to map its metric types to the types used by Managed Service for Prometheus:
|
Micrometer metric type |
Managed Service for Prometheus metric type |
Typical use case |
|
Counter |
Counter |
A monotonically increasing value. For example, counting page views (PV), unique visitors (UV), or API calls. |
|
Gauge |
Gauge |
A variable that fluctuates over time. For example, resource utilization, system load, or request queue length. |
|
Timer |
Histogram |
Statistical distribution of data, typically for latency. For example, calculating P50, P90, and P99 latencies for an API call. |
|
DistributionSummary |
Summary |
Statistical distribution of data, similar in purpose to a Histogram. |
-
Micrometer's Counter metric type maps to the Counter type in Managed Service for Prometheus and is used to describe a monotonically increasing variable, such as the number of API calls, cache hits, or total visits. A Timer logically includes a Counter. If you use a Timer to collect response times for an API, it will also collect the number of calls. Therefore, you do not need to specify both a Timer and a Counter for the same API.
-
Micrometer's Gauge metric type maps to the Gauge type in Managed Service for Prometheus and is used to describe a variable that continuously fluctuates within a range, such as CPU utilization or the number of tasks in a thread pool queue.
-
Micrometer's Timer metric type maps to the Histogram type in Managed Service for Prometheus and is used to describe time-related data, such as the response time (RT) distribution of an API.
-
Micrometer's DistributionSummary metric type maps to the Summary type in Managed Service for Prometheus. Similar to a Histogram, a Summary is used for statistical distributions. However, because the distribution is calculated on the client side before being sent to Managed Service for Prometheus for storage, Summary results cannot be aggregated across multiple machines. This limits its use because it cannot provide a global view of data distribution.
Integration workflow
When you need to connect a Spring Boot application deployed in a Kubernetes cluster to Managed Service for Prometheus, you must follow the code instrumentation>application deployment>service discovery process.
First, add the required Spring Boot Actuator Maven dependencies to your code and either register the metrics you want to monitor or add annotations to the methods in your controllers.
Next, deploy the instrumented application in Kubernetes and register the metrics collection endpoint with Managed Service for Prometheus. This process is known as service discovery. Managed Service for Prometheus provides service discovery by using the ServiceMonitor custom resource definition (CRD).
Finally, after Managed Service for Prometheus successfully discovers the target application's metrics endpoint, you can configure data sources and create dashboards in Grafana. You can also configure alerts based on key metrics.
Monitoring goals
By connecting a Spring Boot application in a Kubernetes cluster to Managed Service for Prometheus, you can achieve the following:
-
Monitor the system entry point: Track key RED metrics (Rate, Errors, Duration) for external-facing APIs on a frontend service that handles customer traffic.
-
Monitor critical system paths: Observe key objects in the critical path of backend services, such as the queue status of a thread pool or the hit rate of an in-process Guava Cache.
-
Monitor business-relevant custom metrics: Implement monitoring for metrics specific to your business, such as the number of unique visitors for a particular API.
-
Monitor JVM performance: Keep track of JVM garbage collection (GC) and memory usage.
-
Centralize monitoring: Aggregate and display all the preceding metrics on a unified dashboard and configure alerts for key indicators.
Step 1: Configure Spring Boot Actuator
This topic uses a cloud-native microservice application built with Spring Boot and Spring Cloud Alibaba to demonstrate how to connect a Spring Boot microservice application in a Kubernetes cluster to Managed Service for Prometheus.
-
Add the Spring Boot Actuator dependencies to your
pom.xmlfile.<!-- spring-boot-actuator dependency --> <dependency> <groupId>org.springframework.boot</groupId> <artifactId>spring-boot-starter-actuator</artifactId> </dependency> <!-- prometheus dependency --> <dependency> <groupId>io.micrometer</groupId> <artifactId>micrometer-registry-prometheus</artifactId> </dependency> -
In the
application.propertiesfile, add the following configuration to expose the port for monitoring data. In this example, the port is 8091.# Add the following configuration to application.properties to expose metrics spring.application.name=frontend management.server.port=8091 management.endpoints.web.exposure.include=* management.metrics.tags.application=${spring.application.name}After the configuration is successful, you can access port 8091 of the application. The monitoring data in OpenMetrics format is available at the
/actuator/prometheuspath on this port.
Step 2: Instrument the code
To collect RED metrics for an API, add the @Timed annotation to the corresponding method. The following example adds @Timed to the index page API.
@Timed(value = "main_page_request_duration", description = "Time taken to return main page", histogram = true)
@ApiOperation(value = "Home page", tags = {"Home page operations"})
@GetMapping("/")
public String index(Model model) {
    model.addAttribute("products", productDAO.getProductList());
    model.addAttribute("FRONTEND_APP_NAME", Application.APP_NAME);
    model.addAttribute("FRONTEND_SERVICE_TAG", Application.SERVICE_TAG);
    model.addAttribute("FRONTEND_IP", registration.getHost());
    model.addAttribute("PRODUCT_APP_NAME", PRODUCT_APP_NAME);
    model.addAttribute("PRODUCT_SERVICE_TAG", PRODUCT_SERVICE_TAG);
    model.addAttribute("PRODUCT_IP", PRODUCT_IP);
    model.addAttribute("new_version", StringUtils.isBlank(env));
    return "index.html";
}Here, value is the name of the metric exposed to /actuator/prometheus, and histogram=true exposes a histogram metric for the API request duration so that you can calculate request time distributions such as P90 and P99.
If your application uses an in-process cache library such as Guava Cache and you want to track its runtime status, you can wrap key objects by using Micrometer's decorator methods.
Modifying the Guava cache
-
Inject
MeterRegistry. Spring Boot automatically injects thePrometheusMeterRegistryimplementation. -
Wrap the local cache by using a utility API, which is
GuavaCacheMetrics.monitorin the following code. -
Enable cache statistics recording by calling the
.recordStats()method. -
Name the cache object to generate the corresponding metrics.
@Resource
private static MeterRegistry meterRegistry;
private static final LoadingCache<String, String> REFRESH_CACHE = GuavaCacheMetrics.monitor(
        meterRegistry,
        CacheBuilder.newBuilder()
                .recordStats()
                .build(new CacheLoader<String, String>() {
                    @Override
                    public String load(String key) {
                        // Implement the specific load operation here.
                        return "";
                    }
                }),
        "refresh-cache");
Modifying the thread pool
-
Inject
MeterRegistry. The specific implementation injected here isPrometheusMeterRegistry. -
Wrap the thread pool by using a utility API.
-
Name the thread pool to generate the corresponding metrics.
@Resource
private static MeterRegistry meterRegistry;
private static final ScheduledExecutorService REFRESH_EXECUTOR = ExecutorServiceMetrics.monitor(
        meterRegistry,
        Executors.newScheduledThreadPool(1,
                new ThreadFactory() {
                        public Thread newThread(Runnable r) {
                            Thread thread = new Thread(r);
                            thread.setDaemon(true);
                            thread.setName("dubbo.outlier.refresh-" + thread.getId());
                            return thread;
                        }
                }),
        "refresh-executor"
);
To monitor business-specific custom metrics, inject MeterRegistry into your bean, then construct a Counter, Gauge, or Timer based on your requirements. Register it with the MeterRegistry to expose the metric, as shown in the following example.
@Service
public class DemoService {
    Counter visitCounter;
    public DemoService(MeterRegistry registry) {
        visitCounter = Counter.builder("visit_counter")
            .description("Number of visits to the site")
            .register(registry);
    }
    public String visit() {
        visitCounter.increment();
        return "Hello World!";
    }
}
This completes the required code modifications. You now need to rebuild the application image and deploy it to a Kubernetes cluster where Managed Service for Prometheus is installed. Then, configure a ServiceMonitor in the Managed Service for Prometheus console to enable service discovery. For more information, see Container Observability and instance management.
After the ServiceMonitor is configured, you can find the newly registered application in the Targets list.
On the Targets page, if you see default/frontend-service-monitor/0 (1/1 up) and the State is UP, this indicates the metrics endpoint (path: /actuator/prometheus) is running correctly and the ServiceMonitor configuration is active.
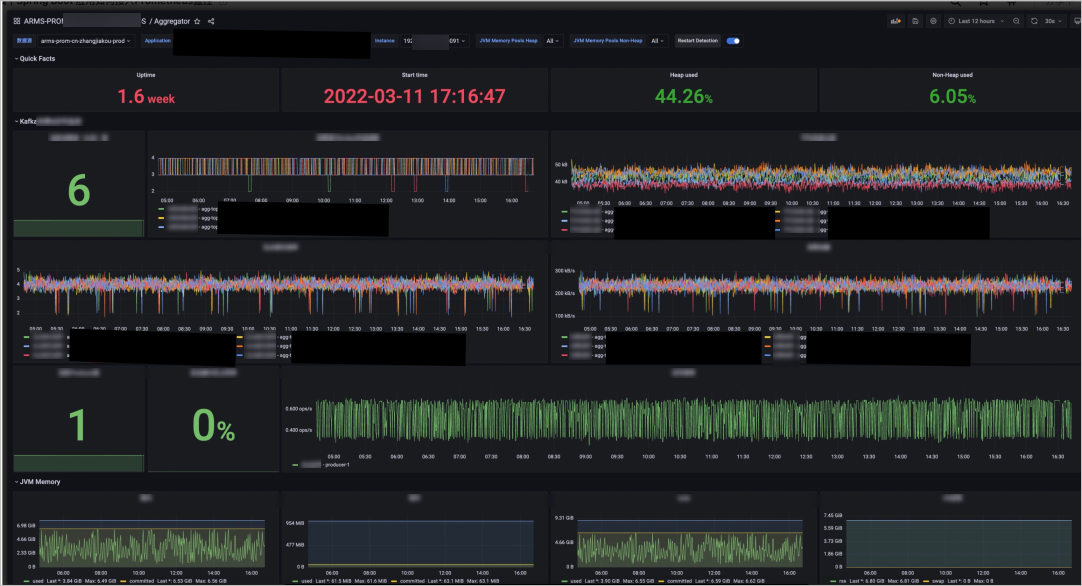
Step 3: Configure dashboards
Managed Service for Prometheus now collects and stores your application's monitoring data. You can configure dashboards and alerts to view the data. The following open-source Grafana community dashboard templates can help you build your own monitoring dashboard.
Using these templates and the built-in Grafana service of Managed Service for Prometheus, you can create a dashboard that consolidates key metrics for daily development and operations onto a single page. For example, a dashboard built from these templates can include an overview, component runtimes, memory usage, heap and non-heap memory, and generational GC status.