Monitor metrics from ECS instances in a VPC by using Managed Service for Prometheus. Enable Host Monitor to auto-install exporters, collect data, discard unnecessary metrics, and configure alerting.
Workflow
To monitor ECS instances, complete these steps:
-
Enable Host Monitor: Select a VPC to auto-install open source exporters. The managed Prometheus agent collects data automatically.
-
(Optional) Modify Host Monitor: Change settings such as the service port to fix errors or meet new requirements.
-
(Optional) Discard metrics: Drop unneeded metrics to reduce collection volume and costs.
-
(Optional) Configure alerting: Set up alert rules to detect metric changes and troubleshoot issues promptly.

Prerequisites
-
A VPC with one or more ECS instances is created. For more information, seeCreate and manage an ECS instance in the console (express version).
-
Alibaba Cloud Resource Center is activated. For more information, see Activate Resource Center.
NoteResource Center must be activated before monitoring. Managed Service for Prometheus relies on VPC and ECS data of the current account from Resource Center for service discovery.
1. Enable Host Monitor
When you enable Host Monitor for a VPC, Node Exporter and Process Exporter are installed on each ECS instance by default. The managed Prometheus agent then collects, stores, and visualizes data with unified alerting. About 1,000 metrics are collected per ECS instance per scrape.
1.1 Enable the component
-
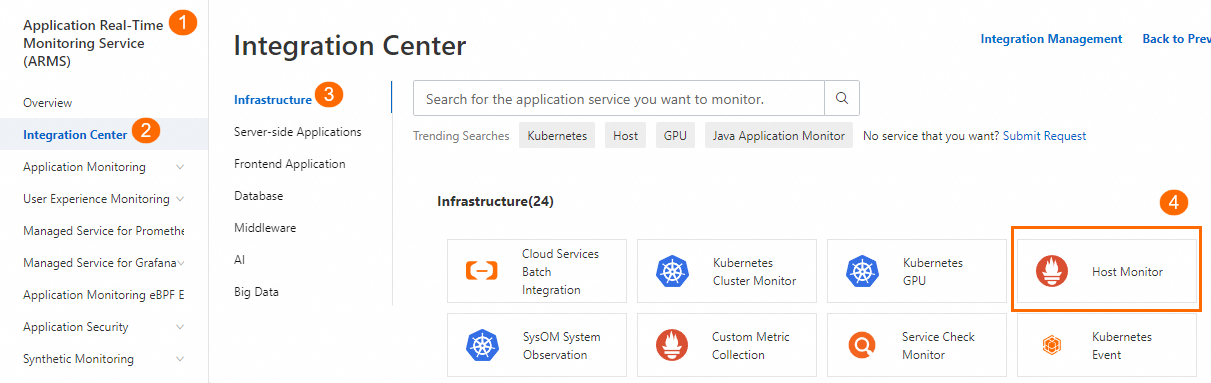
In the left-side navigation pane of the ARMS console, click Integration Center. In the Infrastructure section, click Host Monitor.
-
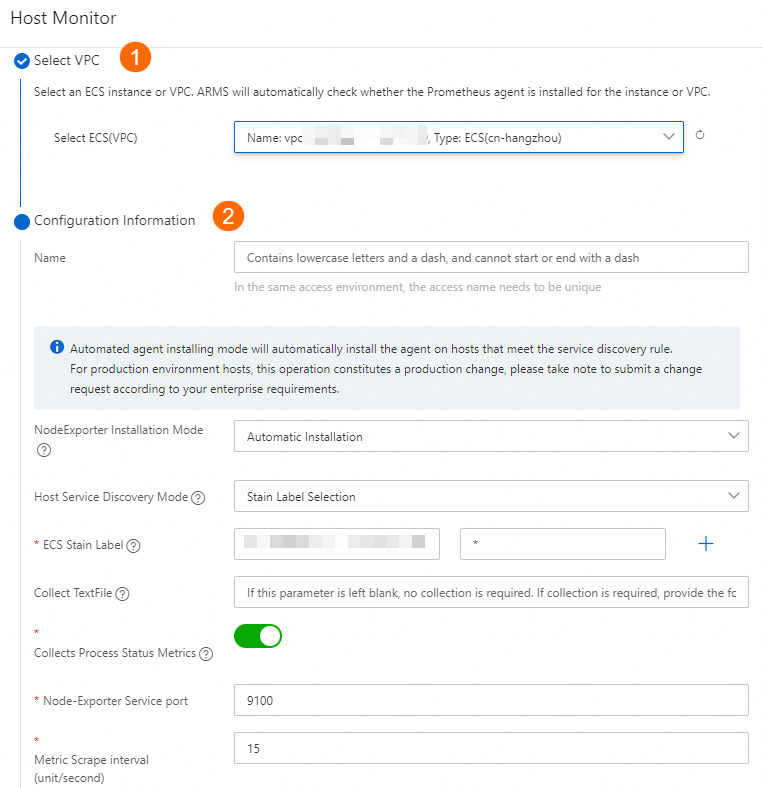
Select the VPC and configure parameters as described in Monitor ECS instances.
-
Click OK and wait 1 to 2 minutes.
1.2 View the dashboards
-
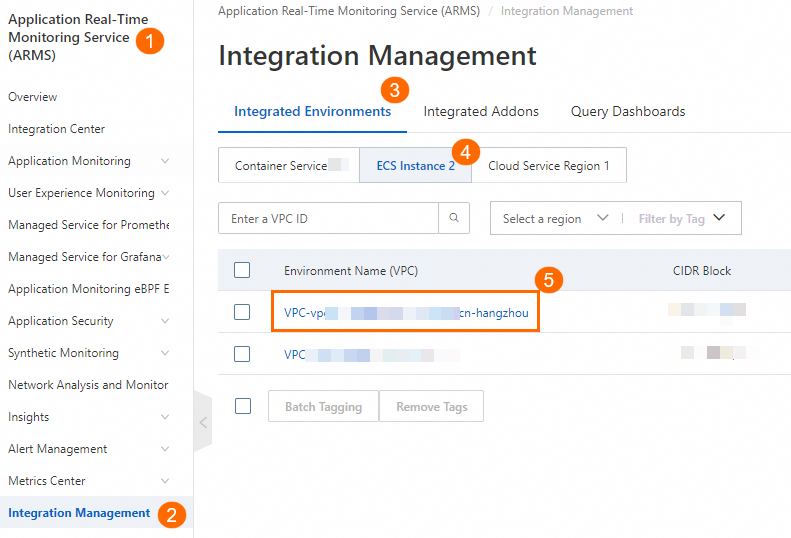
In the left-side navigation pane of the ARMS console, click Integration Management. On the Integrated Environments tab, click ECS Instance. Click the VPC ID to open the environment details page.
-
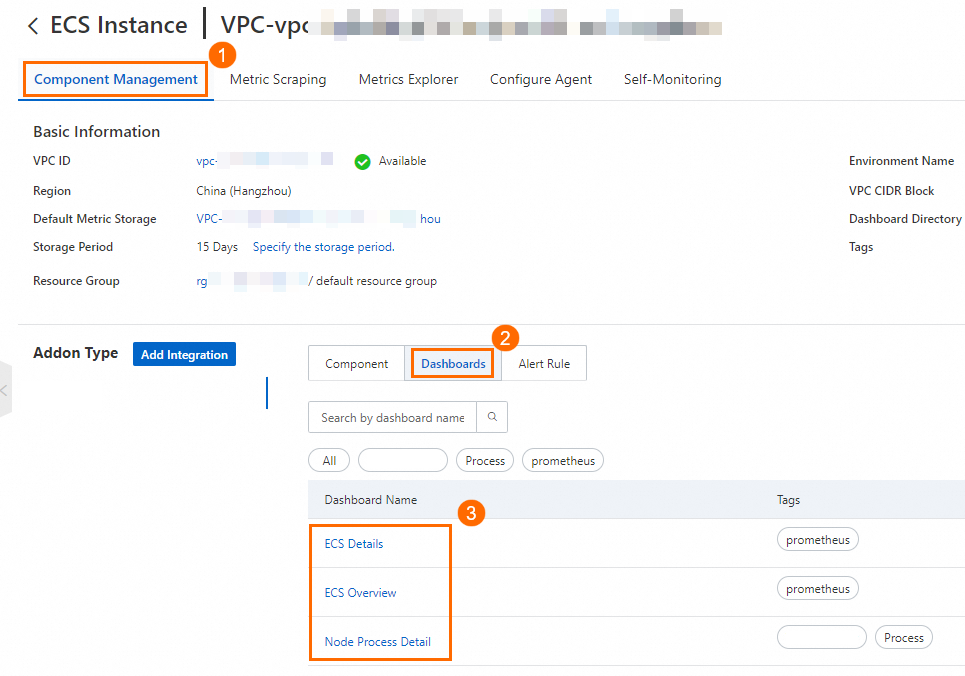
On the Component Management tab, click Dashboards in the Addon Type section to view the built-in Grafana dashboards.
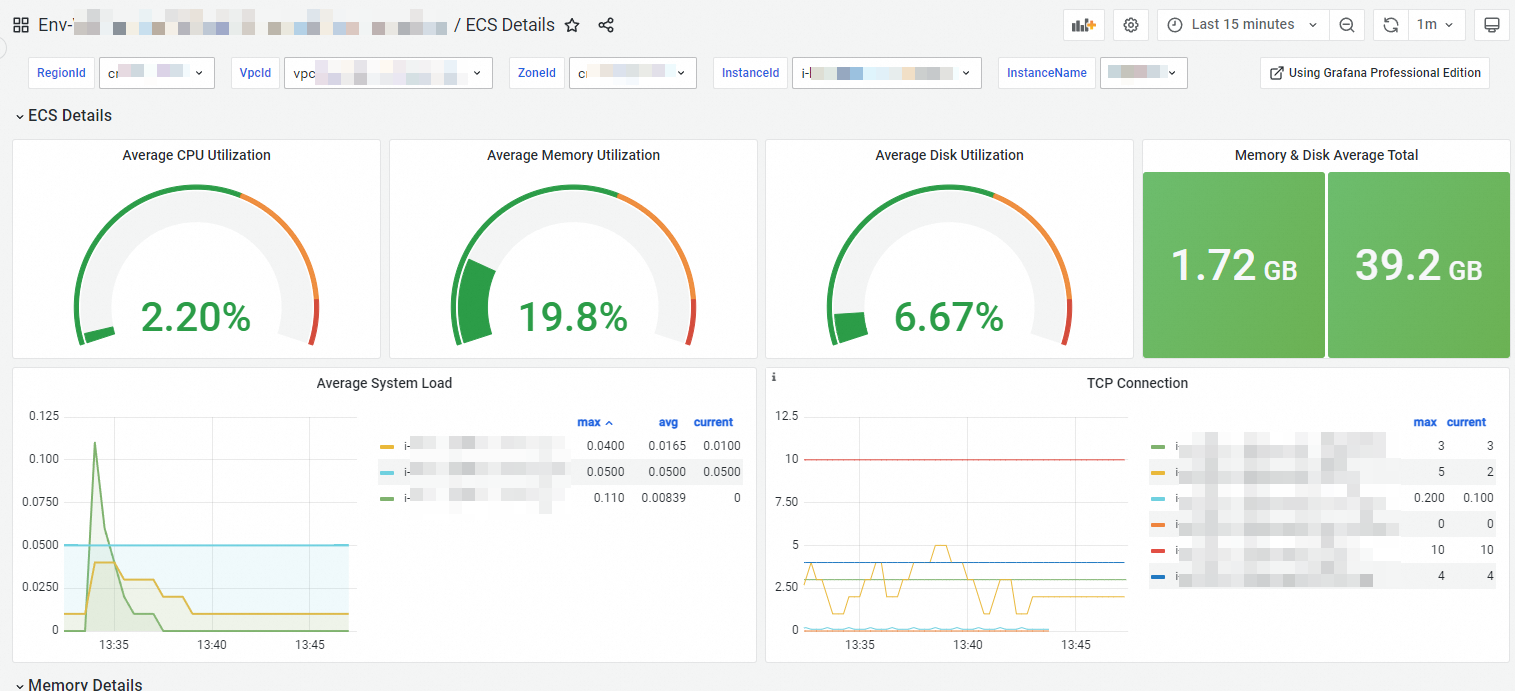 Note
NoteIf the dashboards have no data, check the security group settings. For more information, see Why do the dashboards have no data?
2. (Optional) Modify Host Monitor
Modify Host Monitor settings such as service discovery, service port, or data collection interval.
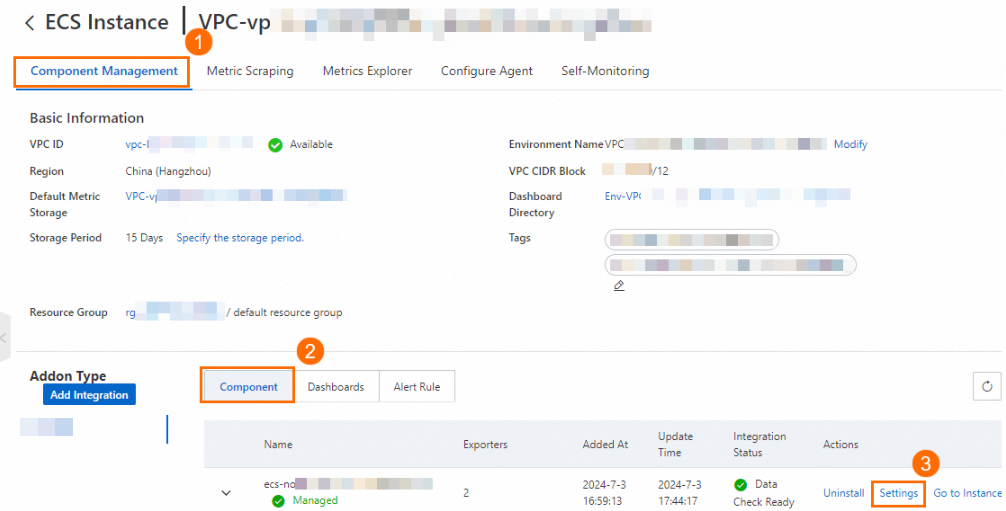
2.1 Procedure
-
In the left-side navigation pane of the ARMS console, click Integration Management. On the Integrated Environments tab, click ECS Instance. Click the VPC ID to open the environment details page.
-
Find the target exporter and clickSettings.
-
Adjust the settings and click OK. Parameter descriptions are in Monitor ECS instances.
2.2 Verification
-
Refresh the page and click Settings to verify the changes.
-
Check the dashboards to verify data accuracy. For more information, see the 1.2 View the dashboards section.
3. (Optional) Discard metrics
Discard unneeded metrics to simplify data analysis and reduce costs.
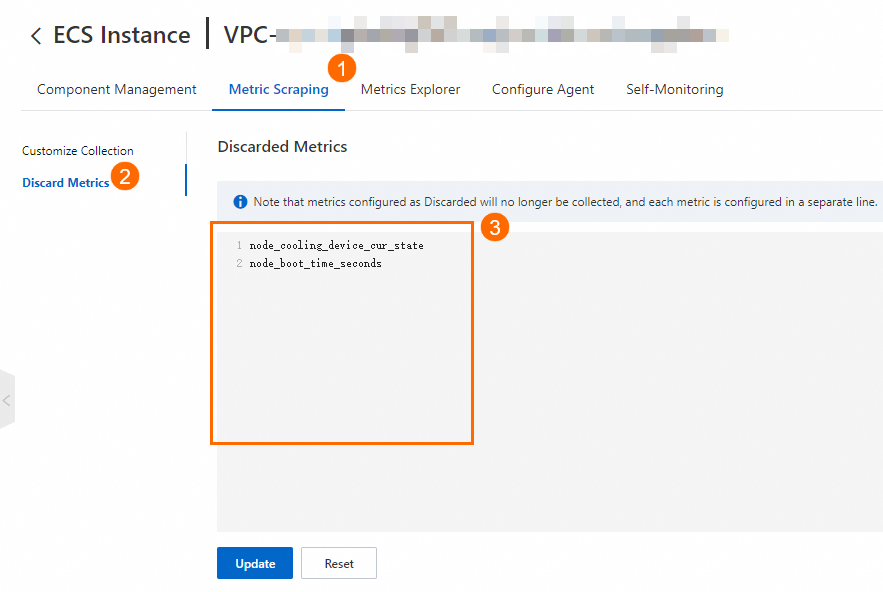
3.1 Procedure
-
In the left-side navigation pane of the ARMS console, click Integration Management. On the Integrated Environments tab, click ECS Instance. Click the VPC ID to open the environment details page.
-
In the Discard Metrics section of the tab, select the metrics to discard and click Update. For information about metrics, see Metrics.
 Note
NoteYou cannot discard the basic metrics about ACK clusters.
3.2 Verification
-
Click Update and refresh the page to verify the changes.
-
Check the dashboards to verify data accuracy. For more information, see the 1.2 View the dashboards section.
4. (Optional) Configure alerting
Configure alert rules to get notified when metric values change, enabling faster maintenance and troubleshooting.
Managed Service for Prometheus supports built-in and custom alert rules. Configure either type to match your requirements.
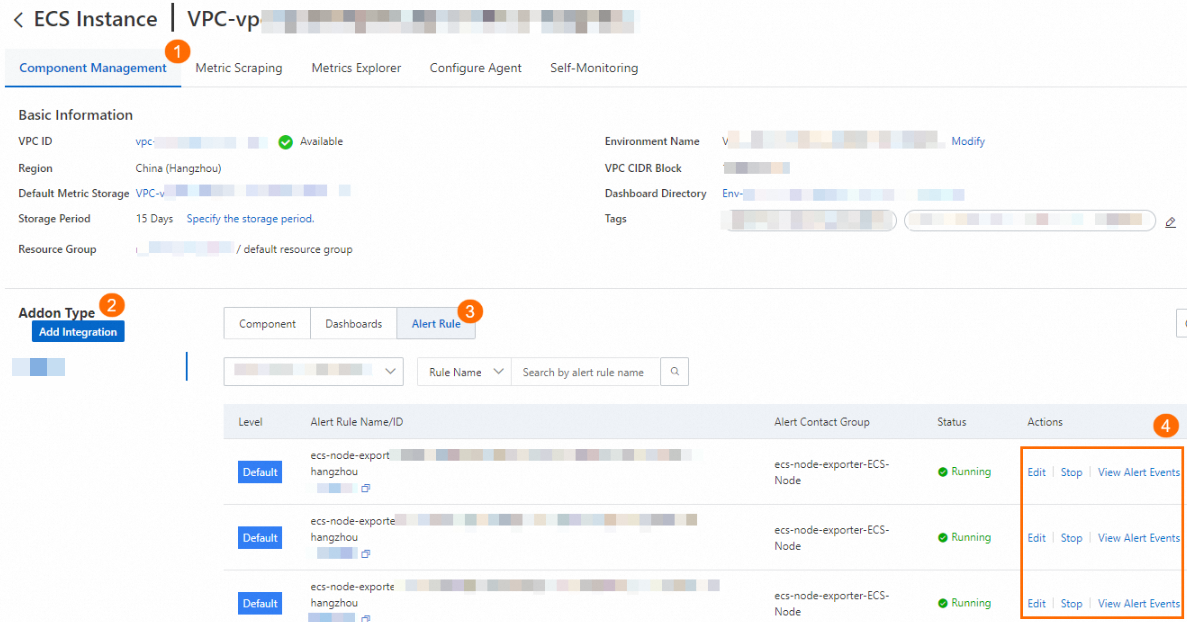
4.1 Configure built-in alert rules
Built-in alert rules generate events by default. Configure notifications manually.
-
In the left-side navigation pane of the ARMS console, click Integration Management. On the Integrated Environments tab, click ECS Instance. Click the VPC ID to open the environment details page.
-
In the Addon Type section of the Component Management tab, click Alert Rule. Click View Alert Event or Edit to view or modify an alert rule.
-
Adjust the alert rule and click OK. Configuration details are in Prometheus alert rules.
4.2 Configure custom alert rules
Create custom alert rules if the built-in rules do not meet your requirements.
-
In the left-side navigation pane of the ARMS console, click Integration Management. On the Integrated Environments tab, click ECS Instance. Click the VPC ID to open the environment details page.
-
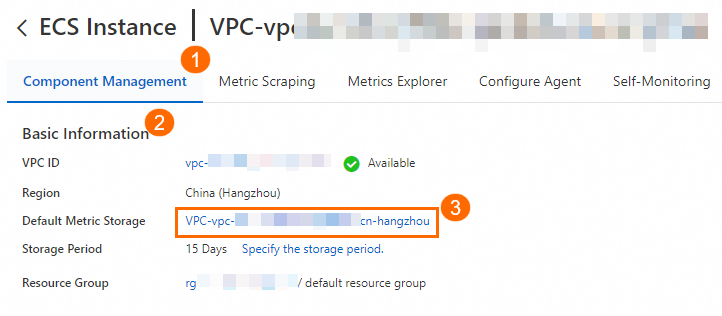
On the Component Management tab, click the VPC next to Default Metric Storage in the Basic Information section.
-
On the Alert rules page, create, modify, or view custom alert rules. See Prometheus alert rules.

4.3 Verification
-
Refresh the page to verify the changes.
-
Create a low-risk test alert rule, trigger it, and verify that it works as expected.
NoteNotification delivery depends on the alert rule configuration.