Symptom
After you add a ServiceMonitor or PodMonitor in Managed Service for Prometheus, Prometheus may fail to scrape the expected metrics.
Troubleshooting
Verify that the target has been discovered.
-
Log on to the Managed Service for Prometheus console.
-
In the left navigation pane, click Instances.
-
Click the name of the target Prometheus instance. In the navigation pane on the left, click Service Discovery, and then click the Targets tab to check if the corresponding target has been discovered.
-
If the target is not discovered:
-
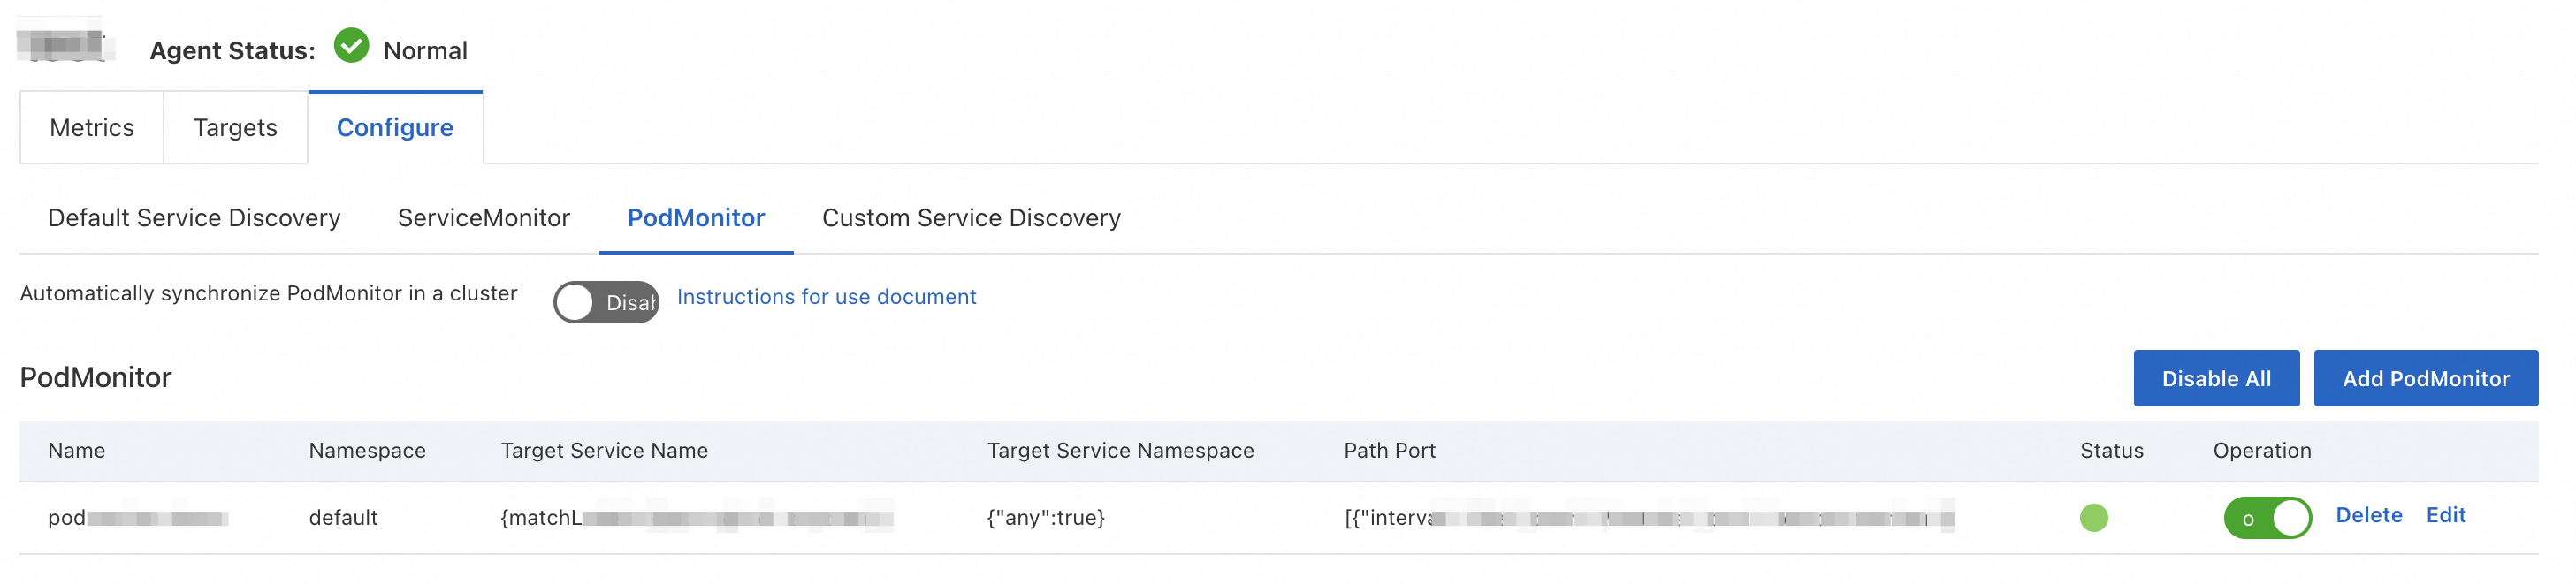
Check if the ServiceMonitor or PodMonitor is enabled.
On the Service Discovery page, click the Configurations tab, and then click the ServiceMonitor or PodMonitor tab. If the status is enabled (①), continue to the next step.
-
Check if the ServiceMonitor or PodMonitor resource has been applied to the ACK cluster.
-
Log on to the ACK console.
-
In the navigation pane on the left, click Cluster. On the Clusters page, click the name of the target cluster.
-
In the navigation pane on the left, choose .
-
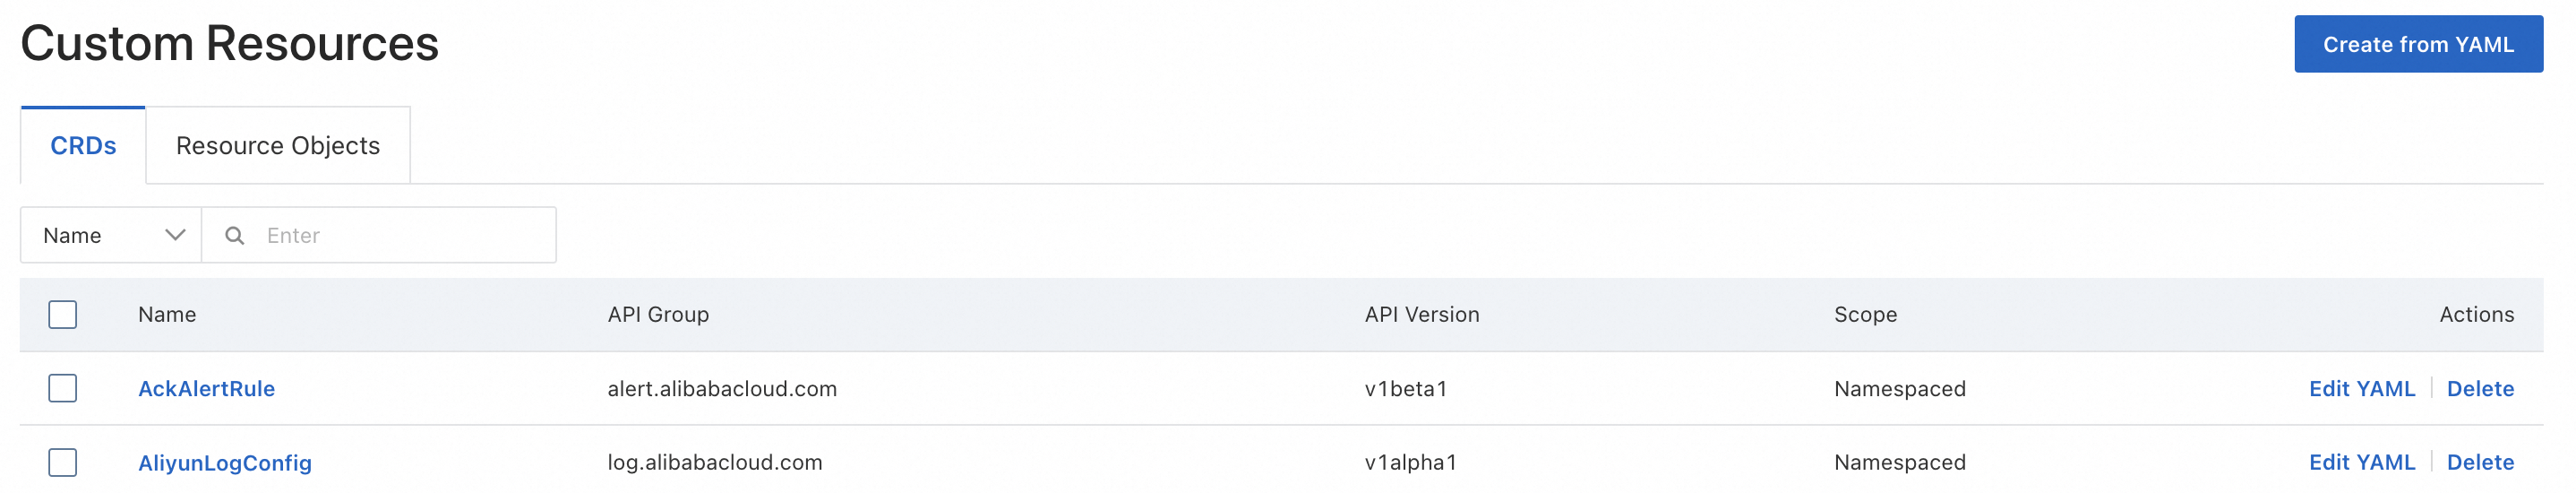
On the CRDs tab, click the ServiceMonitor or PodMonitor link in the Name column (①). This opens the Resource Objects tab. Select the namespace and check if the ServiceMonitor or PodMonitor you enabled is listed.
-
If it is not in the list: In the Managed Service for Prometheus console, go to the Service Discovery page, click the Configurations tab, and re-enable the ServiceMonitor or PodMonitor in the Operation column.
-
If it is listed, continue to the next step.
-
-
-
Verify that the label selector matches the target pod or service.
Run the following command and check the output. If no results are returned, adjust the label selector or namespace selector to match the target pod or service.
# If 'any' is set to true in the namespace selector. kubectl get pod/service -l label_key=label_value -A # If a namespace is specified, use the specified namespace. kubectl get pod/service -l label_key=label_value -n xx_namespace_xx -
Check the port settings.
-
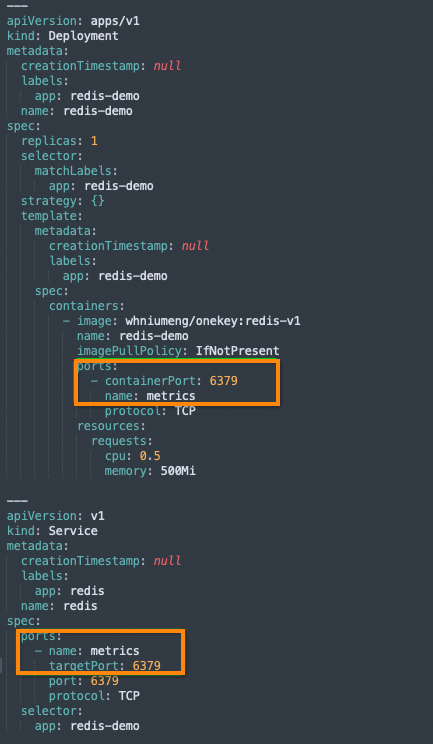
The
portfield must match the value of thespec.containers[i].ports[i].namefield in thepoddefinition, or thespec.ports[i].namefield in theservicedefinition. -
The
targetPortfield must match the value of thespec.containers[i].ports[i].containerPortfield in thepoddefinition, or thespec.ports[i].targetPortfield in theservicedefinition.
Example:
-
-
-
If a target is discovered but its state is red:
This indicates that Prometheus failed to scrape the target. This issue is usually caused by a problem on the target side. Troubleshoot the issue based on the error message in the Error column.
-
If a target is discovered and its State is UP (①), but Prometheus still does not scrape the expected metrics:
Click the endpoint link (②) for the target. This action pulls raw data from the target. Verify that this data contains the expected metrics. If the expected metrics exist, go to the Metric tab of the Service Discovery page. In the upper-right corner, click Configure Discarded Metrics. In the dialog box, check if the metric is on the discarded list. If a metric is on the list, it was manually discarded. You can remove the metric from the list to re-enable it. For more information, see Enable discarded metrics.
-
References
-
To configure service discovery for a ServiceMonitor or PodMonitor, see Manage service discovery for an ACK cluster.
-
To view metrics collected by service discovery, see Enable discarded metrics.
-
After you configure service discovery for a ServiceMonitor or PodMonitor, the system may scrape relevant metrics and incur charges. For more information about billing, see Billing and Billing (legacy).