To integrate Managed Service for Prometheus with third-party systems such as Grafana, Istio, and Horizontal Pod Autoscaler (HPA), you must obtain the API URL of Prometheus. After you obtain the API URL, add it to the third-party system you want to integrate.
Integration requires two steps: get the API endpoint from the Managed Service for Prometheus console, then configure the endpoint in your third-party system.
Prerequisites
Before you begin, make sure that you have:
A Managed Service for Prometheus instance
Access to the Managed Service for Prometheus console
Administrator or read access to the third-party system you want to integrate (Grafana, Istio, or HPA)
Get the API endpoint
In the left-side navigation pane, click Monitoring List.
Find your Prometheus instance and click Settings in the Actions column.
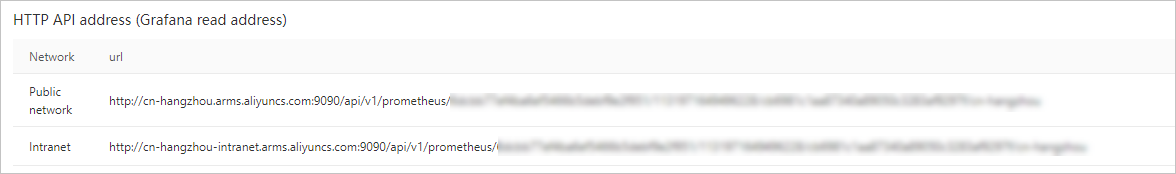
On the Settings tab, copy the public HTTP API address or the private HTTP API address based on your business requirements.
For a Prometheus instance for cloud services, copy the HTTP API address that corresponds to the specific cloud service.
Generate an authentication token (optional)
To secure data transfer between Managed Service for Prometheus and Grafana, generate an authentication token:
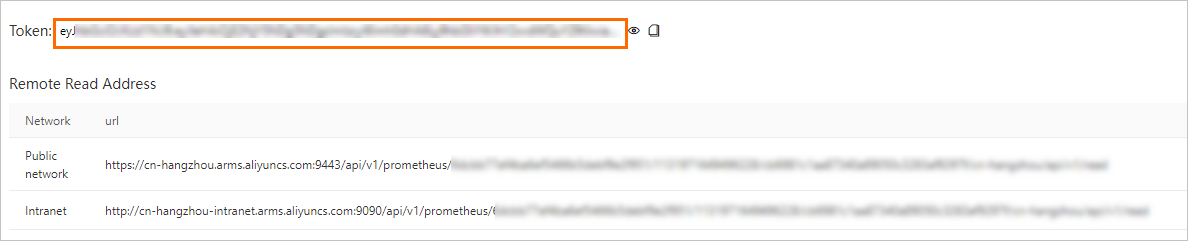
On the Settings tab, click Generate Token in the upper part of the tab to obtain the authentication token of the Prometheus instance.
Copy the generated token and store it securely.
After you generate a token, you must specify the token when you add the Prometheus instance as a data source in Grafana. Otherwise, Grafana cannot read monitoring data from Managed Service for Prometheus.
Configure the third-party system
After you copy the API endpoint, add it to your target system as the Prometheus data source URL.
Grafana
For detailed instructions on how to integrate Prometheus with Grafana, see Import data from Managed Service for Prometheus to a local Grafana system.
Istio
Set the HTTP API address as the external Prometheus endpoint in your Istio deployment. This directs Istio to query metrics from the managed Prometheus instance instead of a self-managed one.
HPA
Kubernetes HPA relies on a metrics adapter to query custom metrics from Prometheus. Point the adapter to the HTTP API address you copied from the Settings tab to use managed Prometheus metrics for autoscaling.