ARMS Prometheus Helm 1.1.17 / Agent v4.0.0 improves collection stability, fixes known bugs, and optimizes resource consumption.
If your cluster runs ARMS Prometheus Agent v3.x.x, upgrade to the latest version immediately. Older versions have unoptimized components and risk data disconnection.
v4.0.0 features
|
Change Type |
Release Content |
|
New Feature |
Cluster event collection task. Supports Kubernetes Deployment dashboards. |
|
New Feature |
SLA-based self-monitoring metric instrumentation. Provides SLA stability dashboard data. |
|
New Feature |
ServiceMonitor supports BasicAuth authentication. The Secret must be in the same namespace as the ServiceMonitor. |
|
New Feature |
Metrics Metadata displays metric definitions. |
|
New Feature |
Passes the Agent Chart version to the server, which initializes or upgrades dashboards accordingly. |
|
New Feature |
RemoteWrite self-monitoring metrics. Records the time spent sending data per batch. |
|
Add |
Self-monitoring metrics for basic metric collection errors and collection delays. |
|
New Feature |
Self-monitoring metrics for business metric collection errors and delays. |
|
Optimization |
RemoteWrite `queue_config` defaults: `min_shards=10`, `max_samples_per_send=5000`, `capacity=10000`. Improves adaptability for large-scale clusters. |
|
Optimization |
CSI collection Job service discovery for PV collection. |
|
Optimization |
Reduces `syncWorkersSeries` frequency in SenderLoop to minimize unnecessary disturbances. |
|
Optimization |
Streamlines logs and adds detailed scrape link timing. |
|
Optimization |
Basic metric collection Jobs use dedicated collection cycles and timeout settings instead of global configurations. |
|
Optimization |
Master-Worker multi-replica isolation. Master and Worker, and Worker and Worker no longer affect each other. |
|
Optimization |
Optimized Master Target distribution. Saves ~30% CPU and ~40% memory overhead. |
|
Optimization |
Metrics relabel optimization. CPU usage reduced by 70%. |
|
Optimization |
Informer listener logic in multi-tenant scenarios. Saves ~20% CPU overhead. |
|
Optimization |
Falls back to cached IP when CoreDNS resolution fails. Improves data sending stability. |
|
Optimization |
Improves SendConfig distribution stability for collection configurations. |
|
Optimization |
Optimized Master pre-scrape policy. Reduces resource overhead and improves service discovery and Target scheduling. |
|
Optimization |
Adaptive handling for data batches exceeding 1 MB. Reduces packet loss from backend limits. |
|
Bug Fix |
ScrapeLoop: Individual collection Targets could not stop, causing duplicate collection. |
|
Bug Fix |
Multi-tenant scenario: Pod Label cache not updated promptly, causing one timeline to become two. |
|
Bug Fix |
Master: abnormal Target distribution after OOM or replica restart, causing loss of some collection Targets. |
|
Bug Fix |
RemoteWrite: Issues with parsing Secret types and transmitting headers. |
|
Bug Fix |
Kubernetes-pods: Shutdown operations occasionally not taking effect. |
|
Bug Fix |
Global default parameters and `external_labels` now take effect correctly. Custom modifications are also supported. |
Upgrade Risks
-
The upgrade to Helm 1.1.17/Agent v4.0.0 is disruptive. Monitoring data may disconnect for 0 to 5 minutes depending on the volume of Targets and Series in your cluster.
-
Before upgrading, complete 1. Pre-upgrade checks (required) to minimize data disruption.
-
After upgrading, check for data anomalies in 3. Post-upgrade checks (optional). For troubleshooting, refer to the Post-upgrade FAQ. If issues persist, contact a Prometheus technical expert on DingTalk (ID: aliprometheus).
Upgrade Methods
1. Pre-upgrade checks (required)
Upgrading from a Helm version earlier than 1.1.16 to 1.1.17 does not retain previously modified parameters. Record any custom parameters before upgrading so you can restore them manually afterward.
Upgrades from Helm 1.1.16 or later support parameter inheritance and do not require manual restoration. To check parameters before upgrading:
-
Log on to the ACK console.
-
Click the target cluster name. In the left navigation pane, choose Workloads > Stateless. Switch the namespace to
arms-prom. In the Actions column forarms-prometheus-ack-arms-prometheus, choose More > View YAML. -
Check the following parameters:
-
`spec.replicas`: defaults to 1 after upgrade. No action needed if the value is 1.
-
`spec.containers` `args` (Agent startup parameters). Not present if multi-tenancy is disabled. Restore any custom values manually after upgrading.
-
tenant_userid
-
tenant_clusterid
-
tenant_token
-
-
`spec.containers.resources`: default limits are 3 cores / 4 GB; default requests are 1 core / 1 GB.
Record any non-default values and restore them after upgrading.

To retain modified parameters, record their values. After upgrading, open the YAML again and click Update to restore them.

-
2. Upgrade steps
To upgrade the ARMS Prometheus Helm component in the ACK console:
-
Log on to the ACK console.
-
Click the target cluster name. In the left navigation pane, choose Operations Management > Component Management. Click the Logs and Monitoring tab. On the `ack-arms-prometheus` card, click Upgrade.
-
After the upgrade, in the left navigation pane, choose Operations Management > Prometheus Monitoring. Click Go to Prometheus Service in the upper-right corner to view the Agent running status and metric collection details.
In the left navigation pane, click Settings. On the Settings tab, verify that the Helm version is updated.

3. Post-upgrade checks (optional)
-
Log on to the Cloud Monitor console.
-
In the navigation pane on the left, choose to open the instance list for Managed Service for Prometheus.
-
Click the target Prometheus instance name. In the left navigation pane, click Service Discovery. On the Targets tab, verify the Job collection status.
-
In the left navigation pane, click Settings. On the Self-Monitoring tab, click Go to Grafana to view dashboards in the upper-right corner. Verify that the replica count, data sending rate, and resource consumption are normal.
-
On the Self-Monitoring page, select the Agent Self-Monitoring tab to view the Prometheus Agent self-monitoring dashboard.
Monitor the four basic metric collection Jobs: `_arms/kubelet/cadvisor`, `_arms/kubelet/metric`, `_kube-state-metrics`, and `node-exporter`. Select a time range covering the period before and after the upgrade to check for anomalies.
Post-upgrade FAQ
Running replica count does not match expected count
ARMS Prometheus requires all replicas to be Running. Check for Pending agents in the Container Service console: go to the target cluster, then Workloads > Stateless in the arms-prom namespace.
Agent consumes excessive memory or CPU
Data sending anomalies can cause data to accumulate in agent memory. In the Container Service console, go to Operations Management > Prometheus Monitoring and click the Others tab. Under Prometheus Agent, check memory and CPU consumption.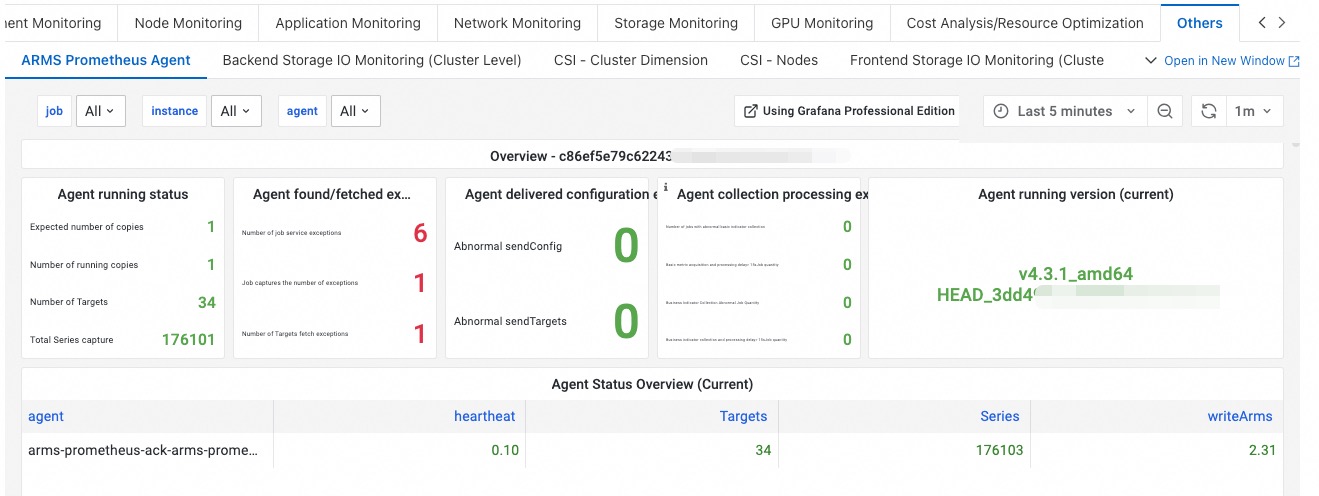
Basic metrics show disconnection or discontinuity
If metrics such as `node_***` (①), `container_***` (②), `kubelet_***` (③), or `kube_***` (④) are abnormal, check the basic metric collection Jobs on the Service Discovery > Targets page in the Prometheus console. If errors persist, contact a Prometheus technical expert on DingTalk (ID: aliprometheus).
RemoteWrite traffic drops or data is missing
-
If you have not configured RemoteWrite, you can ignore this issue.
-
In v4.0.0, `write_relabel_configs` is automatically enabled. If you configured `drop` or `keep` actions, you may experience traffic loss. To modify this field, go to Settings > Settings and click Edit Prometheus.yaml.
