Managed Service for Prometheus allows you to monitor a Service Mesh (ASM) instance and collect performance data from data plane Envoys. This way, you can enhance the observability and operability of the instance, and ensure high availability and security of your business. This topic describes how to monitor an ASM instance.
Prerequisites
Managed Service for Prometheus is activated. For more information, see Billing overview.
A Container Service for Kubernetes (ACK) cluster is created. For more information, see Create an ACK managed cluster.
Alibaba Cloud Resource Center is activated. For more information, see Activate Resource Center.
Procedure
Log on to the Managed Service for Prometheus console. In the left-side navigation pane, click Integration Center.
Click Alibaba Cloud ASM and set the parameters as prompted. The following table describes the key parameters.
Parameter
Description
Enable advanced feature
Specify whether to converge metrics, which saves costs.
Metric collection interval(Unit/second)
The interval for collecting monitoring data. The default value is 15.
View and manage the monitoring data of the ASM instance
The installed component is displayed on the Integration Management page in the Managed Service for Prometheus console. The Integration Management page consists of the Integrated Environments, Integrated Addons, and Query Dashboards tabs, where you can view information such as targets, metrics, dashboards, and alerts.
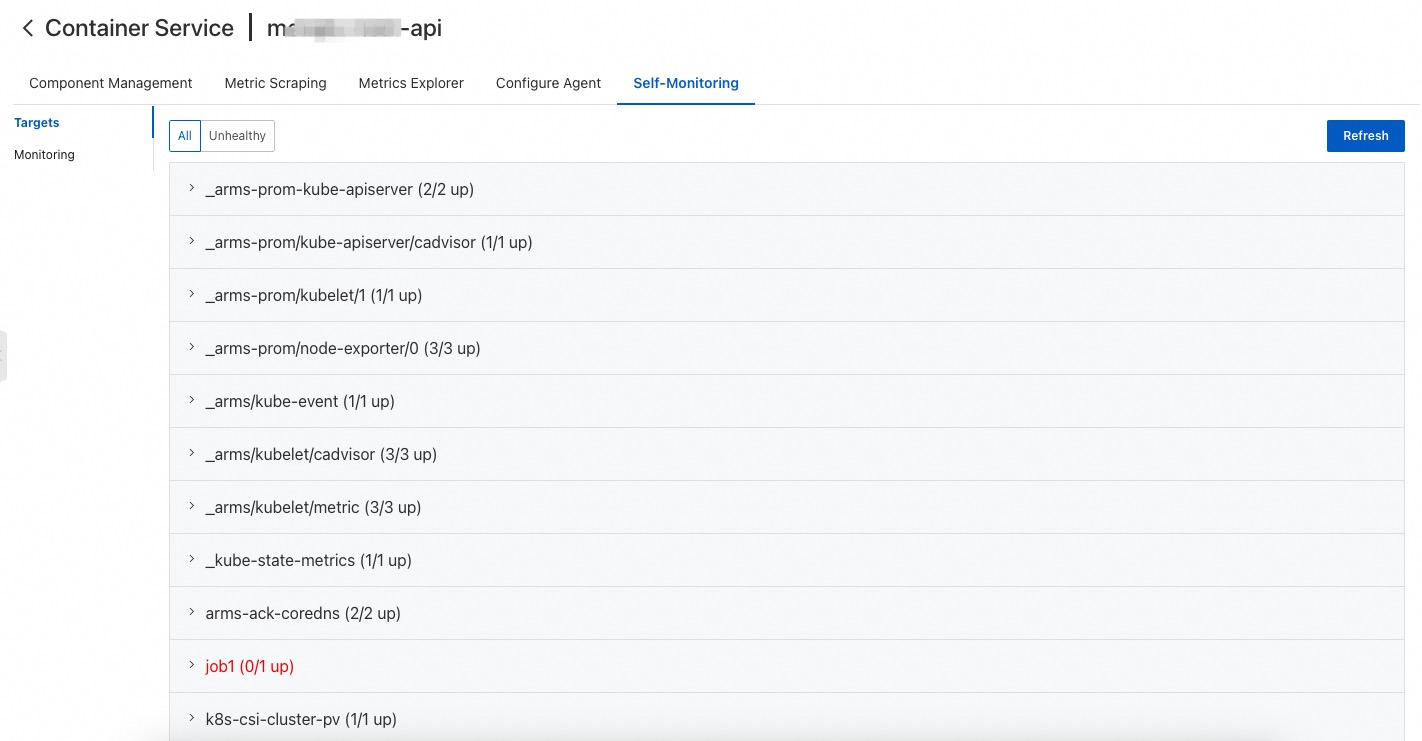
Targets
In the Targets section of the Self-Monitoring tab, you can view the list of targets discovered by the default jobs.
Metric Scraping
On the Metric Scraping tab, you can view or discard metrics. For more information, see Discard metrics.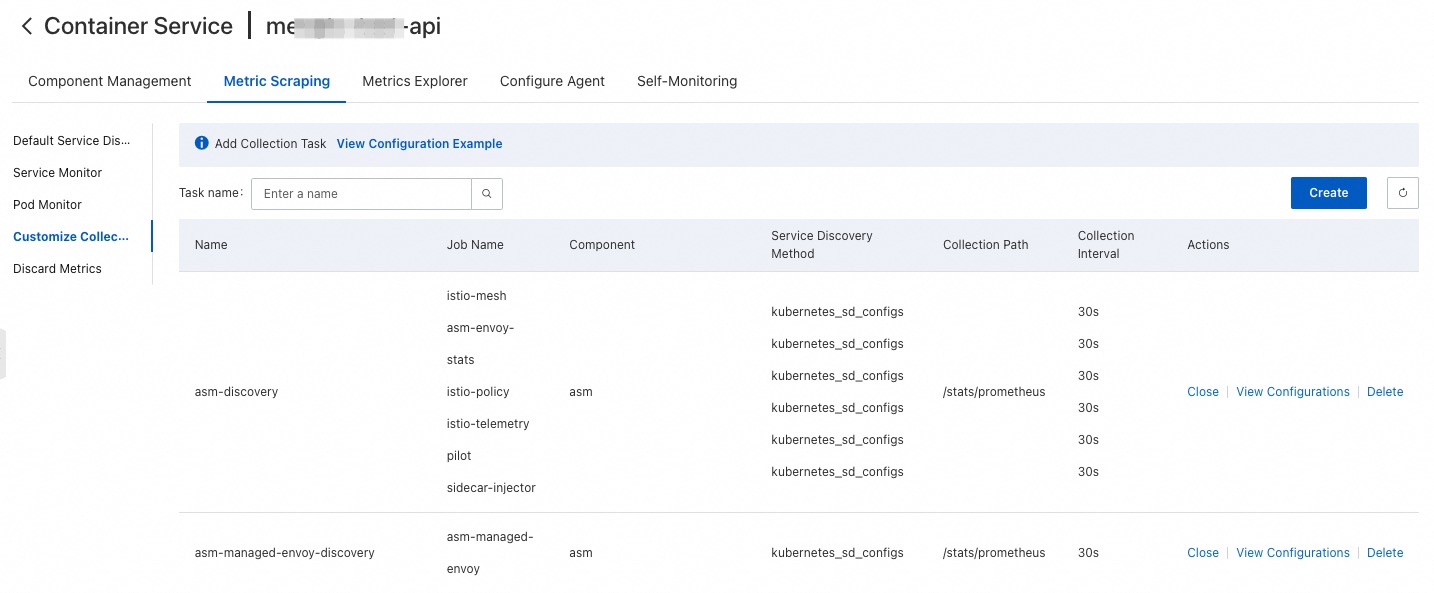
Dashboards
In the Dashboards section of the Component Management tab, you can click a dashboard name to go to Grafana and view more dashboard data.

Alert Rule
In the Alert Rule section of the Component Management tab, you can view the alert rules of the ASM instance. For information about how to create alert rules, see Create an alert rule for a Prometheus instance.